

Diego Thomazini
For those checking in on our Seasonality Tool in the past week, the current point of the year can either look like one of the worst, middling, or best times of the year, depending on the time frame. As shown below, the median one-week performance of the S&P 500 from the close on 9/20 over the last ten years has been a decline of 95 bps, which ranks in just the fourth percentile of all days of the year. Extending out to look at the S&P 500’s median one-month performance, the 105 bps median gain is about smack dab in the middle of the range of historical one-month returns. Moving out to three months, the S&P 500’s median gain of 578 bps ranks in the top 5% of all days.
S&P 500 Seasonality (Bespoke Premium)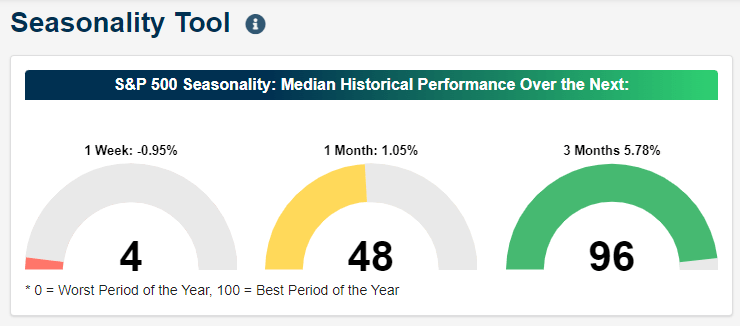
To look at seasonality in another way, the charts below show the average S&P 500 5-day performance (including a smoothed look via a 7-day moving average) and the percentage of time the index has traded positively at each calendar day of the year going all the way back to 1945. The current week of the year has averaged some of the worst one-week returns for the S&P 500 across all years of the post-WWII period, while the index has tended to fall more often than not.
S&P 500 Seasonality – Average 5-Day % Change, % Of Time Positive (Author)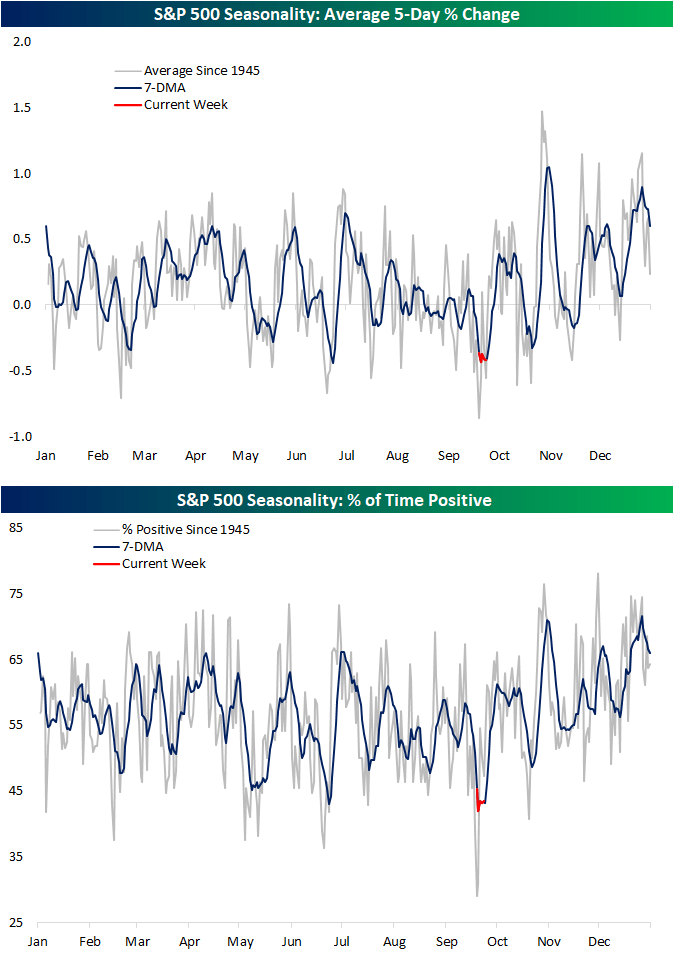
Again, contrary to short-term seasonal weakness, taking a similar look but using a 3-month performance window, we are entering one of the best times of the year. As shown below, the second half of September into October sees the average 3-month performance rocket higher, and by early October, has tended to be the strongest of any point of the year.
S&P 500 Seasonality – Average 3-Month % Change, % Of Time Positive (Author)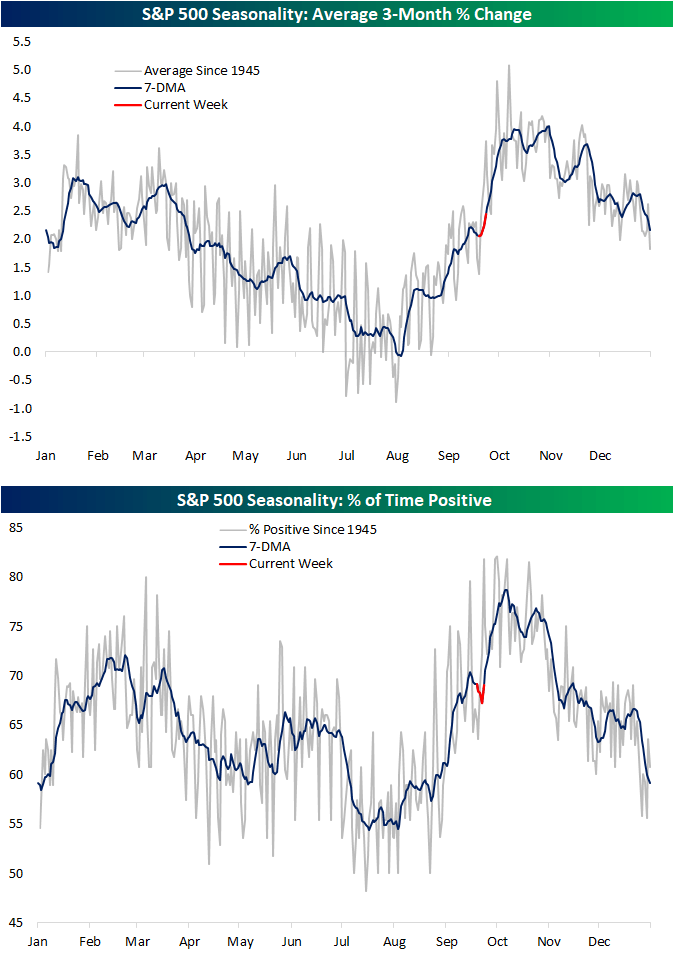
Editor’s Note: The summary bullets for this article were chosen by Seeking Alpha editors.
Be the first to comment