


tupungato
When the stock market plunges, the pain is often felt by everyone or almost everyone who is long securities. Although this can be awful in the near term, it can also open up the door for attractive opportunities for long-term investors to buy in on the cheap. One company that seems to have been pushed irrationally low in recent months is Winnebago Industries (NYSE:WGO). Even if financial performance reverts back to what it was prior to the pandemic, shares of the company look quite affordable. Because of this and because of continued strength through the majority of the firm’s 2022 fiscal year, I have decided to keep my ‘buy’ rating on the business for now.
Amazing strength persists
Back in October of 2021, I wrote an article that looked favorably upon recreational vehicle and marine products producer Winnebago Industries. In that article, I said that the long-term outlook for the enterprise was positive. I acknowledged that shares were attractively priced at that time, stressing the probability that the stock would eventually move higher from there. I ultimately rated the company a ‘buy’, reflecting my belief that it would, for the foreseeable future, outperform the broader market. Since then, a great deal has happened with the broader market and with fears mounting about the impact that a recession might have on a business like this. Because of this, shares of the firm have fallen quite a bit, plunging by 16.6% as of this writing. That compares to the 12.1% decline experienced by the S&P 500 over the same timeframe.
Author – SEC EDGAR Data
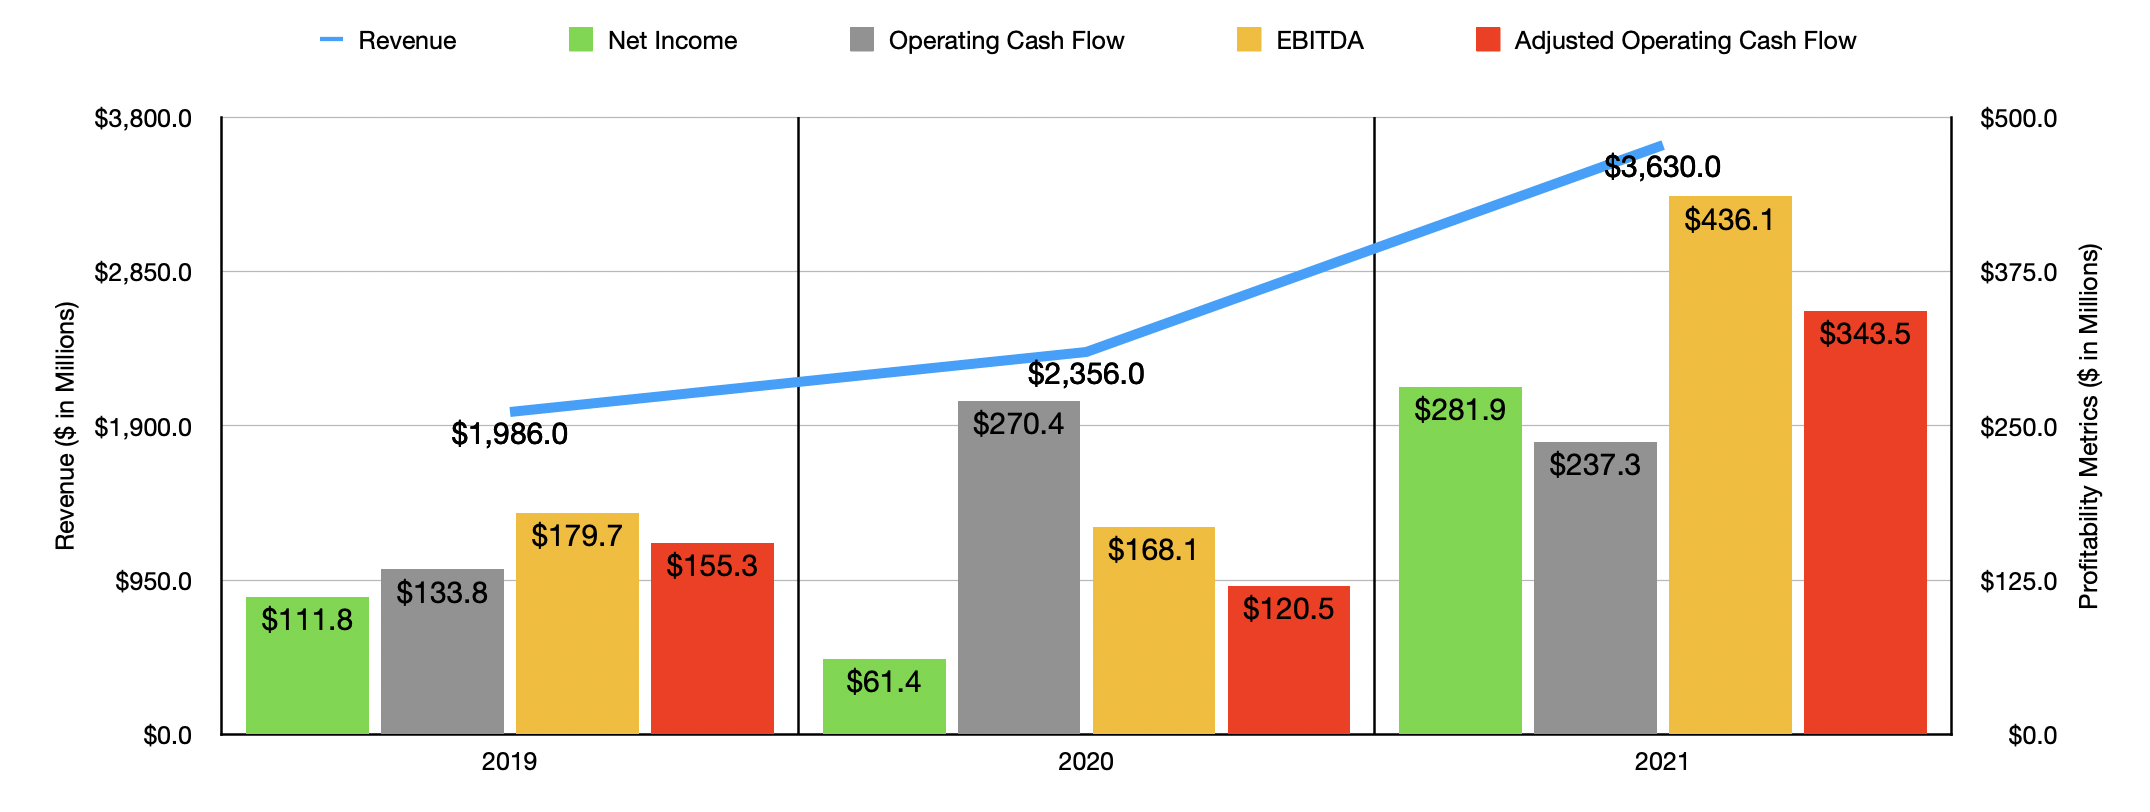
Given this significant decline, you might think that the fundamental performance of Winnebago Industries has suffered as of late. But that couldn’t be further from the truth. Consider financial performance for the 2021 fiscal year. Revenue during that time came in at $3.63 billion. That’s 54.1% higher than the $2.36 billion generated in the 2020 fiscal year. This significant improvement was driven by a couple of factors. For starters, even though revenue in 2020 was higher than it was in 2019, management said that sales were depressed in 2020 because of the COVID-19 pandemic. So some of this was as a result of a recovery from that. In essence, it could be likened to pent-up demand. The company also attributed some of this to its acquisition of Newmar in the first quarter of 2020. Strong organic unit sales growth contributed, as well as price increases and lower discounts and allowances due in part to this strong demand. In fact, for the wholesale category, management saw industry shipments across the USA and Canada rise by 47.8% from 2020 to 2021, while for the retail category the increase was 22.6%. This is for both towable and motorhome categories of recreational vehicles.
As revenue has risen, profitability has followed suit. Net income rose from $61.4 million in 2020 to $281.9 million last year. Other profitability metrics were also positive. Although operating cash flow actually fell from $270.4 million to $237.3 million, the picture changes if we exclude working capital adjustments. Excluding those, the metric would have risen from $120.5 million to $343.5 million. Meanwhile, EBITDA would have increased from $168.1 million to $436.1 million.

Author – SEC EDGAR Data
For the 2022 fiscal year, growth for the company continued. Sales of $3.78 billion in the first three quarters of the year dwarfed the $2.59 billion generated just one year earlier. This was driven by a number of factors. Under the towable operations, sales jumped by 45.1%, with unit count climbing by 11.2% and average selling price jumping by 30%. Under the motorhome category, sales grew by 24.3%. This was driven by a 10.4% rise in motor home deliveries and by a 13.1% increase in average selling price. The most significant growth, however, came from the marine operations of the firm. The number of units Delivered rose from just 213 in the first nine months of 2021 to 4,112 The same time this year. This was offset some by a 63.8% decline in average selling price. Management attributed much of this change to the acquisition of Barletta at the start of the first quarter of the 2022 fiscal year.
This improvement in revenue also brought with it rising profitability. In the first three quarters of 2021, net income came in at $197.8 million. This number skyrocketed to $308 million the same time this year. Operating cash flow rose from $148 million to $245.2 million. If we adjust for changes in working capital, it would have risen from $243.1 million to $403.4 million. Meanwhile, EBITDA rose nicely, climbing from $307 million to $509.7 million. We don’t actually know what the rest of the year will look like. But if we annualize results experienced so far, we should anticipate net income for the year of $439 million, adjusted operating cash flow of $570 million, and EBITDA of $724 million.
Author – SEC EDGAR Data
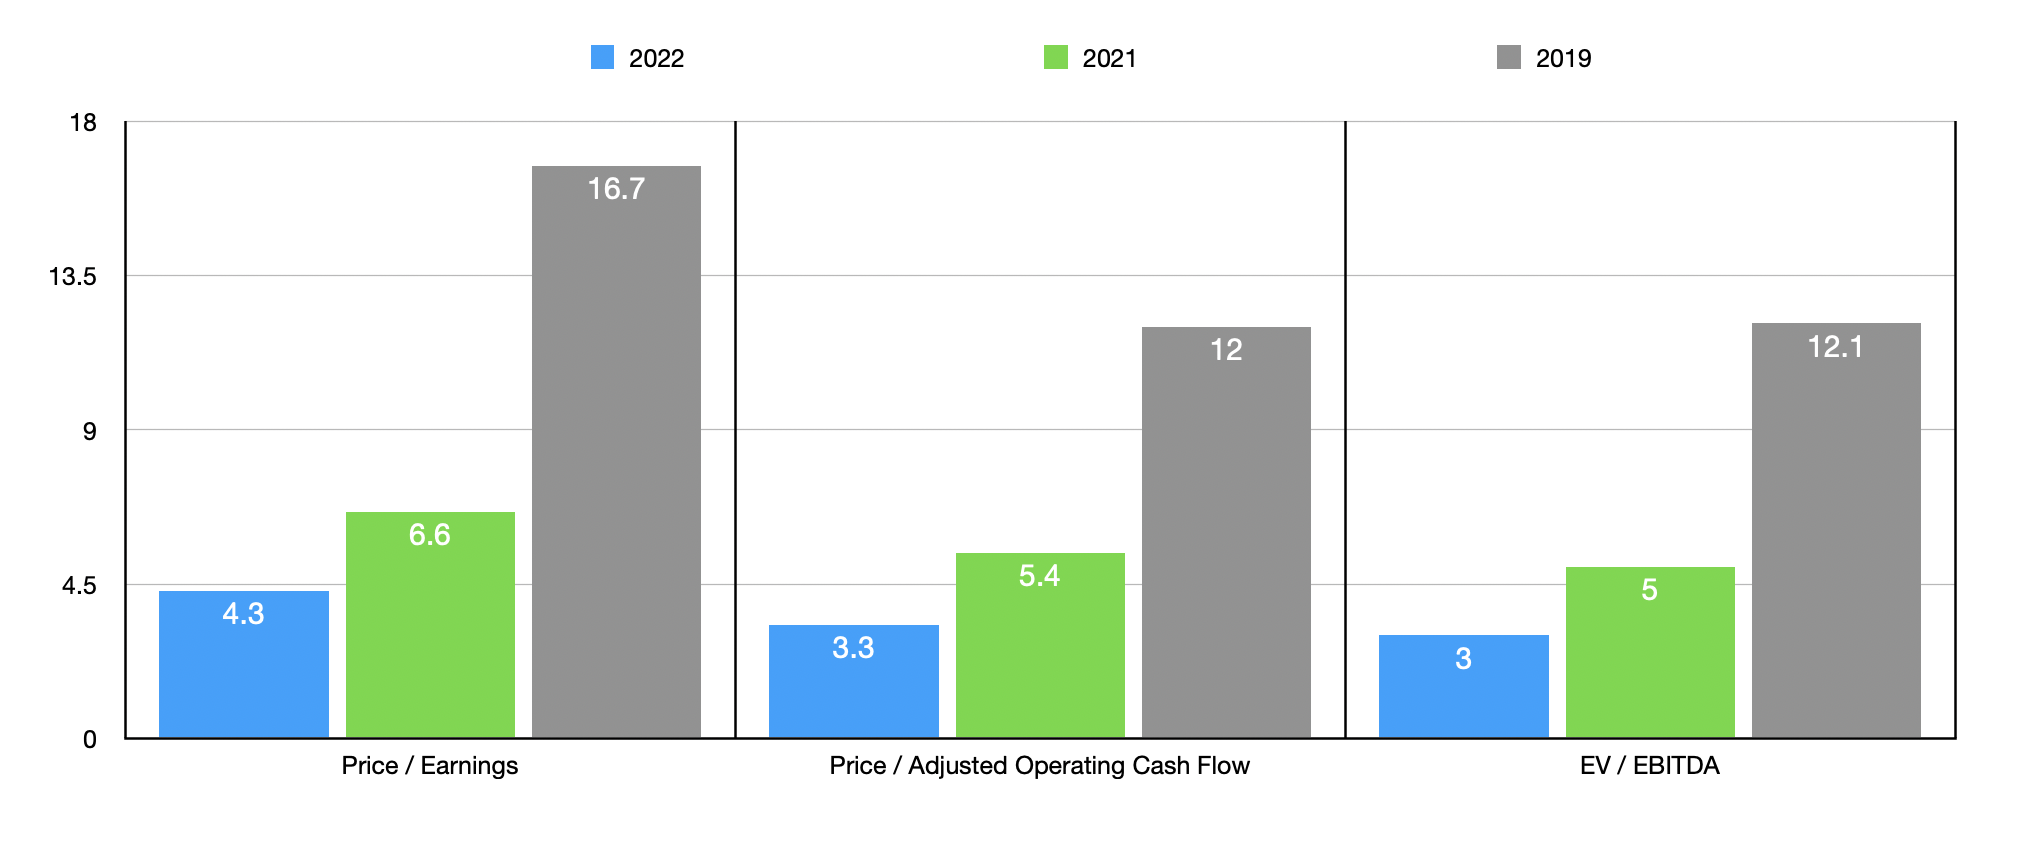
Using these figures, we can see that shares of the business are very cheap. The firm is trading at a forward price to earnings multiple of 4.3. The price to adjusted operating cash flow multiple is 3.3. And the EV to EBITDA multiple should come in at 3. If we use our more conservative results from the 2021 fiscal year, these multiples are 6.6, 5.4, and 5. And even if we assume that financial performance eventually reverts back to what we saw in 2019, shares of the business would still be considered fairly attractive, with multiples of 16.7, 12, and 12.1, respectively. To put this all in perspective, I decided to compare the company to five similar firms. On a price-to-earnings basis, these companies ranged from a low of 4.3 to a high of 37.1. And using the EV to EBITDA approach, the range was from 3.6 to 13.6. In both cases, relative to the results we get using our 2021 figures, only one of the five companies was cheaper than our prospect. Meanwhile, using the price to operating cash flow approach, the range was from 4.7 to 177.2. And in this case, two of the five companies were cheaper than Winnebago Industries.
| Company | Price / Earnings | Price / Operating Cash Flow | EV / EBITDA |
| Winnebago Industries | 6.6 | 5.4 | 5.0 |
| Thor Industries (THO) | 4.3 | 4.7 | 3.6 |
| The Shyft Group (SHYF) | 15.3 | 17.0 | 10.8 |
| Harley-Davidson (HOG) | 8.9 | 5.7 | 10.8 |
| REV Group (REVG) | 37.1 | 4.9 | 13.6 |
| LCI Industries (LCII) | 8.0 | 177.2 | 6.6 |
Takeaway
Based on the data provided, Winnebago Industries seems to me to still be a fascinating prospect with attractive upside potential. The company is trading at remarkably low levels at this point in time. Of course, many investors would rightfully argue that current market conditions are unlikely to represent a new normal. But even if we see financial performance revert back to what it was in 2019, I cannot imagine a scenario where shares of the company would look overpriced. Because of this, I have decided to retain my ‘buy’ rating on the company for now.
Be the first to comment