

Pgiam/iStock via Getty Images
Investment Thesis
Here we tell why Wingstop, Inc. (NASDAQ:WING) investors need have no surprise problems with McDonalds, Inc. (MCD) or other fast foods alternative investments.
Every investment involves a forecast of the future. Those forecasts must encompass the uncertainty of the future. The more future time is involved the larger the risk potential and the reward prospects. Both aspects should be compared to one another over the same time horizon, and that balance accepted/rejected by the investor’s need and purpose.
Sciences of nature in the world around us operate in terms of evidenced, accepted rules of outcomes. Everything else is happenstance, and involves uncertainty. Many natural uncertainties appear to relate to “variables”.
When those variables themselves appear to lack forecast-able outcomes, as in investing, it often is because humans are involved. Humans, as sentient beings, are known to change their minds – and their rules of behavior.
That classifies such behaviors as “games” where “strategy” of behaviors becomes part of the game of “playing the players”. Games like WAR and INVESTING.
The players with the most (and best) resources have the best prospects of winning the game’s events. In the investing war, the advantage usually favors the institutions. They recognize that in the investing game the resources being invested are BOTH capital and time.
Because investing performance is measured over time (which cannot be replaced once spent) it needs respect when committed. Because uncertainty increases with time commitment, the astute investors are quick to adjust their strategies to recognize change.
This is why near-term price expectations need constant attention. Institutions have the resources to demand – and get – attention. They won’t wait for 4 years to find out a mistake was made. A fraction of a year is often enough.
Risk and Reward Balances
MM forecasts are of reasonable-to-expect price limits, both higher and lower. Their range, split by current market price, defines the balance of gain vs. loss prospects. Figure 1 shows those upper and lower limits of price change on the given date for each of the stocks identified by reader traffic on Yahoo and other internet services.
Figure 1
blockdesk.com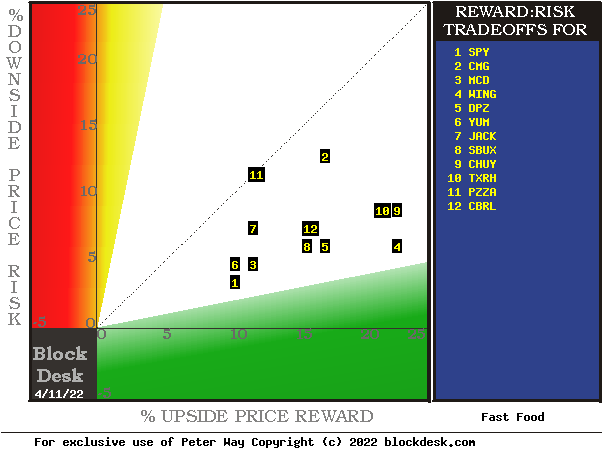
(used with permission)
Upside price rewards are from the behavioral analysis (of what to do right, not of errors) by Market-Makers [MMs] as they protect their at-risk capital from possible damaging future price moves. Their potential reward forecasts are measured by the green horizontal scale.
The risk dimension is of actual price drawdowns at their most extreme point while being held in previous pursuit of upside rewards similar to the ones currently being seen. They are measured on the red vertical scale.
Both scales are of percent change from zero to 25%. Any stock or ETF whose present risk exposure exceeds its reward prospect will be above the dotted diagonal line. Capital-gain attractive to-buy issues are in the directions down and to the right.
Our principal interest is in WING at location [4]. A “market index” norm of reward~risk tradeoffs is offered by SPY at [1]. Most appealing by this Figure 1 view are WING at [4] and DPZ at [5]. But you might prefer CHUY at [9]?
This map provides a good visual comparison of the two most important aspects of every equity investment. There are other aspects of comparison which this map sometimes does not communicate well, particularly when general market perspectives like those of SPY are involved. Where questions of “how likely’ are present other comparative tables, like Figure 2, may be useful.
Figure 2
blockdesk.com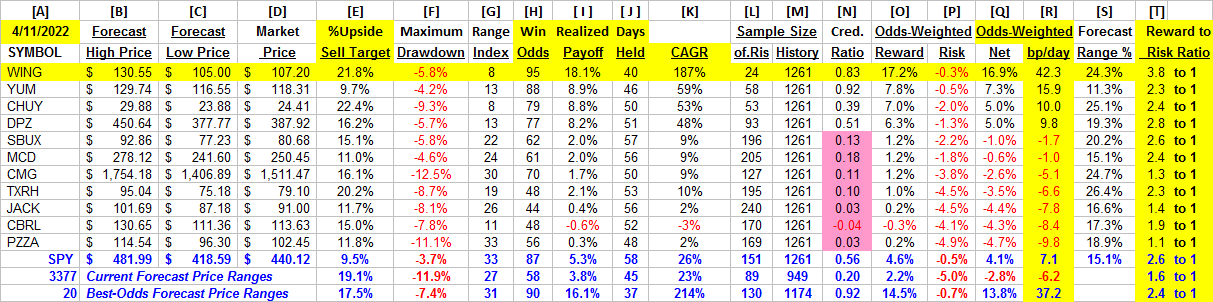
Source: Blockdesk.com (used with permission)
Column headers for Figure 2 define investment-choice preference elements for each row stock whose symbol appears at the left in column [A]. The elements are derived or calculated separately for each stock, based on the specifics of its situation and current-day MM price-range forecasts. Data in red numerals are negative, usually undesirable to “long” holding positions. Table cells with pink background “fills” signify conditions typically unacceptable to “buy” recommendations. Yellow fills are of data for the stock of principal interest and of all issues at the ranking column, [R].
Readers familiar with our analysis methods may wish to skip to the next section viewing price range forecast trends for WING, MCD.
Why do all this math?
Figure 2’s purpose is to attempt universally comparable answers, stock by stock, of a) How BIG the prospective price gain payoff may be, b) how LIKELY the payoff will be a profitable experience, c) how SOON it may happen, and d) what price draw-down RISK may be encountered during its holding period.
The price-range forecast limits of columns [B] and [C] get defined by MM hedging actions to protect firm capital required to be put at risk of price changes from volume trade orders placed by big-$ “institutional” clients.
[E] measures potential upside risks for MM short positions created to fill such orders, and reward potentials for the buy-side positions so created. Prior forecasts like the present provide a history of relevant price draw-down risks for buyers. The most severe ones actually encountered are in [F], during holding periods in effort to reach [E] gains. Those are where buyers are most likely to accept losses.
The Range Index [G] tells where today’s price lies relative to the MM community’s forecast of upper and lower limits of coming prices. Its numeric is the percentage proportion of the full low to high forecast seen below the current market price.
[H] tells what proportion of the [L] sample of prior like-balance forecasts have earned gains by either having price reach its [B] target or be above its [D] entry cost at the end of a 3-month max-patience holding period limit. [ I ] gives the net gains-losses of those [L] experiences.
What makes WING most attractive in the group at this point in time is its ability to produce earnings most consistently at its present operating balance between share price risk and reward. Credibility of the [E] upside prospect as evidenced in the [I] payoff is shown in [N]. Where for these stocks the most fatal (pink-fill) deficiencies lie.
Further Reward~Risk tradeoffs involve using the [H] odds for gains with the 100 – H loss odds as weights for N-conditioned [E] and for [F], for a combined-return score [Q]. The typical position holding period [J] on [Q] provides a figure of merit [fom] ranking measure [R] useful in portfolio position preferencing. Figure 2 is row-ranked on [R] among alternative candidate securities, with WING in top rank.
Along with the candidate-specific stocks these selection considerations are provided for the averages of some 3300 stocks for which MM price-range forecasts are available today, and 20 of the best-ranked (by fom) of those forecasts, as well as the forecast for S&P500 Index ETF (SPY) as an equity-market proxy.
As shown in column [T] of figure 2, those levels vary significantly between stocks. What matters is the net gain between investment gains and losses actually achieved following the forecasts, shown in column [I]. The Win Odds of [H] tells what proportion of the Sample RIs of each stock were profitable; 95% by WING, 88% by YUM, and 79% by CHUY. Also contributing is the size of [I], with WING over 2x the size of YUM and about equal to that of CHUY, yet far more often reached as profitable. .
Description of the competitors
“Wingstop Inc., together with its subsidiaries, franchises and operates restaurants under the Wingstop brand name. Its restaurants offer classic wings, boneless wings, and tenders that are cooked-to-order, and hand-sauced-and-tossed in various flavors. As of December 25, 2021, the company had 1,695 franchised restaurants and 36 company-owned restaurants in 44 states and 7 countries worldwide. Wingstop Inc. was founded in 1994 and is headquartered in Addison, Texas.”
Source: Yahoo Finance
Yahoo Finance
“McDonald’s Corporation operates and franchises McDonald’s restaurants in the United States and internationally. Its restaurants offer hamburgers and cheeseburgers, chicken sandwiches and nuggets, wraps, fries, salads, oatmeal, shakes, desserts, sundaes, soft serve cones, bakery items, soft drinks, coffee, and beverages and other beverages, as well as breakfast menu, including biscuit and bagel sandwiches, breakfast burritos, hotcakes, and other sandwiches. As of December 31, 2021, the company operated 40,031 restaurants. McDonald’s Corporation was founded in 1940 and is headquartered in Chicago, Illinois.”
Source: Yahoo Finance
Recent Trends in MM Price-Range Forecasts for WING Alternatives
Figure 3
blockdesk.com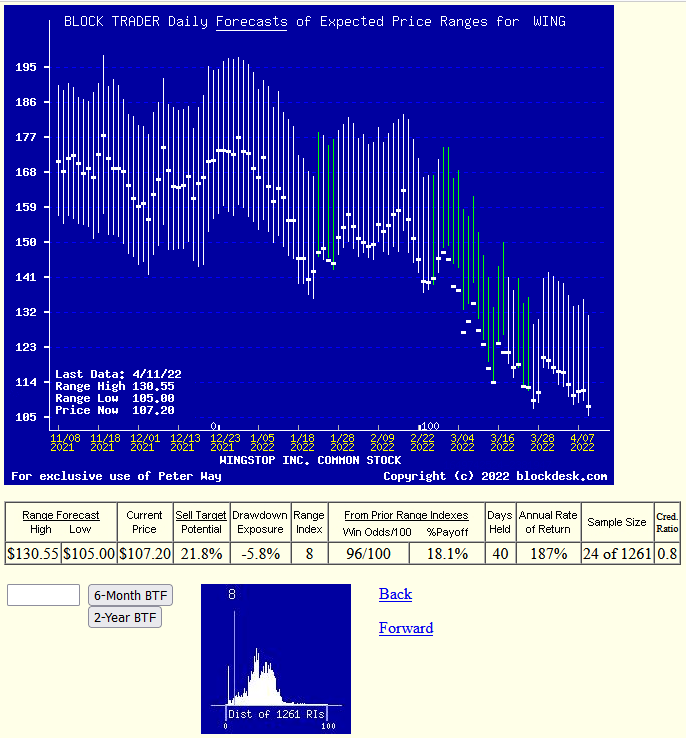
(used with permission)
This is NOT a typical “technical analysis CHART” of PAST stock price history. Instead its vertical lines are a daily-updated visual forecast record of price range limits expected in the coming few weeks and months. The heavy dot in each verticalis the stock’s closing price on the day the forecast was made.
From that point an explicit definition is made of the price reward and risk expectations which were being made at the time, with visual support of the balance between risk and reward. The measure of that balance is the Range Index. Here the RI indicates that only 8% of the full forecast range of from $105 to $130.55 is downside from $107, leaving a much larger 92% of the range to the upside.
Having such precise price expectation measures makes it much easier to make direct comparisons between all securities at each point in time, as was done in Figure 1.
The recorded histories of price range forecasts make it possible to understand how well each security performed in subsequent markets. It also reinforces under what Risk~Reward balance circumstances better forecasts were able to be made in the past and as in Figure 2, may be made at present for the future.
Lets’ look at this dimension of MCD’s Block Trader Forecast picture next.
Figure 4
blockdesk.com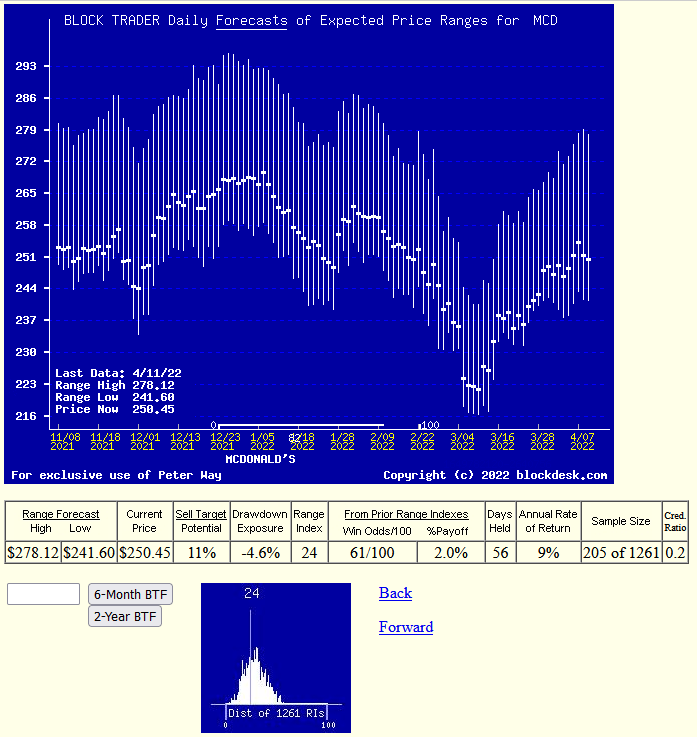
(used with permission)
This picture shows a present Range Index of 24, with 3/4ths of its present range to the upside. That may sound attractive, but the past 5 years’ history shows over 200 market days out of 1261 have been there, during which only 61% of them resulted in profits. The other 40% were losses, big enough to reduce the NET average gains of the 205 to be only +2%, less than 1/5th of the currently foreseen upside. There may be better times to own MCD but today’s appraisal is not encouraging in this company of alternatives.
Better could be a bigger payoff, sooner, producing a larger Compound Annual Growth Rate [CAGR] for the portfolio. WING’s prior +18.1% gain experiences net after only one loss out of every 20 even if only held two 20+ market-day months, is worth a 3-digit CAGR addition.
Conclusion
If the question here to be answered is “Wingstop, Inc. (WING), is it a best fast-food investment today?”, then it looks very much that Institutional Investor circles are saying that for the best capital gain opportunity set, a buy of WING as an alternative investment over MCD, YUM, CHUY or others is the next 3-months better choice at this time.
Additional disclosure: Peter Way and generations of the Way Family are long-term providers of perspective information, earlier helping professional investors and now individual investors, discriminate between wealth-building opportunities in individual stocks and ETFs. We do not manage money for others outside of the family but do provide pro bono consulting for a limited number of not-for-profit organizations.
We firmly believe investors need to maintain skin in their game by actively initiating commitment choices of capital and time investments in their personal portfolios. So our information presents for D-I-Y investor guidance what the arguably best-informed professional investors are thinking. Their insights, revealed through their own self-protective hedging actions, tell what they believe is most likely to happen to the prices of specific issues in coming weeks and months. Evidences of how such prior forecasts have worked out are routinely provided. Our website, blockdesk.com has further information.
Be the first to comment