

Pgiam/iStock via Getty Images
The primary focus of this article is on the stock investment attractiveness of WillScot Mobile Mini Holdings Corp. (NASDAQ:WSC).
Construction technology engineered
Engineering exists in investments, too, in activities like communications, information technology, securities design, and regulatory adaptations.
When the back-office of the mobile construction industry gets computerized, the expensive human-labor component gets minimized, making economic the relocation of productivity geographically.
But when securities worth multi-millions of $ in one lump changes hands, there’s a profit-making event worthy of a substantial fee. So a way gets arranged to get both activities done, legally and under adequate control.
And interestingly, it involves recorded actions which identify the coming price expectations of the big-volume trading parties. Having records which can later be compared with actual market outcomes to reveal how well the then underlying expectations could be believed, and perhaps even similar beliefs useful now for the near-future.
This article will use that approach to tell how much more profit there is likely to be made by and from WillScot Mobile Mini Holdings Corp.
Description of the Subject Company
WillScot Mobile Mini Holdings Corp. provides work space and portable storage solutions in the United States, Canada, Mexico, and the United Kingdom. The company leases modular space and portable storage units to customers in the commercial and industrial, construction, education, energy and natural resources, government, and other end markets. As of December 31, 2021, it had approximately 390,000 total units, which included 162,000 modular space units; 213,000 portable storage units; 13,000 tank and pump units; and other value-added products. The company offers its solutions primarily under the WillScot and Mobile Mini brands. WillScot Mobile Mini Holdings Corp. was incorporated in 2017 and is headquartered in Phoenix, Arizona.” – Source: Yahoo Finance
Yahoo Finance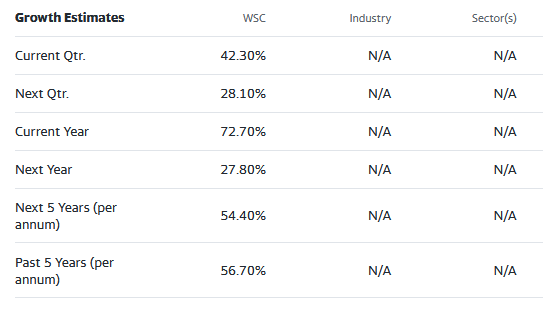
These growth estimates have been made by and are collected from Wall Street analysts to suggest what conventional methodology currently produces. The typical variations across forecast horizons of different time periods illustrate the difficulty of making value comparisons when the forecast horizon is not clearly defined.
Investment Alternatives: Geographic Mobility Industry Competitors
Figure 1
blockdesk.com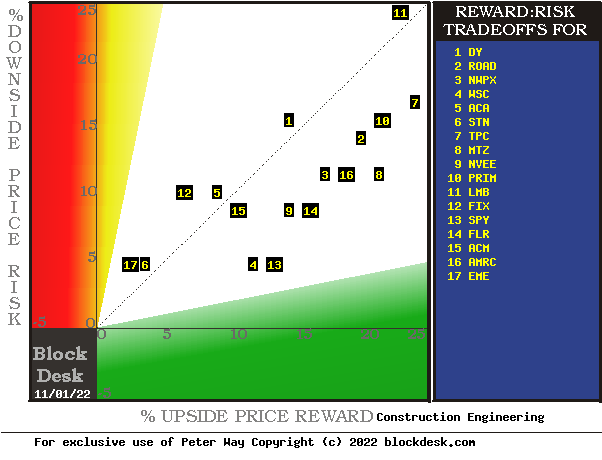
(used with prior permission)
The tradeoffs here are between near-term upside price gains (green horizontal scale) seen worth protecting against by Market-makers with short positions in each of the stocks, and the prior actual price drawdowns experienced during holdings of those stocks (red vertical scale). Both scales are of percent change from zero to 25%.
The intersection of those coordinates by the numbered positions is identified by the stock symbols in the blue field to the right.
The dotted diagonal line marks the points of equal upside price change forecasts derived from Market-Maker [MM] hedging actions and the actual worst-case price drawdowns from positions that could have been taken following prior MM forecasts like today’s.
Our principal interest is in WSC at location [4]. A “market index” norm of reward~risk tradeoffs is offered by SPDR S&P 500 index ETF (SPY) at [13]. Best positions are suggested by the 5 to 1 Risk-to-Reward area in green.
Those forecasts are implied by the self-protective behaviors of MMs who must usually put firm capital at temporary risk to balance buyer and seller interests in helping big-money portfolio managers make volume adjustments to multi-billion-dollar portfolios. The protective hedging actions taken with real-money bets define daily the extent of likely expected specific price changes for thousands of stocks and ETFs.
This map is a good starting point, but it can only cover some of the investment characteristics that often should influence an investor’s choice of where to put his/her capital to work. The table in Figure 2 covers the above considerations and several others.
Comparing Alternative Investments
Figure 2
blockdesk.com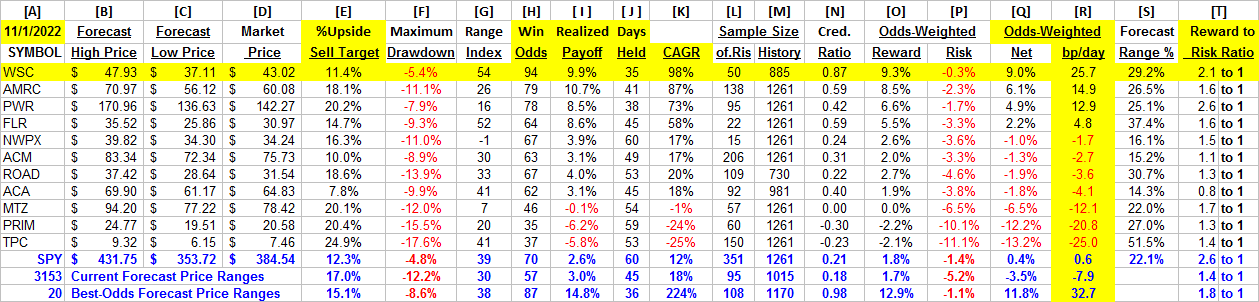
(used with permission)
Column headers for Figure 2 define elements for each row stock whose symbol appears at the left in column [A]. The elements are derived or calculated separately for each stock, based on the specifics of its situation and current-day MM price-range forecasts. Data in red numerals are negative, usually undesirable to “long” holding positions. Table cells with yellow fills are of data for the stock of principal interest and of all issues at the ranking column, [R].
Readers familiar with our analysis methods may wish to skip to the next section viewing price range forecast trends for WSC.
Figure 2’s purpose is to attempt universally comparable measures, stock by stock, of a) How BIG the price gain payoff may be, b) how LIKELY the payoff will be a profitable experience, c) how soon it may happen, and d) what price drawdown RISK may be encountered during its holding period.
The price-range forecast limits of columns [B] and [C] get defined by MM hedging actions to protect firm capital required to be put at risk of price changes from volume trade orders placed by big-$ “institutional” clients.
[E] measures potential upside risks for MM short positions created to fill such orders, and reward potentials for the buy-side positions so created. Prior forecasts like the present provide a history of relevant price draw-down risks for buyers. An average of the most severe ones actually encountered are in [F], during holding periods in effort to reach [E] gains. Those are where buyers are most likely to accept losses.
[H] tells what proportion of the [L] sample of prior like forecasts have earned gains by either having price reach its [B] target or be above its [D] entry cost at the end of a 3-month max-patience holding period limit. [ I ] gives the net gains-losses of those [L] experiences and [N] suggests how credible [E] may be compared to [ I ].
Further Reward~Risk tradeoffs involve using the [H] odds for gains and the 100 – H loss odds as weights for N-conditioned [E] and for [F], for a combined-return score [Q]. The typical position holding period [J] on [Q] provides a figure of merit [fom] ranking measure [R] useful in portfolio position preferences. Figure 2 is row-ranked on [R] among candidate securities, with TGH yellow-row identified.
Along with the candidate-specific stocks these selection considerations are provided for the averages of over 3,000 stocks for which MM price-range forecasts are available today, and 20 of the best-ranked (by fom) of those forecasts, as well as the forecast for S&P 500 Index ETF as an equity market proxy.
Recent Trends in WSC MM Price-Range Forecasts
Figure 3
blockdesk.com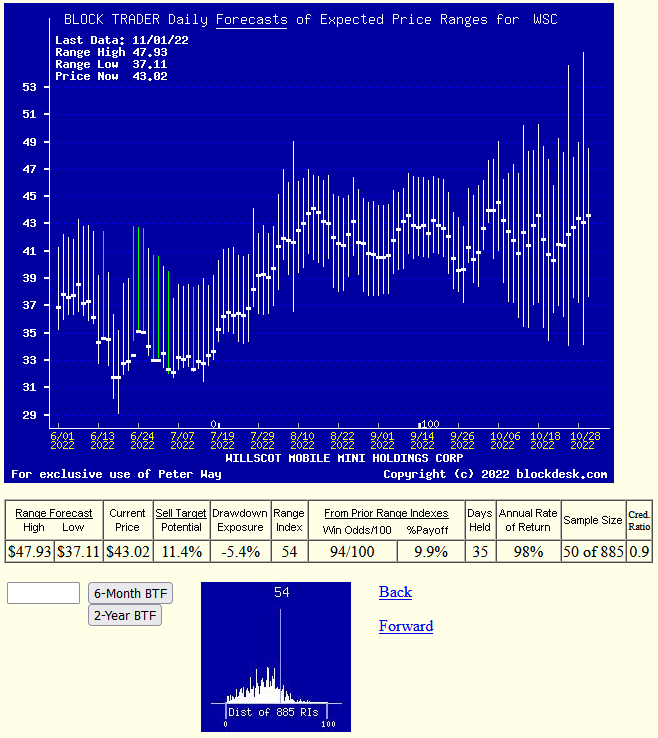
used with prior permission
This picture is not a “technical chart” of past prices for WSC. Instead, its vertical lines show the past 6 months of daily price range forecasts of market actions yet to come in the next few months. The only past information there is the heavy dot of the closing stock price on the day of each forecast.
That data splits the price range’s opposite forecasts into upside and downside prospects. Their trends over time provide additional insights into coming potentials, and helps keep perspective on what may be coming.
The small picture at the bottom of Figure 3 is a frequency distribution of the Range Index’s appearance daily during the past 5 years of daily forecasts. The Range Index [RI] tells how much the downside of the forecast range occupies of that percentage of the entire range each day, and its frequency suggests what may seem “normal” for that stock, in the expectations of its evaluators’ eyes. A RI of 54 (out of 100) leaves the other 46% of the price change potential to the upside.
With the dominant proportion of past RIs as lesser amounts, the “Win” odds of Figure 2 and Figure 3 above as profits having been achieved 15 out of every 16 reached, WSC takes on at this point the appearance of a “momentum” stock. One likely to reach prices at the upper end of those present and recent earlier forecast vertical lines in Figure 3 as it has typically in 35 market days, only 7 weeks. Repetition of WCS’ 9.9% payoff where possible at such frequency is a potential CAGR annual rate of 98%.
Here the present level is near its least frequent, least-cost presence, encouraging the acceptance that we are looking at an attractive evaluation for WCS.
Conclusion
Among these alternative investments explicitly compared WillScot Mobile Mini Holdings Corp. appears to be a logical buy preference now for investors seeking near-term capital gain.
Be the first to comment