

monsitj
2022 has very challenging for those that do my type of analysis. The reason for this is because of how messy and overlapping this bear market has been, as well as each bounce. Because the structure of each move overlaps, it means a multitude of scenarios can play out, which is exactly where we are now.
What we can do is use the current price information to provide the most probable scenarios as well as price levels that will either confirm or negate what is playing out. This can help you get context as well risk manage such a choppy market.
If we step back and look at the larger picture, there are three general paths I believe we are tracing.
I/O Fund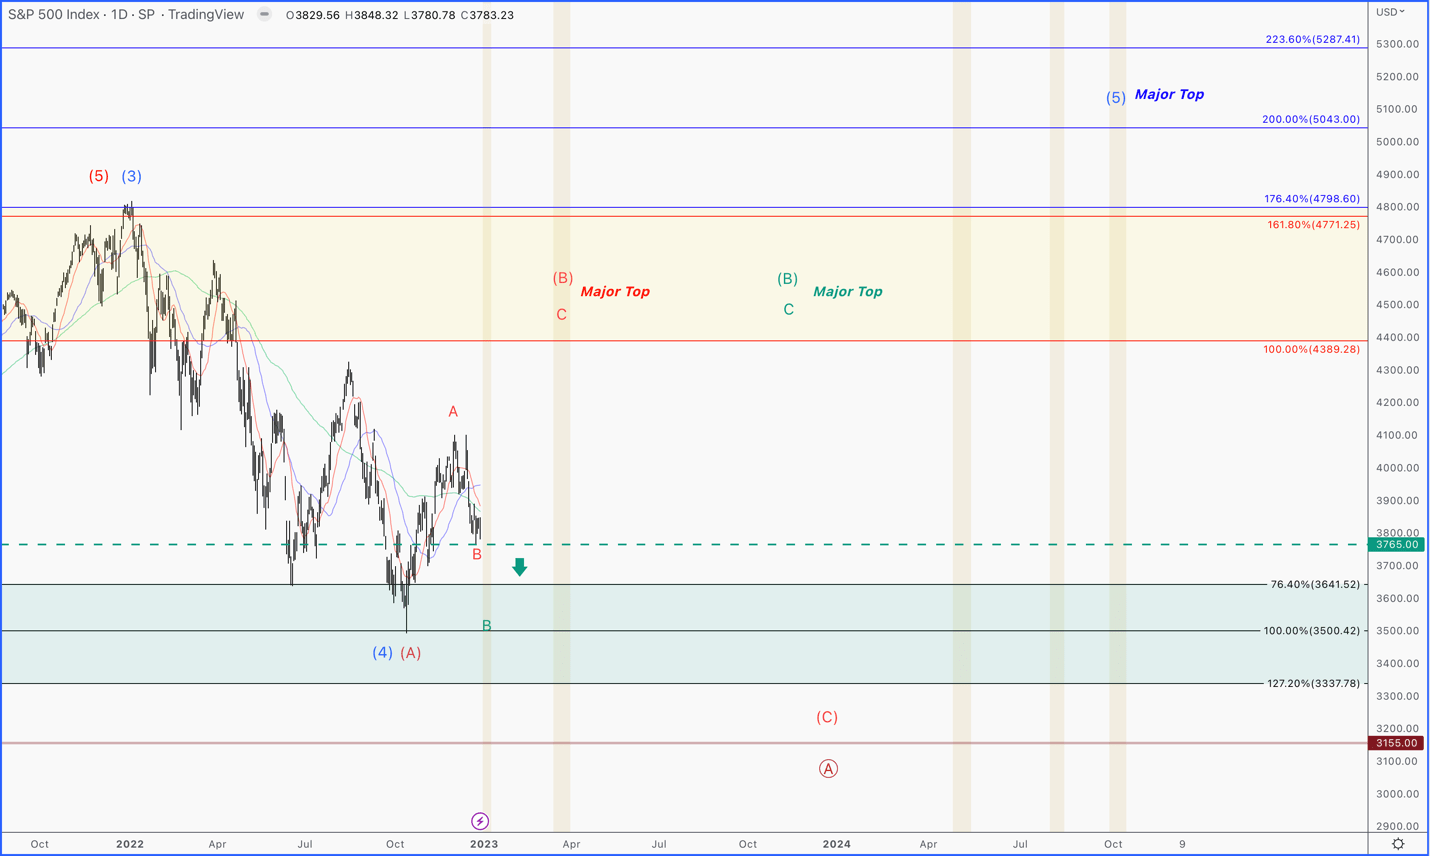
Blue – this is the contrarian perspective – we bottomed in a large degree 4th wave, and are setting up for the 5th wave push towards SPX 5200 into 2023/2024. This is supported by The Dow Jones Industrial Average, many value names, and various global markets that appear to be setting up for a push to new highs. This would require a fundamental macro turn around, especially regarding the state of the US consumer. For this reason, this scenario is not my primary perspective for 2023.
Red – This has us halfway through a large degree bear market rally, which needs to bottom soon (above 3765 SPX) and break through 3810 for confirmation. This would have us rally towards 4300 SPX early in 2023, followed by a major top as we proceed with the last leg of the current bear market.
Green – This is a variation of the above Red count. Instead of bottoming soon, we push lower into the green target zone below. This scenario could even have us go as low as SPX 3350 before finding a bottom, and beginning the push towards 4300 SPX.
Some have argued for a 2008 crash scenario about to unfold. The reason I am not in this camp where we see a direct breakdown to the sub 3155 level is because we are not seeing all markets setting up for such a drop. In order to get the type of protracted downward trend this scenario would be suggesting, we tend to see all markets and most stocks setting up for this type of move. We are just not seeing that, yet.
There are many markets globally and within the US that are not suggesting this. I’ll name the two most convincing, as well as the two that I plan to use as a barometer.
The Dow Jones Industrial Complex (DJI)
When you step back from the DJI, it’s pattern looks incomplete off the COVID low. The Dow looks like it needs one more push to new highs in order to complete this pattern. This would suggest that the 2022 bear market was a large degree correction in an even larger uptrend.
I/O Fund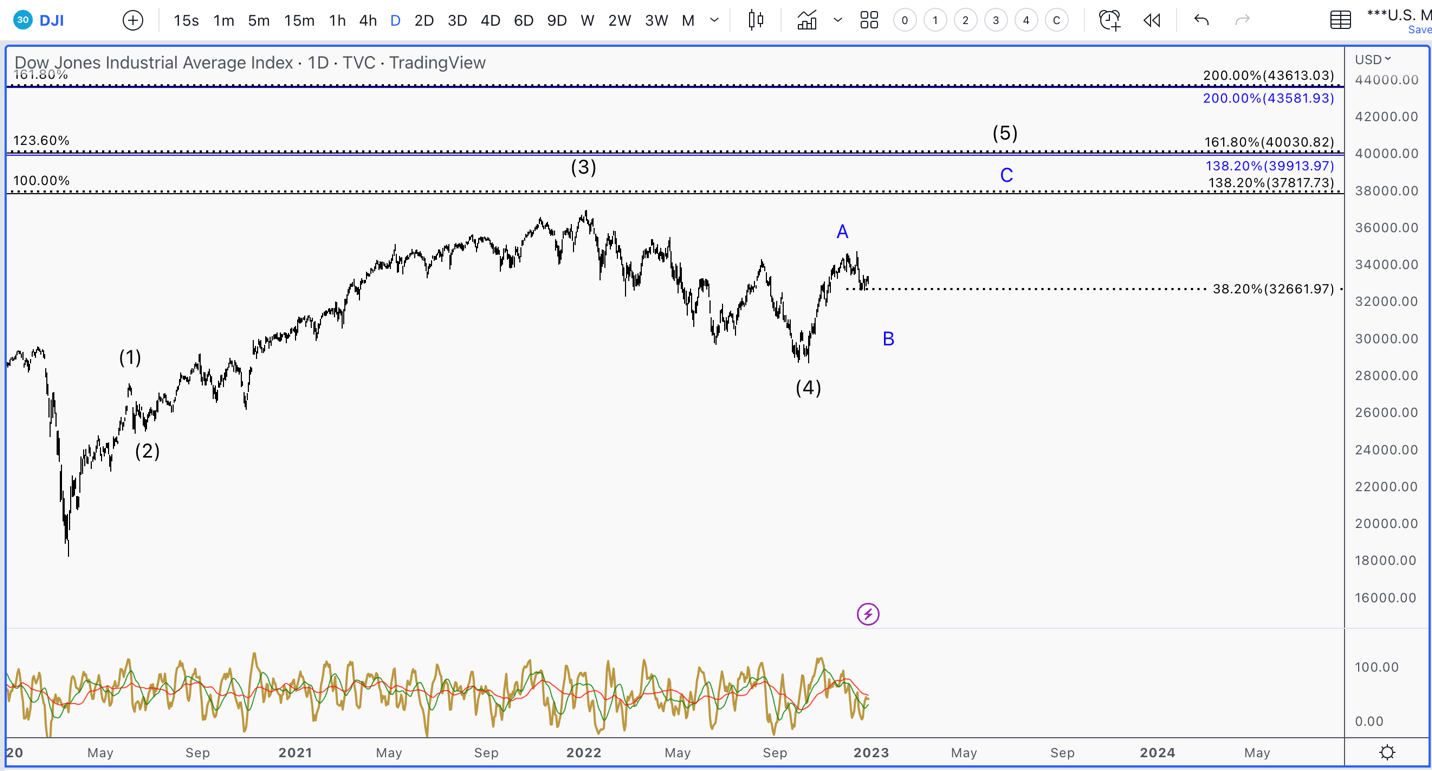
Another point to note is that the Dow has only retraced about 1/3 of its push off the October low, while the S&P 500 more than 50%. It is currently about 15% off its lows, while the S&P 500 is 7%, and the NASDAQ-100 is 2% off its lows.
You can see a scenario where the NASDAQ-100 makes a new low, the S&P 500 retests its low and the Dow makes a higher low. As long as the Dow holds its October 13th low, I expect a bigger rally to 4300 SPX to commence once this volatility ends in the coming weeks.
The Canadian TSX
The TSX is a key market to track for US stocks. There is always a market leading the one you are in, and the Canadian TSX tends to lead the US markets (while the German DAX tends to lead the Canadian TSX). Much like the DJI, this market appears to be setting up for a push to new highs in 2023.
I/O Fund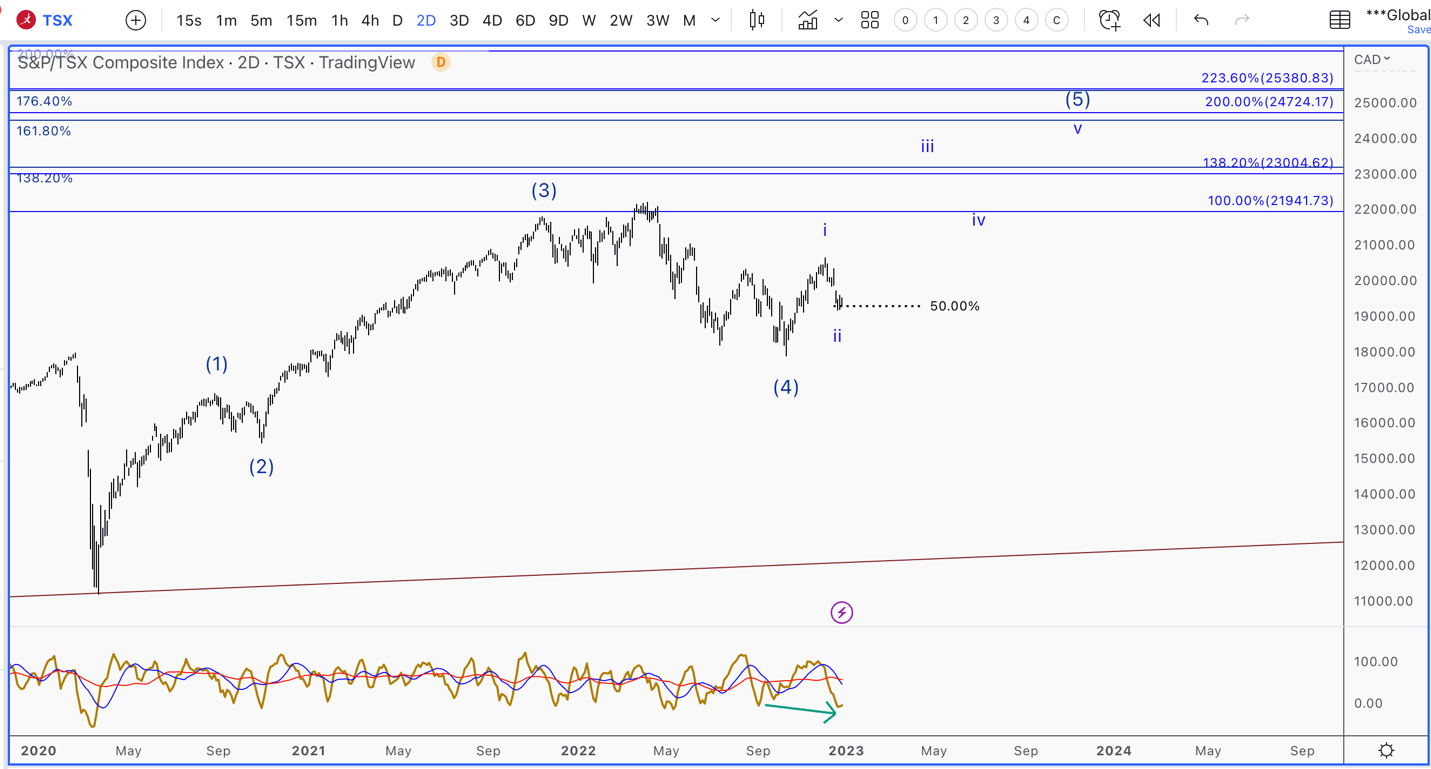
We only have 4 waves off the COVID low, suggesting another bigger push higher is on the horizon. Much like the Dow, the TSX has only retraced a reasonable portion of its initial bounce off the October low. As long as the TSX holds its October lows, I expect the above scenario to play out.
In conclusion, the macro environment is shaping up to be challenging in 2023. We are seeing the yield curve more inverted than any time going back decades, while the US consumer is only getting worse. However, markets do not always behave as they should.
For example, we’ve seen scenarios like 2019 where the macro environment deteriorated at an alarming pace and the market went on a year-long bull run, ignoring the slowdown under the hood. For this reason, we want to have clear risk parameters on how much we are willing to give a similar scenario playing out. Below 3765 and we get defensive. While I don’t see a direct drop to the low 3000 SPX level, as long as the Dow and the TSX hold their lows, we should see a bigger push to 4300 SPX in the coming months. If these indexes do break their lows, then we will see a direct drop to new lows and beyond.
Conclusion
On October 13th, we went on a buying spree within Tech Insider Network, while at the same time cutting our hedge in half. In late November, we began layering back into our hedge while raising large amounts of cash again in preparation for a difficult December. This kept our portfolio neutral to green while the market dropped this month. We’ve recently begun adding some of this cash back into the key positions that we want to hold into the 2023 macro environment. We maintain the belief that we are setting up for a push towards 4300 in the S&P 500 (SPX) into early 2023. However, with the level of volatility we have seen, we now have to consider what it might look like if we are not heading towards 4300 SPX directly.
For our portfolio, the 3765 SPX region is where we will move our hedge back to 100% and raise more cash. The reason for this is that below this level, it opens the door for a push to a double bottom in SPX, or slightly to new lows in the coming weeks.
If we instead break below 3765, then we are not done with the correction that started in early December. Based on the nature of this pullback, we can see a deep pullback that can exceed the October 13th low before turning back up towards the 4300 SPX region.
Be the first to comment