

Scott Olson
Investor sentiment turned slightly more bullish in the middle of August as prices recovered about half of their 2022 losses through June. However, after retesting 200-day moving averages as resistance a few weeks ago, stocks have plummeted again, with the small-cap Russell 2000 stocks leading the way with a -11% slide. (I explained this possibility in an August article here.)
The SPDR S&P 500 Trust ETF (NYSEARCA:SPY) has not fared much better, with a -9% tank over several weeks. At this stage in the chart pattern, it looks like a successful retest of the summer lows is taking shape. However, I would caution seasonal risk in the autumn months for stocks, the possibility of another spike higher in oil/gas inflation soon, and a Federal Reserve confused on whether to fight inflation or support the economy makes further equity downside something to worry about. On the bullish side of the ledger, modern record cash levels at actively-managed institutions (the early July Bank of America fund manager survey relayed the highest cash positioning since October 2001, even greater than the 2008-09 banking crisis and 50% bear market in equity prices), and bearish sentiment indicators creeping closer to major buy territory could mean the end of intense selling is close at hand.
Bank of America, Global Fund Manager August Survey via Bloomberg Article American Association of Individual Investors, August 31st, 2022 Survey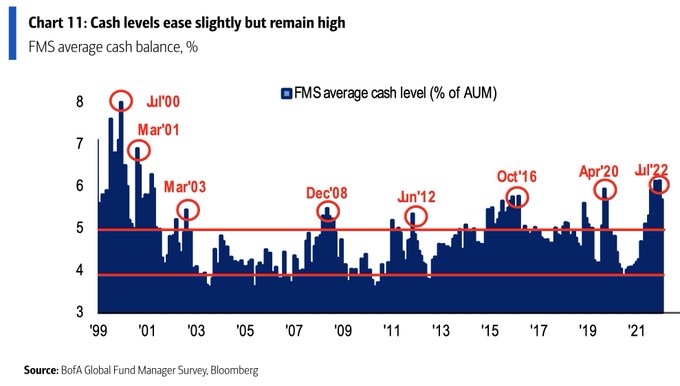
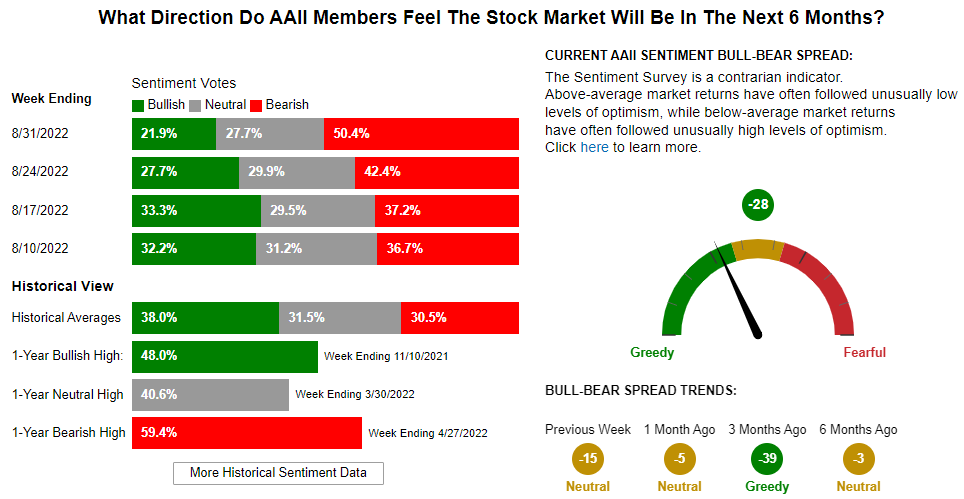
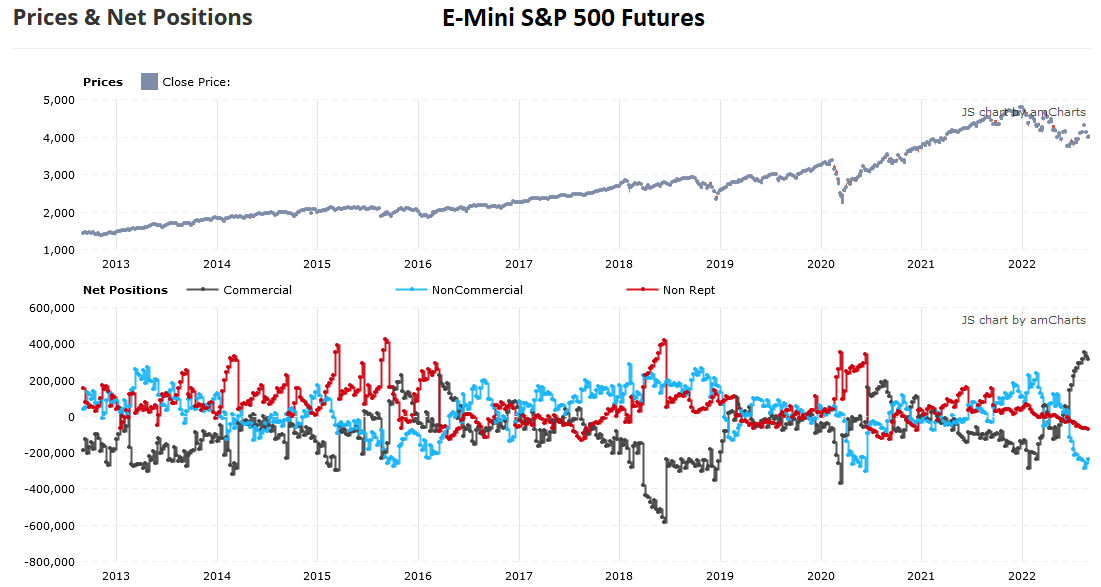
Not only are current readings of pessimism usually a bullish indicator of future price changes (because cash on the sidelines will eventually repurchase stocks), but futures trader positioning in the Commitments of Traders (COT) report may be the single best data point to land your bullish hat. In terms of sentiment, we now stand at 10-year highs for commercial longs (banks & financial institutions) vs. decade record net shorts by speculators and small investors. You can review this idea below for both regular S&P 500 and E-Mini futures contracts. If this was the only information available for me to make a decision, I would likely be quite bullish currently, as similar setups in the recent past have almost immediately pinpointed a major market bottom in price.
Tradingster Website, COT Report – S&P 500, August 30th, 2022 Tradingster Website, COT Report – E-Mini S&P 500, August 30th, 2022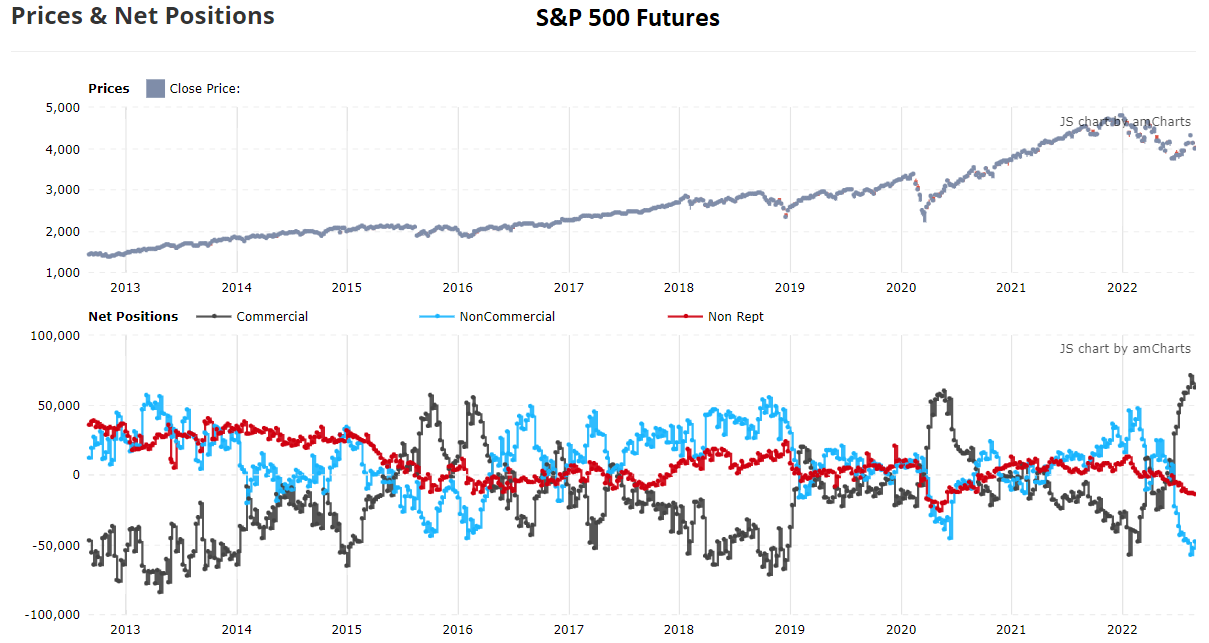
Crude Oil Wildcard
The most important economic variable that could really trip up U.S. stocks is crude oil pricing. I have been correctly bearish on the 25% drop in crude oil since the spring spike on Russia’s military invasion of Ukraine. A slowing global economy with flattening demand for oil have been one reason for oil weakness. A small rise in production worldwide is another reason for the rebalance in supply/demand.
Yet, of late I am getting worried winter shortages of oil/gas for western Europe could endanger financial market stability. In addition, it is clear OPEC+ would prefer prices stick around US$100 a barrel. Just this weekend, OPEC+ made obvious its wishes for high crude oil prices to be the new reality as a 100,000 barrel per day cut in production was announced without warning. I have been analyzing if a another upmove in this key ingredient for inflation and GDP output could push net energy costs and Fed tightening policy into the recession zone. Basically, crude oil back above $100 makes a “soft landing” scenario for the economy all but impossible.
Other U.S. supply shocks for oil could occur, like a major hurricane in the Gulf of Mexico hitting during September or October that slashes oil/gas production and refining for weeks or months. The U.S. government may be forced to cut back on Strategic Petroleum Reserve sales at the end of October, to keep inventory in place for future black swan events. And, I was thinking a nuclear-monitoring deal with Iran would be finished by late summer to open new supplies to Europe, reducing the potential for serious shortages this winter. Such has not been accomplished, despite hopes worldwide.
One final piece of the crude oil puzzle is futures trading does not show an oversized speculative bubble today, as one would expect following a rise from $20 to $120 per barrel over 24 months. In fact, commercial hedgers like oil companies and refiners are actually covering net short crude oil futures positions (in search of supply during the summer), now short the lowest number of contracts since 2016. On the flip side, small speculators are holding an almost 10-year low, net long position. This COT sentiment setup argues for higher quotes for crude oil, not lower, in the months to come.
Tradingster Website, COT Report – Light Sweet Crude Oil, August 30th, 2022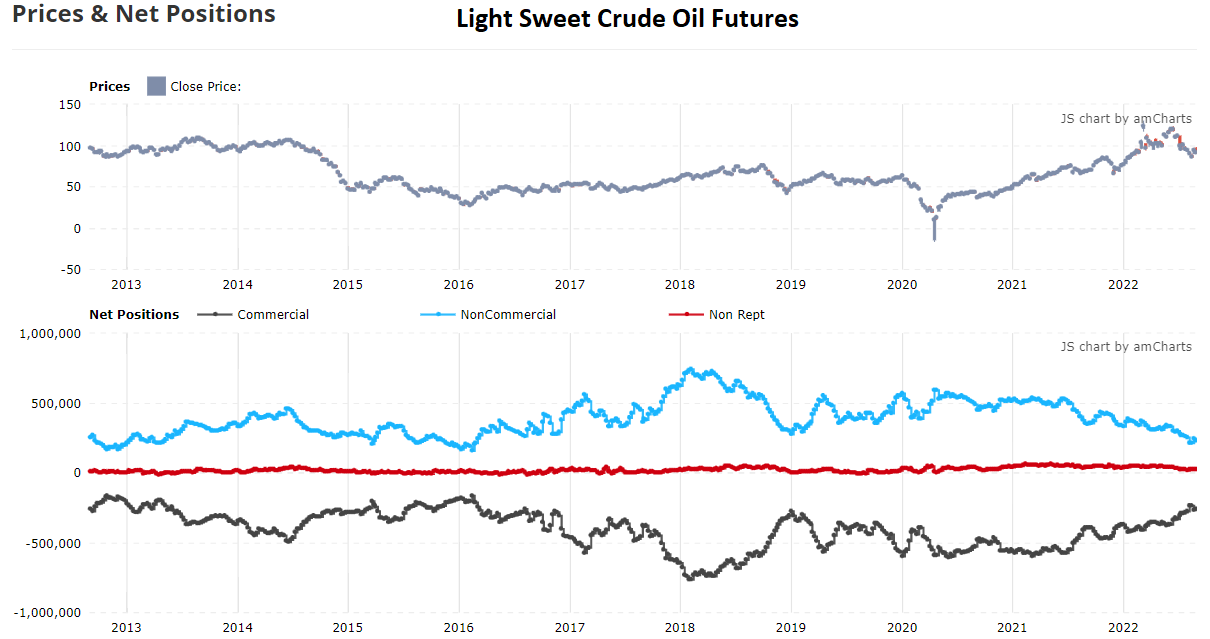
Predictions or Lack Thereof
Without doubt, late 2022 trading in U.S. equities/bonds could prove epic for volatility. If you do not have the heart for wild swings, retreating to cash and gold/silver is an acceptable course of action. I would note I do not recommend a large net-short position for a variety of reasons from rising brokerage borrowing costs and truly expensive put option premiums historically (working against gains, absent a massive selloff), to the difficulty of covering bearish positions in a whipsawing marketplace. A meandering decline over the next 12-18 months is one possibility that should also discourage aggressive shorting.
I am personally modeling the timing of a tradable bottom in U.S. stocks is getting close. Yet, outlier risks from the November election cycle, ongoing investigations into former President Trump’s shenanigans, Fed tightening pushing the economy into recession, China invading Taiwan, and/or a final jump in energy prices crushing consumer spending and bond market prices, could mean a wicked Wall Street price drop is coming in the weeks ahead. For market timers and risk weighting investors, holding cash in the coming days makes complete sense to me. Nevertheless, an equity market bottom in the next few weeks, with an “unexpected” price rise during late September and October would catch many analysts and investors off balance.
Could stocks fall off a cliff into the end of September? Absolutely, I can envision a number of scenarios shaving 5%, 10%, even 20% off the SPY $392 quote from Friday. However, I suggest smart and nimble investors be ready to buy such a waterfall (close to a crash) decline. I talked about evidence of a developing liquidity crisis weeks ago here, and the odds of one playing out in September (perhaps into early October) remain much higher than usual. I am not a fan of bonds – with CPI inflation rates around 8%, the Fed has to keep raising bank lending rates and selling part of its $9 trillion stash of U.S. bond interference since 2008 to have any credibility it is serious about fighting inflation.
I moved my 401k to all cash weeks ago, with an eye toward reentering stocks with a 20%-50% weighting in September-October. My plan is to cost-average down on any big drop in Wall Street quotes. If a bear slump does not materialize, I am OK holding abnormal levels of cash earning higher and rising interest rates, without limited downside risk.
Given today’s total market capitalization to GDP remains in nosebleed territory around 150%, considerable long-term downside in stocks could materialization the rest of 2022 and all of 2023 (with a 75% average ratio vs. GDP over 50 years). If we’re headed to the 60% ratio of 1990 or early 2009, sizable downside may be coming to Wall Street beyond the -20% drawdown this year. (The Fed’s goal is to inflate GDP higher with money printing over time, as I have discussed many times this summer. So, stocks may hold up in price, but markedly underperform inflation like 2022 or the 1970s decade.)
YCharts – US Stock Market Value vs. GDP, 1971-Present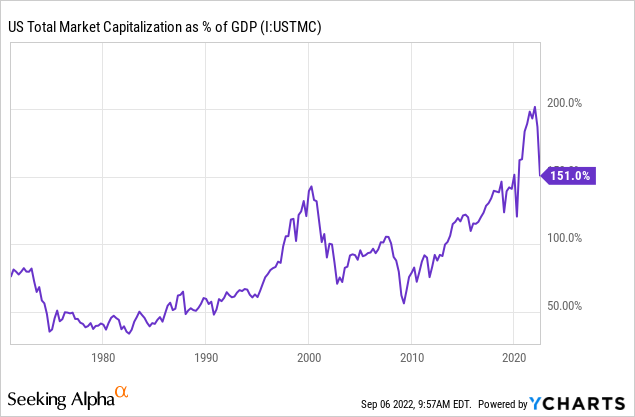
I have been buying precious metals, especially gold and silver bullion through a number of related ETFs in my regular long/short brokerage account in August and early September. Silver is getting close to a record-low valuation vs. gold and in relation to financial paper money aggregates like M2 money stock or total Treasury debt. I have explained the developing bullish story for gold/silver in numerous articles since the middle of August, as a function of overly bearish sentiment and rising lease rates. I fully expect gold in particular will “lead” the stock market higher at some point, like it has at nearly every major bottom since the 1987 stock market crash (as a signal of improving financial system liquidity). Further declines in the S&P 500 matched against flat to higher gold pricing could be one divergence to convince me turn more bullish about Wall Street’s intermediate-term prospects.
For the SPDR S&P 500 ETF specifically, my momentum indicators are in a neutral to bearish position today. On Balance Volume continues to lead the market lower. In terms of oversold/overbought indicators, the Average Directional Index and Money Flow Index have yet to scream panic selling has arrived. However, if the S&P 500 dives 5% over the course of a week, or 10% to 15% over several weeks, coinciding with a turn higher in gold, I could get quite bullish that another strong rebound in prices will take place. Until a bigger selloff plays out, I am more neutral with a Hold rating on SPY. We could see a minor upmove back to the 200-day moving average or backslide in price closer to the summer lows as a protracted, disappointing zigzag leaving traders/investors glum and unhappy into early 2023.
StockCharts.com – SPY, 12 Months of Daily Values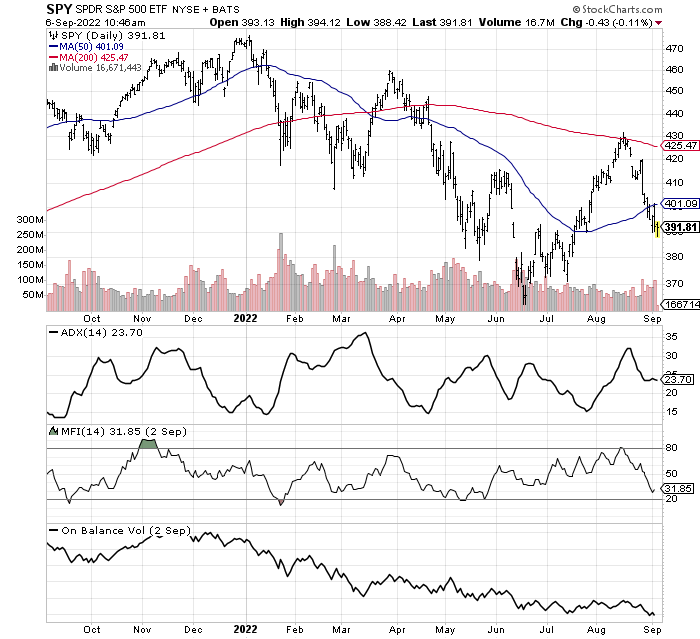
In conclusion, there are a variety of directions the overall U.S. equity market could head into early 2023. My goal is to buy material weakness and sell into any rally beyond 5%, until the Fed is finished tightening. Ironically, the bigger the drop in September-October, the better 2023 may turn out for U.S. equity investor gains. We may need a rapid panic event to reset inflation rates at a lower tier and halt Fed tightening policy, while upgrading business income and valuation numbers into 2024.
Thanks for reading. Please consider this article a first step in your due diligence process. Consulting with a registered and experienced investment advisor is recommended before making any trade.
Be the first to comment