

GOLD PRICE OUTLOOK:
- Gold prices extended lower despite a weakening US Dollar, reflecting weak investor appetite
- The FOMC meeting will be eyed by traders for clues about a possible twist in monetary policy
- WTI prices are underpinned by a larger-than-expected draw in crude inventory, weaker US Dollar

Recommended by Margaret Yang, CFA
Get Your Free Gold Forecast
Today’s FOMC meeting is probably the most important macro event for traders around the world. Market participants are eyeing an update from Jerome Powell about the central bank’s view of the economic outlook, fiscal stimulus as well as clues about future tapering. In view of deteriorating labor market conditions and viral waves in winter, the Fed’s monetary policy is likely to remain accommodative, which could help to cushion the downside for gold prices.
The Fed has made it clear in the December FOMC press release that the Committee expects to maintain an accommodative stance of monetary policy until maximum employment and long-term inflation of 2 percent are achieved. That said, the central bank is likely to hold its policy rate unchanged until 2023, as well as continue to increase its holdings of Treasury securities by at least $80 billion per month and of mortgage-backed securities by at least $40 billion per month for the foreseeable future.
The US unemployment rate stood at 6.77% in December, which marks a long way to return to the pre-Covid level of 3.8%. The latest core PCE inflation reading was at 1.4%, showing little sign of inflation overheating. The relationship of the Fed target rate, US unemployment and core PCE inflation are displayed in the graph below. It suggests that conditions for the Fed to consider tapering are far from met.

Source: Bloomberg, DailyFX
Gold prices have been weighed by rising US Treasury yields and a potential delay of Biden’s US$ 1.9 trillion fiscal stimulus plan recently. Senate Majority Leader Chuck Schumer said earlier this week thathe is aiming to pass the new fiscal stimulus plan by mid-March, which disappointed investors who had anticipated a shorter timeline. Uncertainties surrounding the timing and size of the new Covid relief plan have led investors to unwind reflation trades and precious metal holdings.
A packed economic calendar towards the latter part of this week may hint at heightened volatility in currency and commodity trading: the FOMC meeting on January 27th, US Q4 GDP on 28th and Core PCE inflation data on 29th. Read more about my report about their potential market impacts.
CRUDE OIL PRICE OUTLOOK
Crude oil prices are underpinned by an unexpected fall in US crude inventories as well as a softening US Dollar. The American Petroleum Institute (API) reported a substantial 5.27-million-barrel draw in crude inventories for the week ending January 22nd, far larger than the baseline forecast of a 0.43-million-barrel rise.
Besides, a continuous drop in US daily Covid-19 counts has brightened the energy demand outlook as the likelihood of easing some of the lockdown measures is rising with the rollout of vaccines. US daily Covid-19 new cases have fallen to 133,913 on January 25th, marking the lowest reading since November 15th, according to the CDC.

Source: Bloomberg, DailyFX
Technically, gold prices hit an immediate resistance level at US$ 1,870 and have since entered consolidation. Prices broke below the “Ascending Channel” in early January, indicating strong near-term selling pressure (chart below). The overall trend remains bearish-biased as suggested by the downward-sloped moving average lines. Immediate support and resistance levels can be found at US$ 1,807 (previous low) and US$ 1,870 (76.4% Fibonacci retracement) respectively.
Gold Price – Daily Chart

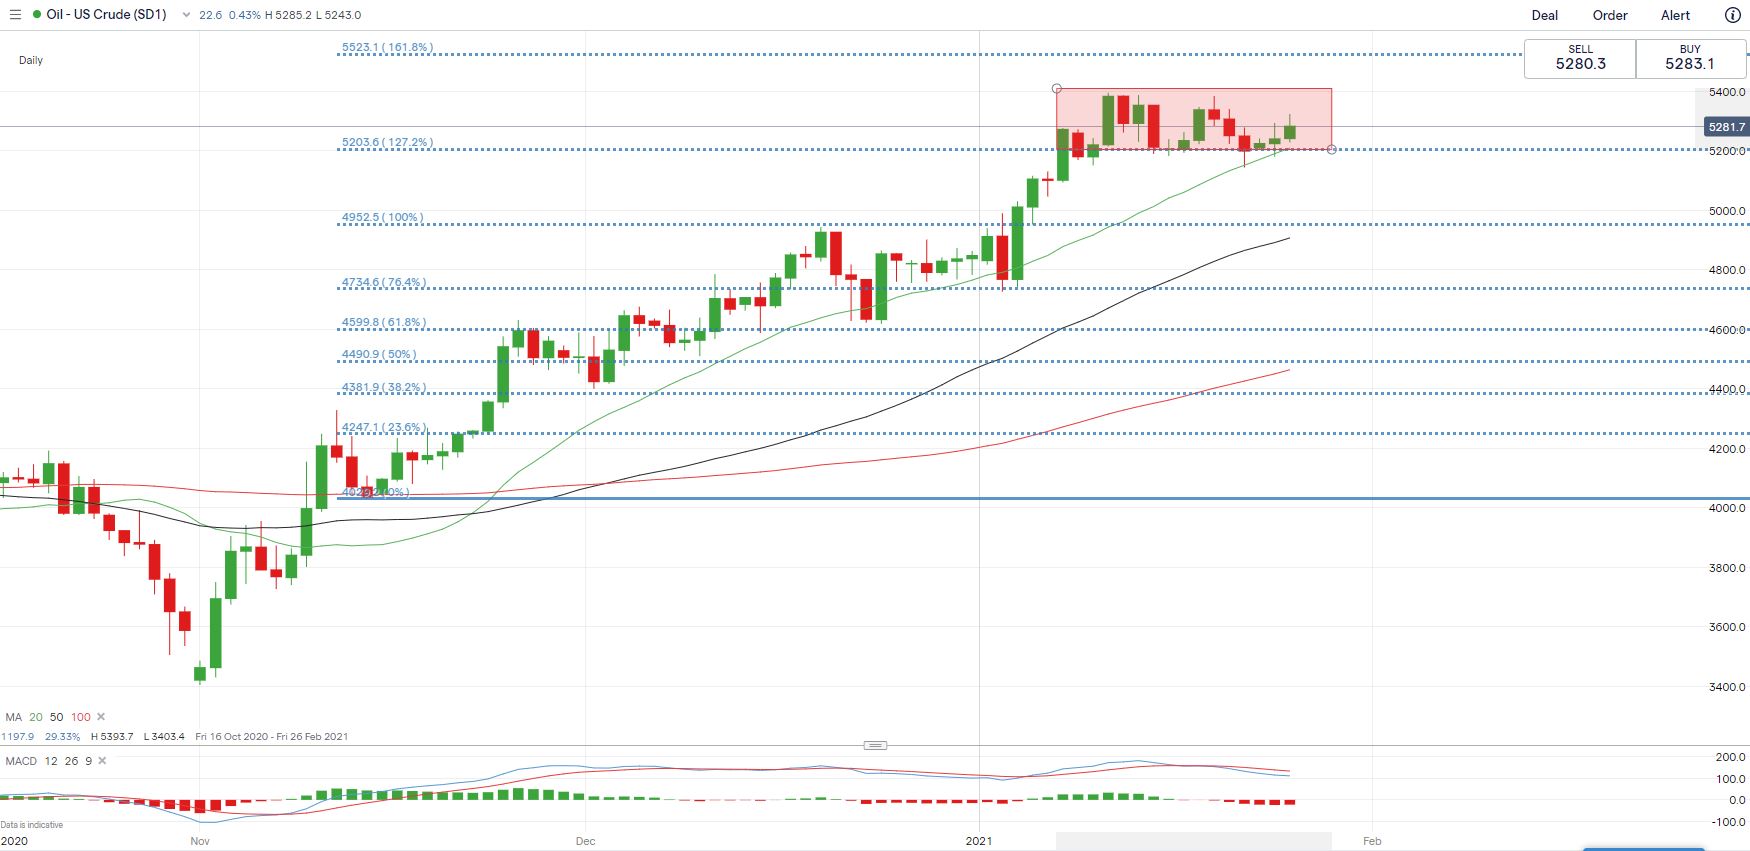
As for WTI, it appears to have entered “range-bound” trade since early January as highlighted in the chart below. Immediate support and resistance levels can be found at US$ 52.00 (127.2% Fibonacci Extension) and US$ 53.90 (range ceiling) respectively. The overall trend remains bullish as suggested by the upward-sloped moving average lines. A bearish MACD crossover flags risk of a near-term pullback however.
WTI Crude Oil – Daily Chart
 {{GUIDE|BUILDING_CONFIDENCE_IN_TRADING }}
— Written by Margaret Yang, Strategist for DailyFX.com
To contact Margaret, use the Comments section below or @margaretyjy on Twitter
Be the first to comment