

Altayb
Introduction
I am not a fan of market timing and in most cases do not believe in it. As a buy-and-hold investor, I regularly add to my positions and only consider selling when a stock is either grossly overvalued or my original investment thesis is broken.
However, monitoring certain macroeconomic indicators helps to identify the current phase of the business cycle, which in turn allows an investor who is in a constant accumulation phase to assess which sectors are currently expensive and which are cheap. This gentle form of market timing has helped me in the past, and so for most of 2021, when the economy was still in recovery mode from the brief 2020 recession, I put a strong emphasis on the stocks of major pharmaceutical and biotechnology companies. In this way, I figured, I could at least partially insulate myself from the recession that would eventually occur, since the earnings of the pharmaceutical companies and, accordingly, their stock prices should not be greatly affected.
Since the beginning of 2022, interest rates have been rising, mainly to counter inflation, which has run rampant due to the pandemic measures and their consequences for the economy and consumer behavior, but also due to the current energy crisis. While employment numbers are still positive, the yield curve inverted some time ago, and currently the yield spread between 10-year and 3-month treasuries is -0.8%. There is no question that we are in a very late stage of the cycle, and a recession seems almost certain. As a forward-looking contrarian, it, therefore, seems reasonable to ask whether the substantial paper gains that the stocks of most major pharmaceutical companies have made should be locked in now that the stock market has priced in (at least part of) a recession and funds should be shifted to currently underappreciated cyclicals.
In this article, I will outline my thinking in this regard using four major pharmaceutical companies: Johnson & Johnson (JNJ), Merck & Co., Inc. (MRK), Bristol-Myers Squibb Company (BMY), and Gilead Sciences, Inc. (GILD), as examples, and compare their current year performance, profitability with a focus on free cash flow (FCF), balance sheets, and most importantly, current valuations.
Johnson & Johnson
JNJ is not a pure-play pharmaceutical company, as it is also involved in the development and manufacture of medical devices and consumer health products. JNJ is very well diversified and has a strong pharmaceutical pipeline. Management has a knack for making successful acquisitions – just recently, the company announced the acquisition of Abiomed, the company best known for its heart support technologies. For such a large company (current market cap of $460 billion, enterprise value of $464 billion), JNJ is still surprisingly well-run and profitable. Investor service Morningstar has given the company a wide economic moat rating, citing “intellectual property in the drug group, switching costs in the device segment, and strong brand power from the consumer group.” Morningstar even believes JNJ has one of the widest moats in the healthcare sector.
In late 2021, JNJ management announced its intention to spin off its consumer healthcare business under the Kenvue name. The segment, which includes brands such as Neutrogena, Aveeno, Band-Aid, Listerine, Carefree and Tylenol, has grown weakly in recent years, by 1.1% and 4.1% in 2020 and 2021, respectively, and is also JNJ’s smallest segment, accounting for less than 16% of total sales in 2021. The main growth driver in recent years has been JNJ’s pharmaceutical segment, with revenue growth of 14% year-over-year in 2021, or 11% on a two-year compounded annualized basis. JNJ is primarily active in immunology and oncology, with Darzalex (daratumumab) and Imbruvica (ibrutinib, developed by AbbVie) in oncology and Stelara (ustekinumab) and Remicade (infliximab) in immunology being the key revenue drivers. Together, they account for more than 60% of sales in 2021. Other areas include neuroscience, infectious diseases, cardiovascular, metabolism and pulmonary hypertension. JNJ’s medical devices segment was unsurprisingly impacted by government-mandated measures to contain the spread of SARS-CoV-2, as elected surgeries in 2020 were mostly postponed. The segment grew only 2% on a two-year compounded annualized basis, but JNJ’s market-leading position in medical devices is evident, for example, in the strong 18% recovery in 2021. The segment contributed nearly 29% to JNJ’s 2021 top-line.
The soon-to-be pharmaceutical and medical device giant is known for its reliable returns and solid balance sheet, which I think is a particularly strong achievement given that JNJ is growing in large part through acquisitions, which unsurprisingly come with execution and impairment risks. JNJ’s three-year average interest coverage ratio is 21 ± 2.5 times free cash flow before interest (normalized for working capital movements and stock-based compensation expenses). The three-year average net debt to FCF ratio is extremely comfortable at 0.45 ± 0.29. Johnson & Johnson’s long-term debt is rated Aaa by Moody’s (S&P equivalent AAA), with a stable outlook confirmed on November 1, 2022.
JNJ’s three-year average operating and normalized free cash flow margins are very similar at approximately 22% with standard deviations of 2.3% and 3.0%, respectively. Its return on invested capital (ROIC) averaged 15.5% ± 2.8% over the last three years. The fact that its cash return on invested capital (CROIC) is even higher (17.4% ± 3.6%) proves that JNJ’s cash conversion is excellent. In any case, the company is routinely able to generate solid excess returns over its cost of capital.
Of course, investing in this blue-chip company is not without risks but I believe that the major risks are very visible today. The Inflation Reduction Act will put a slight pressure on JNJ’s bottom line, and of course, other government-mandated measures to put a lid on Big Pharma’s pricing power, and the competition from generics and biosimilars could dampen the otherwise very strong profitably of JNJ. Obviously, these are risks that pertain to all of the pharma companies discussed herein, but in particular those with significant exposure to the United States. JNJ generated 50% of its 2021 sales in the U.S., but of course, the aforementioned risks exclusively relate to its pharmaceutical segment. While the significant international exposure dampens JNJ’s regulatory risk as it pertains to the U.S., the company is exposed to a significant currency risk at the same time. Furthermore, JNJ is currently involved in several litigations related to talcum powder, opioids, surgical mesh products and its central nervous system drug Risperdal (risperidone).
Thanks to its solid operating performance, the company is able to pay a steadily increasing dividend. JNJ looks back on 60 years of uninterrupted dividend growth, and the five-year compound annual growth rate (CAGR) of its distribution to shareholders is still very acceptable at 6.1%, as is the three-year average dividend payout ratio of 57% ± 10% in terms of normalized free cash flow. These are all important reasons why JNJ is a very reliable stock with low volatility that typically trades at a premium valuation. As Table 1 at the end of the main body of this article and the FAST Graphs chart in Figure 1 show, the stock is certainly not cheap at its current price in the high $170s. Year to date, JNJ has generated a total return of 5.3%, including dividends. That may not sound like much, but it far outpaces the S&P 500 (SPY), which has been hit hard due to the stretched valuations of modern-era economy stocks that were adjusting somewhat closer to reasonable levels in 2022. Factoring in analysts’ relatively modest expectations and assuming JNJ continues to trade at an adjusted price-to-earnings (P/E) ratio of 17, the stock should yield 5% on an annualized basis over the next two years. If JNJ were to fall back to a P/E ratio of 15, which doesn’t seem unreasonable given its long-term average earnings growth rate of 7.8%, the annualized total return would be -1.4%. On a free cash flow basis, JNJ is more expensive, but given the strong FCF expectations over the next two years, the current valuation should be more closely aligned with fundamentals by 2024.
As a result, I do not believe there is significant upside potential, while at the same time I doubt JNJ faces significant downside risks given its well-diversified and largely recession-resistant portfolio, fortress-like balance sheet, and strong management. The stock is certainly supported in part by inflows from riskier exposures, however, a reversal of this trend seems likely only if we enter another period of easy money and related speculative exuberance.
Figure 1: FAST Graphs chart of Johnson & Johnson [JNJ] (with permission from www.fastgraphs.com)![Johnson & Johnson [JNJ] stock](https://static.seekingalpha.com/uploads/2022/12/8/49694823-16704970983172688_origin.png)
Merck & Co.
Merck is a large pure-play pharmaceutical company with a market cap of about $276 billion and an enterprise value of $302 billion (using 2021 year-end debt figures). I was previously not quite optimistic about its prospects, but finally got my head around the company as I outlined in my bullish analysis from early 2022 – fortunately, I should say, given the stock’s stellar performance – 44% year-to-date, including dividends.
Merck’s flagship drug is Keytruda (pembrolizumab), which contributes 35% of the company’s 2021 sales. However, the oncology drug’s success is still in its early stages, as evidenced by 20% year-over-year sales growth in the third quarter of 2022. Keytruda is undoubtedly a cash cow with excellent clinical data in many cancer indications, but it is only natural that competition will intensify in the coming years. Nevertheless, Keytruda is expected to become the world’s top-selling drug by 2026, with peak sales of $25 billion. Merck is fairly well diversified: Gardasil (human papillomavirus vaccine) and Januvia/Janumet (sitagliptin/metformin combination treatment for type 2 diabetes) accounted for 11% and 12% of the company’s sales, respectively, last year. While sales of Gardasil increased 15% year-over-year in Q3 2022, sales of Merck’s diabetes treatment continued to decline, down -15% year-over-year in Q3 2022, mainly due to competitors and generics. The company also operates a diversified animal health business, but this is rather small, accounting for 11% of sales in 2021.
As can be seen from the difference between enterprise value and market capitalization, Merck is more leveraged than JNJ. The three-year average interest coverage is significantly weaker at seven times pre-interest free cash flow (the same normalizations as above apply), but it should be noted that the ratio improved significantly in 2021 (13 times) due to stronger cash flows thanks to Keytruda. With a net debt to normalized free cash flow ratio of 5 ± 3, Merck’s debt appears very manageable, even though it is significantly higher compared to JNJ. Again, the large standard deviation is due to the significantly improved free cash flow in 2021. Year to date in 2022, the company generated $14.7 billion in operating cash flow, up more than 80% from the first nine months of 2021, while capital expenditures remained roughly flat. As of September 2022, the company’s leverage is down significantly year-over-year. Moody’s has rated the company’s long-term debt at A1 (S&P equivalent A+, medium investment grade), with the negative outlook unchanged since October 1, 2021.
In contrast to JNJ and several other pharma companies, Merck suffers from rather weak cash flow conversion, cash flow margin and high capital expenditures, as I discussed in my company-specific article. As a result, Merck’s CROIC is at times below the current cost of equity of 5.9%, as derived via the Capital Asset Pricing Model (CAPM), while its ROIC is generally well above the weighted average cost of capital, currently around 5.5%. However, with the strong improvement in free cash flow, Merck’s CROIC is back in the top quartile of its peer group, and I believe it will remain in this range for the foreseeable future.
In addition to the same sector-specific risks described for JNJ, Merck suffers from more pronounced concentration risk due to its reliance on Keytruda. Nevertheless, Morningstar rates the company with a wide economic moat due to “patents, economies of scale, and a powerful intellectual base” and a well-incentivized salesforce. The company is somewhat more exposed to international markets than JNJ (54% of total sales in 2021), so its earnings are naturally dependent on the strength or weakness of the U.S. dollar.
Thanks to the strong growth in free cash flow, Merck’s dividend appears very secure. However, it should be remembered that the company’s payout ratio (based on normalized free cash flow) has been above 100% in recent years. Management remains committed to growing the dividend, with so far 11 years of uninterrupted growth, but the recent increase by 6% was significantly below the five-year average of 8.7%.
The current dividend yield of 2.5% is 15% below the five-year average dividend yield, suggesting that the stock may be overvalued (Table 1 at the end of the main body). However, I think the stock is still quite reasonably valued and investors have only recently begun to appreciate Keytruda’s first mover advantage in a major indication of non-small cell lung cancer, the increasing number of indications, and the company’s efforts to prolong the drug’s patent protection (myself included). The FAST Graphs chart in Figure 2 also suggests that Merck is far from expensive, even though the stock is up a solid 42% year-to-date. One could argue that analysts are overestimating Merck in general and Keytruda in particular, but it’s important to remember that Merck is one of those companies that has a very strong correlation between analyst estimates and actual results, even on a two-year forward basis. It also seems worth noting that the FCF yield in Table 1 is overly conservative because it is based on Merck’s average normalized free cash flow for 2019 through 2021. On the basis of expected 2022 free cash flow, the ratio is about 5%, not cheap either, but much more reasonable. Morningstar currently considers the stock slightly overvalued and assigned MRK a fair value of $97.
Figure 2: FAST Graphs chart of Merck & Co [MRK] (with permission from www.fastgraphs.com)![Merck [MRK] stock](https://static.seekingalpha.com/uploads/2022/12/8/49694823-16704987978491616_origin.png)
Bristol-Myers Squibb
I will not discuss the company in detail, as I have covered it several times in the past. In my original analysis in April 2022, I compared the company to AbbVie (ABBV) and made several arguments as to why I believe the stock is still undervalued, even though it has rebounded strongly from its low of $53 in November 2021. The stock has been treading water for most of 2022, but its 29% year-to-date performance, including dividends, is certainly nothing to sneeze at. However, it is likely that investor optimism is still somewhat muted due to the loss of exclusivity (LOEs) on key cash flow drivers such as Revlimid (lenalidomide, treatment for multiple myeloma). However, the company’s pipeline – which it largely obtained through the acquisition of Celgene in 2019 – is very strong, as I discussed in my Q2 and Q3 2022 earnings updates, and I am quite optimistic that management will achieve its 2022 to 2024 cumulative FCF target of $45 to $50 billion. BMY’s largely oncology-focused pipeline is indeed strong, but the company is still playing catch up with Merck, which is clearly the top dog in immuno-oncology.
All in all, the Celgene acquisition was certainly a bold and risky move, but it has paid off, and I consider Bristol Myers to be significantly less risky than AbbVie because of its better cash flow visibility and much more manageable debt. This is underscored by Moody’s A2 credit rating (S&P equivalent A, medium investment grade) with a stable outlook since February 4, 2021, while AbbVie’s long-term debt was rated Baa1 (S&P equivalent BBB+, low investment grade).
BMY’s interest coverage ratio is 13 times pre-interest normalized free cash flow. Note that the ratio is based on average 2020 and 2021 FCF, i.e., after consolidation of Celgene. On the basis of 2021 free cash flow, the company’s leverage ratio in terms of net debt to FCF is about 1.7x, which is very acceptable indeed. Apart from the – in my opinion very manageable – refinancing risk, Bristol Myers is of course exposed to the same risks as other large pharmaceutical companies. However, while near-term free cash flow is very visible, longer-term success naturally depends on the company’s pipeline, which appears strong, but of course is not immune to black swans such as disappointing clinical data, safety concerns, etc. In addition, the company’s focus on sales in the United States seems worth noting – 63% of sales in 2021 were domestic, giving the company above-average exposure to local regulatory risks. At the same time, the focus on the U.S. leads to stronger cash flow and profitability due to still significantly stronger domestic pricing when compared to, e.g., Europe.
In 2022, BMY’s FCF is expected to be around $15-16 billion, dwarfing last year’s dividend payout of $4.4 billion (about 30%). The dividend growth rate has improved since the Celgene acquisition. As a result, and given the very modest payout ratio, I think it is very reasonable to expect another solid dividend increase this month (note that the 10% dividend increase and buyback announcement marked the reversal of BMY’s stock price trend last year). The company is on track for 16 years of uninterrupted dividend growth.
With a current dividend yield of 2.7% – 9% below the five-year average – the stock appears slightly overvalued from a dividend investor’s perspective, but it should be remembered that the recent past has been marked by considerable uncertainty due to the risky acquisition of Celgene. Morningstar has assigned BMY a fair value of just $66, which represents a current premium of over 20%. Perhaps I am being overly optimistic, but the good capital allocation skills of management actually make me very positive about my holding in the company. I expect Bristol Myers’ near-guaranteed – and very strong – near-term free cash flow to be put to good use (debt reduction, share repurchases, small acquisitions) and deem it very likely that the company can operate with an even stronger balance sheet from 2025 and beyond as its pipeline candidates mature. I stand by my earlier conclusion that the stock is not expensive, underscored by the interesting fact that Merck – which I also don’t think is expensive – has a 50% higher enterprise value but will generate similar free cash flow in 2022. Of course, Merck’s free cash flow growth expectations are much higher than Bristol Myers. Finally, I would add that the stock is still trading at levels close to its 2016 peak. Back then, the future of the company was much more opaque – surprisingly, market participants were much more optimistic on a like-for-like basis than today (see FAST Graphs plot in Figure 3).
Figure 3: FAST Graphs chart of Bristol Myers Squibb [BMY] (with permission from www.fastgraphs.com)![Bristol Myers Squibb [BMY] stock](https://static.seekingalpha.com/uploads/2022/12/8/49694823-16704997656509118_origin.png)
Gilead Sciences
Last but not least, I would like to briefly discuss the “ugly duckling” of Big Pharma – Gilead Sciences. Back in 2013, the company made headlines with its blockbuster therapies for hepatitis C virus (HCV) infections, Sovaldi (sofosbuvir) and Harvoni (combination of ledipasvir and sofosbuvir), which drove sales to an all-time high of nearly $33 billion by 2015. Like BMY, I first covered the company in April of this year, rating it a “strong buy” based on its unwavering strength in bringing successful antiviral drugs to market, disciplined capital allocation and an underappreciated pipeline. Of course, the diversification efforts of CEO Daniel O’Day (a former Roche executive) through rather costly acquisitions are not yet bearing significant fruit, but the third quarter results confirmed that the company is on a good path, as I analyzed in my earnings update.
Thanks largely to the success of its HCV business, Gilead maintained a very solid balance sheet. The costly acquisitions (Kite Pharma for $12 billion in 2017, Forty Seven for $5 billion in March 2020, Immunomedics for $21 billion in September 2020) have taken their toll, but it seems unfair to conclude that Gilead is overleveraged. Net debt of just over two times 2021 normalized free cash flow is still very manageable and in line with other pure-play pharma companies. However, in 2019, the ratio was only 0.13 times normalized FCF. At the end of 2021, Gilead’s interest coverage stood at around 10 times free cash flow before interest. The leverage ratio will be higher and interest coverage weaker as 2022 draws to a close, largely due to reduced income taxes payable and accrued liabilities. Moody’s has rated Gilead’s long-term debt A3 (S&P equivalent A-, medium investment grade) with a stable outlook, which was upgraded from a negative outlook on August 4, 2022.
From an operating perspective, Gilead’s free cash flow has been surprisingly stable in recent years, but of course the company’s success with remdesivir (originally developed for treatment of Ebola virus infections) has bolstered otherwise declining cash flow. Pessimists might call this a windfall profit, while I would call it more of a strong sign of the company’s steadfast ability to bring successful antiviral drugs to market. Gilead continues to do very well in the HIV market (after an understandable trough in 2020 due to the pandemic) with blockbusters Biktarvy (bictegravir), but increasingly less so with Genvoya (elvitegravir/cobicistat/emtricitabine/tenofovir alafenamide) and Descovy (emtricitabine/tenofovir alafenamide). In addition to Biktarvy’s growth, the relatively new long-acting injectable lenacapavir is also starting to make a significant contribution, having received its first approval in Europe, where it is marketed as Sunlenca. Gilead’s oncology business (Trodelvy and the cell therapies Tecartus and Yescarta) is showing strong growth, but is not yet a significant contributor to sales. The reliable cash flows from the current blockbusters result in a three-year average free cash flow margin of 33% ± 2% and a CROIC of 18% ± 3%, well above the CAPM-derived cost of equity of only 4.3%. As an aside, this nicely illustrates the shortcomings of such a textbook approach – such a low cost of equity simply seems inappropriate given the above-average risks associated with investing in Gilead and its rather uninspiring performance in recent years. In any case, the company’s solid CROIC is well above any reasonable estimate for Gilead’s cost of equity. My own estimate is about 9% to 10%, based on the current risk-free rate (long-term government bonds) and a 5% to 6% equity risk premium.
Given Gilead’s more opaque future, the still significant concentration risk in HIV and HCV therapies, which face increasingly fierce competition and thus pricing pressure, and finally the much stronger exposure to the U.S. (70% of total sales), I believe a somewhat higher equity risk premium than for Bristol Myers (3% to 4%) is justified. Gilead’s focus on the U.S., of course, in turn reduces the volatility of its earnings from the perspective of exchange rate fluctuations.
Year to date, the share has generated a return of 24% including dividends. However, it should not be forgotten that the market was probably still quite euphoric about Gilead’s better-than-expected sales of Veklury. Since bottoming in March 2022, the stock has gained more than 50% year-to-date, outperforming the S&P 500 by a wide margin. Of course, it should not be forgotten that the stock has been treading water since 2017. Given that the stock saw most of its gain in the weeks following solid third-quarter results, it’s fair to ask whether GILD is now overvalued at a current price of $88.
The FAST Graphs chart for Gilead in Figure 4 suggests that the stock is still undervalued and could still give rise to a solid 13% annualized return over the next two years – as long as the valuation rises to a “fair” P/E of 15.
Figure 4: FAST Graphs chart of Gilead Sciences [GILD] (with permission from www.fastgraphs.com)![Gilead Sciences [GILD] stock](https://static.seekingalpha.com/uploads/2022/12/8/49694823-16705007393713994_origin.png)
However, considering that significant growth is not expected to materialize anytime soon – and this forecast is by no means unrealistic given the early stage of Gilead’s oncology portfolio – I doubt that there are material further (near-term) gains to be made here. I’m hesitant to sell because I hold Gilead in a taxable account and my position currently offers me a yield on cost of 5.1%, and the next dividend increase is just around the corner, which will likely drive the yield on cost up another 30 basis points. This would mean that Gilead’s board would have to sign off on a 6% dividend increase, which doesn’t seem too unrealistic given the five-year average dividend CAGR of 7.0% and the current payout ratio of about 40% of normalized free cash flow. The current yield of 3.3% is about 13% above the five-year average, but of course this period has been largely characterized by uncertainty. Taking taxes into account (Equation 1), I would have to shift the proceeds into a stock that currently yields 3.9%, which is currently impossible in the Big Pharma space. As a result, I am shifting some of my investment into more cyclical sectors, in part because I know that the healthcare sector has seen significant inflows during this late stage of the business cycle.
Equation 1 (author)
Table 1: Year-to-date performance of four pharmaceutical companies and several valuation metrics (own work, based on the companies 2021 10-Ks, data from Morningstar and Seeking Alpha)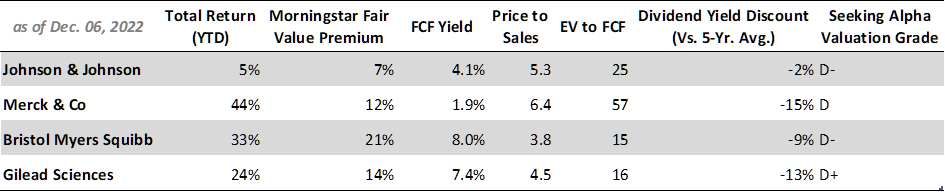
Summary And Conclusion
Johnson & Johnson is hardly ever on sale and deservedly continues to trade at a robust valuation. I don’t expect the stock to move significantly up or down in the near term, and appreciate the company’s good diversification, strong profitability, fortress-like balance sheet, and unwavering commitment to the dividend. JNJ is rightly an anchor position, so I think it would be foolish to sell the position just to lock in gains. The likelihood of this slow-moving behemoth appearing on the bargain table is very low indeed, as its main risks are very visible and a quick return to easy money policies and associated speculative excesses seems unlikely.
Merck, Bristol Myers Squibb and Gilead are quite different animals. Merck’s success with Keytruda was slow to become visible, and the market only began to appreciate the potential of the immuno-oncology drug this year. The improved visibility of cash flows has likely helped Merck’s stock price, too, but of course the company carries significant concentration risk with Keytruda. The future of Bristol Myers almost seemed a bit enigmatic when the company announced its acquisition of Celgene. However, this important move has transformed BMY into a large and well-diversified pharmaceutical company that has strong current cash generators (Eliquis, Revlimid, Opdivo, Orencia) and a solid pipeline focused on oncology. One reason for still somewhat muted optimism (the stock still trades at an adjusted P/E ratio of about 10) is the company’s patent cliff, but I feel more comfortable with Bristol Myers than, say, AbbVie, which is still very dependent on Humira (adalimumab) and is much more indebted. Gilead has finally earned some love from Mr. Market, but I think investors are very forward-looking at a price near $90. The company’s oncology pipeline is still at a very early stage.
From a broad perspective, the healthcare sector in general has performed very well in 2022, due to the understandable late-cycle rotation to defensive stocks. Companies like Merck, Bristol Myers and Gilead stand out performance-wise due to increasingly improved cash flow visibility and/or reduced pipeline uncertainty. However, it should also be kept in mind that their significant outperformance versus the S&P 500 (-17% year-to-date, including dividends) is also due to the stretched valuations of modern-era economy stocks, which adjusted somewhat closer to reasonable levels in 2022.
Therefore, comparing the performance of the S&P 500 with that of Big Pharma stocks is not very helpful in answering the question of whether to reduce exposure to the sector. However, I think that the company-level assessment in this article provided some food for thought and permits the conclusion that the sector as a whole is not overvalued. Instead, I think it is appropriate to shift a moderate amount of money into cyclicals, from select pharma companies with a still largely uncertain future – but increasingly optimistic investors – like Gilead.
However, while investors may have gone a bit too far with Gilead in particular, and I plan to reduce my exposure, I think the old adage of viewing the portfolio as a bar of soap is very appropriate here. Not disturbing the miracle of compound interest is probably the best long-term strategy. I doubt that the sector as a whole can be described as overvalued and will, therefore, maintain my positions in JNJ, BMY and MRK.
Thank you very much for taking the time to read my article. In case of any questions or comments, I am very happy to read from you in the comments section below.
Be the first to comment