

monsitj
There are a lot of different ways to analyze markets; fundamental and technical analysis are two of the most popular. Certainly, assessing the likely future path for corporate earnings and studying price patterns and momentum are both worthwhile if not crucial to successful investing. Fundamentals tell a story about trends in the business cycle and technicals tell you how investors react to hearing that story. Each, then, is most useful when viewed in the context of the other.
As to the fundamentals, history suggests that the rapid rises in the dollar, interest rates, and oil prices over the past couple of years represent a uniquely bearish trifecta that will likely have a very negative effect on earnings over the next year or so. Long-term technicals, notably momentum, appear to confirm this analysis. And bearish fundamentals paired with bearish technicals may simply be an effective way of defining a bear market (better at least than the arbitrary 20% rule).
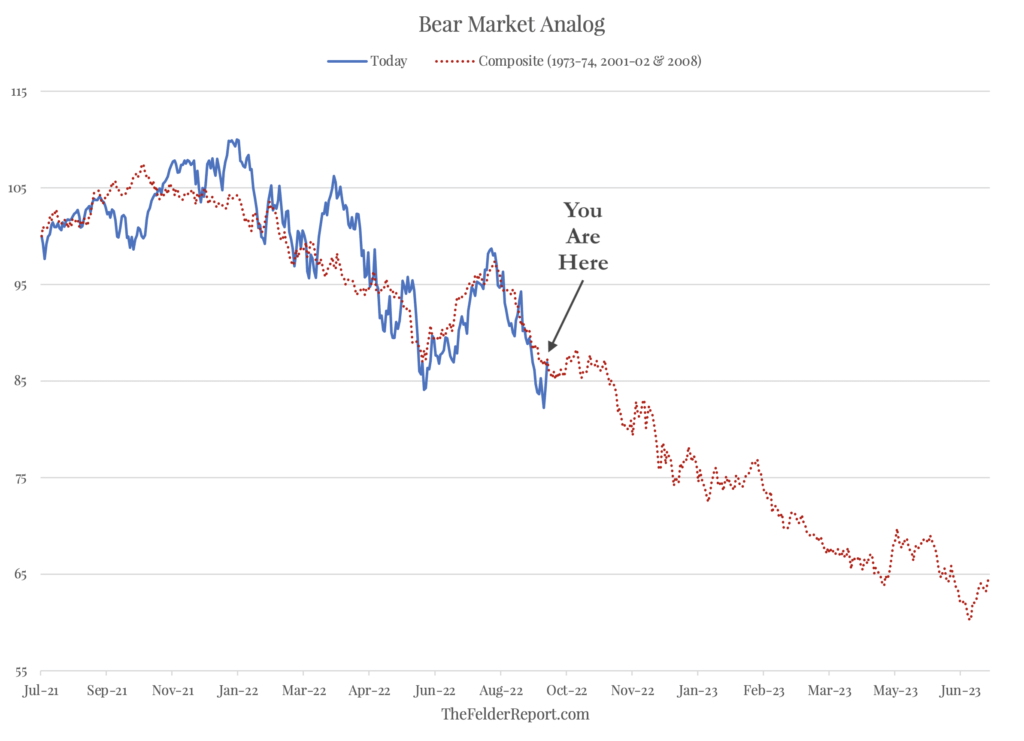
Given that we are now in a bear market (however you choose to define it), history suggests we may only be about halfway through the process. Previous downturns driven by the bearish trifecta noted above were both more prolonged and more significant in terms of price decline than what we have seen in the stock market so far. Of course, history doesn’t repeat itself but it often rhymes; so while the current bear market is unlikely to follow the pattern perfectly, the price analog in the chart above may be as good a map for the road ahead as any you’ll find.
Editor’s Note: The summary bullets for this article were chosen by Seeking Alpha editors.
Be the first to comment