

Douglas Rissing/iStock via Getty Images
As the government sector grows larger, real economic growth declines. Not every quarter or every year, but the trend level of economic growth is continuously suppressed by increased government spending.
This statement does not come from a dogmatic political view but rather from academic research, the logic of incentives, and data that has proved this thesis over the last several decades.
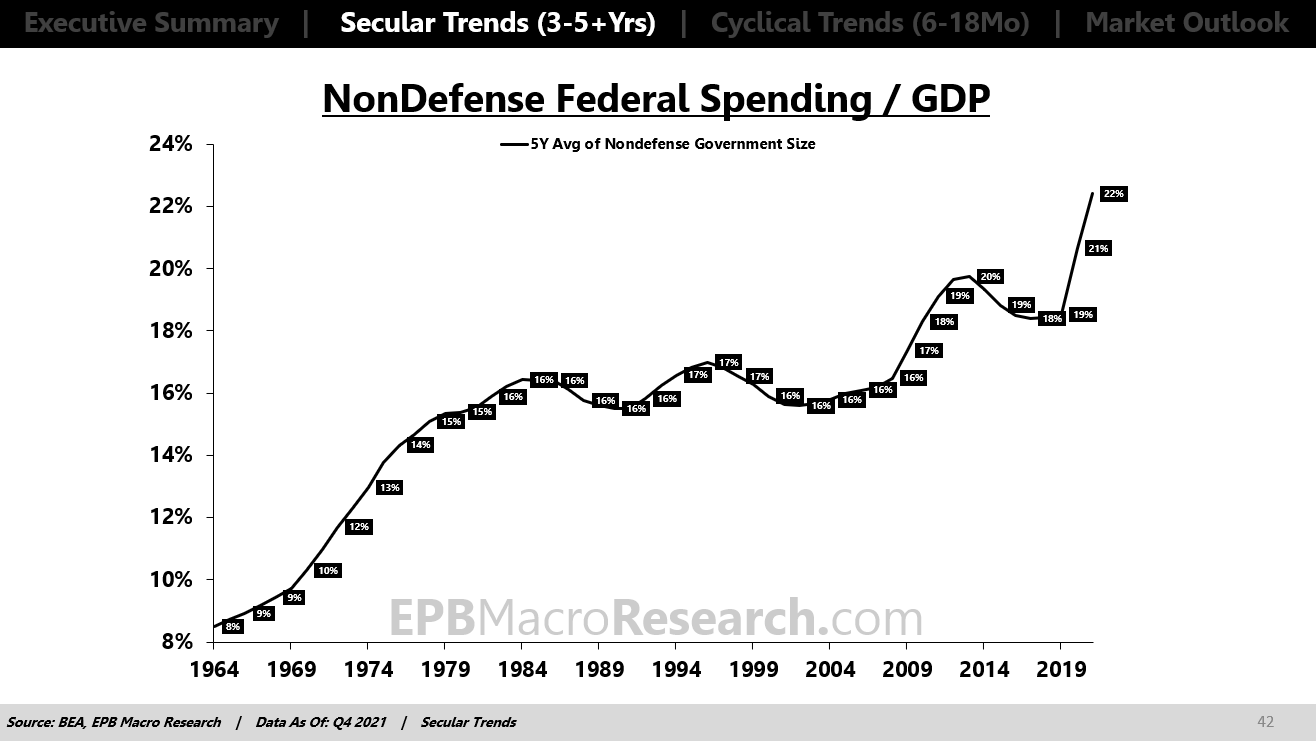
We can measure government size in various ways, but one reliable method is to look at the rolling average of non-defense government spending as a percentage of GDP.
We look at the rolling average because the persistent encroachment of government is the main issue rather than one-time increases that are quickly reversed.
The chart below shows how government size has increased from 8% of GDP in the early 1960s to 22% as of 2021.
In other words, government size has increased by 14%.
BEA, EPB Macro Research
Economists Andreas Bergh and Magnus Henrekson published a paper in 2011 titled “Government Size and Growth,” which highlighted that a 10% increase in government size reduces real economic growth by 0.5% to 1.0%.
Based on this research, this 14% increase in government size should have resulted in a long-term decline of US real GDP growth in the range of 0.7% to 1.4%.
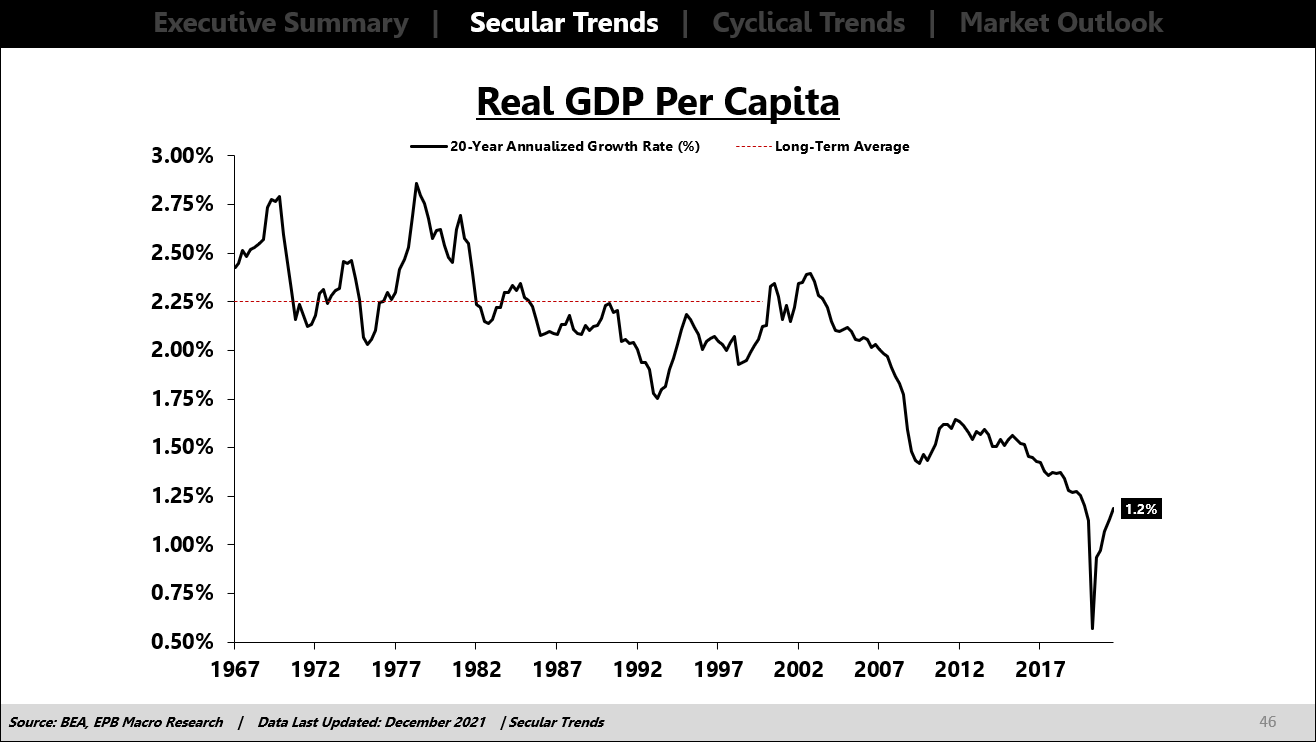
If we look at the very long-term trend in US real GDP growth, a 20-year rolling average, we can see that economic growth averaged 2.25% from the 1960s to the 1990s, with much of the earlier part of those years well above 2.5%.
Over the last 20 years, economic growth has increased at a 1.2% annualized rate, a decline of slightly more than 1.0%, perfectly in line with the research of Bergh and Henrekson.
BEA, EPB Macro Research
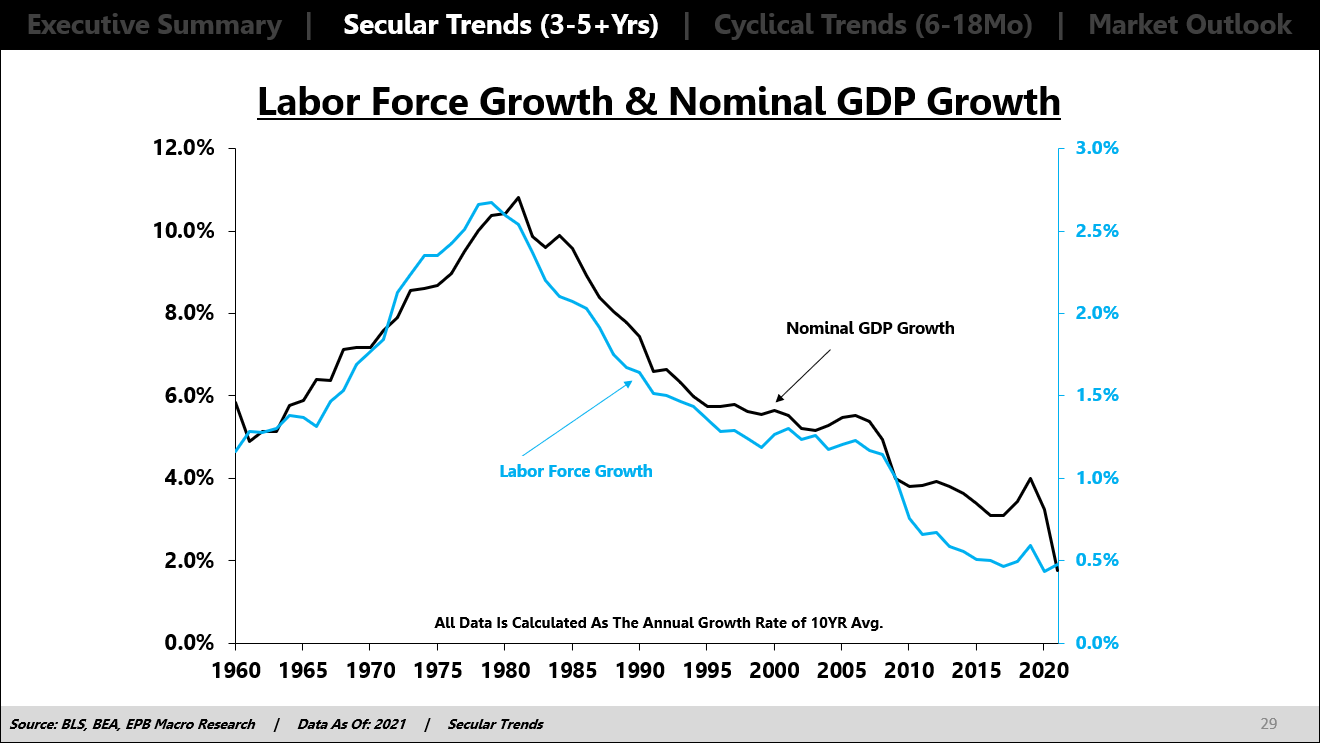
We know that long-term trend economic growth is a function of population growth and productivity growth. The chart below shows how nominal growth and labor force growth are closely correlated.
BLS, BEA, EPB Macro Research
The increased size of government or the persistent rise in government spending erodes the productivity of an economy through a rearrangement of incentives.
When you combine declining population growth with increased government size, thereby reducing long-term productivity, you create a potent cocktail of weaker economic growth.
In the book “Free to Choose” by Milton and Rose Friedman, a worthwhile read for everyone, the changing incentive structure created by government spending is revealed, highlighting why persistently higher government outlays reduces overall workforce productivity and leads to lower long-term economic prospects.
In “Free To Choose,” we are presented with a four option table about spending money.
When you spend money, you can spend your own money or someone’s money, and you can spend money on yourselves or spend on someone else. The table is presented as such:
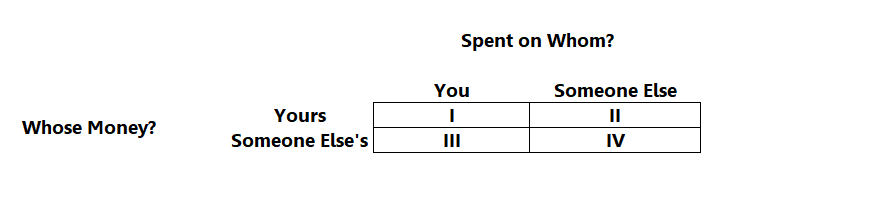
“Free To Chose”
The book outlines each category.
Category I refers to spending your own money on yourself. The incentive is clear. You will always try to maximize the value you get for each dollar spent. You have a strong incentive to minimize waste and maximize “output.”
Category II refers to spending your own money on someone else. The example given is a Christmas gift or birthday present. Although perhaps not quite as strong as category I, your incentive to maximize value is still clear. There will be some loss in value because your preferences and the recipient’s preferences are not identical, so while you may think you are maximizing value, it may not be as efficient as transferring cash to the recipient for them to spend, placing them back in a category I situation.
Category III involves spending someone else’s money on yourself. This is a wonderful situation where you have no incentive to maximize value at all. The example given is that you are eating lunch on someone else’s expense account. You want to get enough value to satisfy your needs, but there’s clearly a lack of incentive to stretch each dollar as there is in category I.
Category IV involves spending someone else’s money on someone else. The example given is that you are buying someone’s lunch on someone else’s expense account. There is almost no incentive at all to maximize the value of each dollar spent.
Category IV spending will clearly lead to significant waste and much less efficiency compared to category I spending.
All government spending creates category III or category IV spending, which radically reduces the productive value of each dollar spent in the economy not even including the deadweight loss of salaries and administrative costs for the people in the middle conducting the spending.
While most government spending is done with good intentions, there is virtually no way to ensure that the efficiency and productivity of the spending will be equal to category I or category II-type spending.
Of course, there are some functions that government needs to carry out, but the point here is that as government size grows, we are marginally converting category I or category II spending into category III or category IV spending.
BEA, EPB Macro Research
Each transaction we convert from I or II to III or IV may have a negligible effect that is invisible to the naked eye, but like compound interest, small changes accumulated over many decades create massive transformations.
As government size in the United States has increased from 8% to 22%, we have shifted 14% of our economy to category III or category IV spending, which cannot have the same efficiency as category I or II spendings.
BEA, EPB Macro Research
The collapse in per capita growth is clear evidence of these inefficiencies manifesting over time, corroborating the research of Bergh and Henrekson.
It’s virtually assured that population growth in the United States will continue to decline as demographic forecasts are slow moving and relatively accurate.
It’s also virtually assured that government size will grow in the future due to Social Security, Medicare, and Medicaid, combined with the political reality that shrinking government size is a historical anomaly.
Through the logic of incentives, productivity growth will erode over time. When coupled with declining demographics, the two factors that comprise trend growth imply a continuous decline in per capita GDP growth.
The 2.5% growth that faded to 1.5% growth will soon be appealing as sub 1% sustained real growth will become the new reality in the decade to come.
Be the first to comment