

picture alliance/picture alliance via Getty Images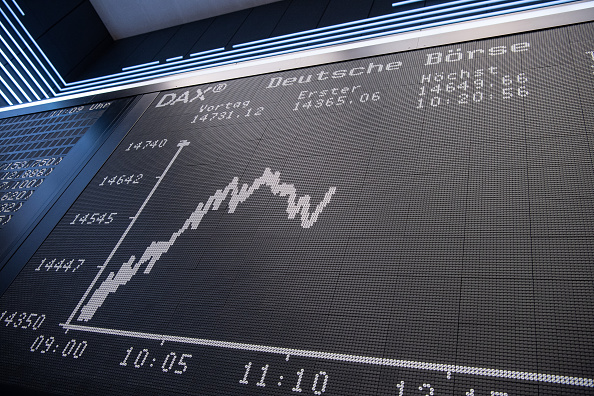
We will be watching this week to see if the S&P 500 can rally past its 200-day moving average in an obvious downtrend that started on the first trading day in 2022. The market has repeatedly resisted that level for one year, but our friends in Frankfurt have long ago blown through those levels. The German DAX (the equivalent of our S&P 500) broke its 200-day moving average in November of last year.
The DAX rose more than 3,000 points off its October low (up more than 26%) and is now technically in bull market territory, so why do I have my doubts that this running of the bulls in Germany will continue?
StockCharts.com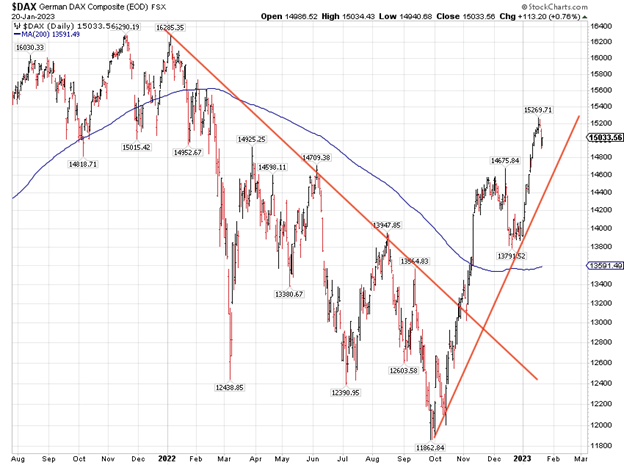
I think the DAX has risen so rapidly since the “Armageddon energy scenario” was taken off the table, given that the Nord Stream pipelines were literally blown up. The influx of LNG tankers to Europe managed to solve the problem for this winter, which so far has turned out to be incredibly mild, both in the U.S. and Europe, but the issue remains that half the gas in storage right now is Russian and there will be logistical issues of how insufficient storage facilities are filled up next winter. In essence, Europe traded its dependence on Russian pipelines for dependence on Qatari LNG tankers, which poses other issues.
Trading Economics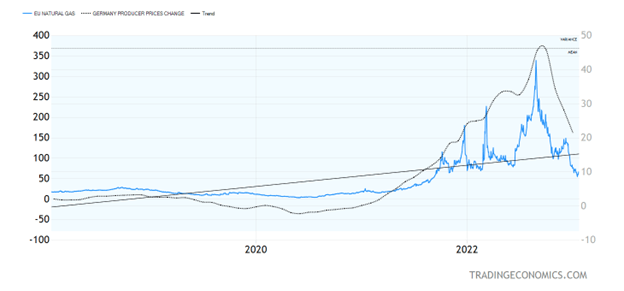
To understand how bad it got in Germany, the German version of our Producer Price Index rose 45.8% in September 2022 (year-over-year), and the latest rate is still a lofty 21.6% for December 2022. Such spikes in inflation were driven by high natural gas prices (due to Vladimir Putin turning the gas down or off), as well as super spikes in electricity prices due to the botched decarbonization policies of the EU, such as relying too much on wind power at a time where there wasn’t enough wind! I can understand how a relief rally can overshoot reality as the worst-case scenario is being priced out, but there remain a few reasons why the coming sell-off will wipe out at least half of the DAX gains since October, if not the whole rally.
Reason #1: The Ukrainian war is about to enter its most dangerous phase, as both sides regroup for a Spring offensive. It’s going to get ugly, possibly uglier than at any point so far, as Ukrainians want the Russians out and Russia wants to finish what they started and legitimize with an internationally ratified peace treaty the takeover of Crimea and four Ukrainian regions (which they have not completely captured yet). They want an unaligned status (no NATO membership) for Ukraine guaranteed in the Ukrainian constitution, as they feel threatened by NATO expansion, and they have shown that they are willing to go very far to make this happen. I think it will get very ugly very soon, which is bearish for the DAX.
Institute For The Study Of War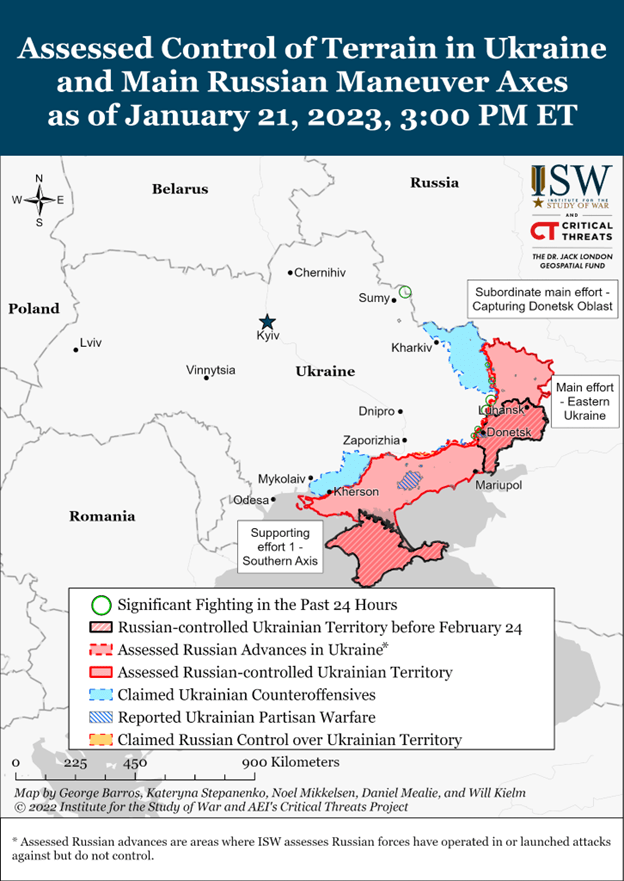
I think the above-shown map will look very different by June.
Reason #2: The ECB is tightening money (faster than the Fed this year) and has indicated that it needs to press harder on the brakes. The trouble with quick moves, when it comes to central banks, is that they tend to create more volatility in financial markets. The ECB balance sheet has now dropped by about 10% in about two months, and we expect multiple 50-basis point rate hikes. I am not quite sure what the ECB terminal rate is (that is, where the bank stops hiking), but it is quite a bit higher than the present level of 2.5%. (In the U.S., the Fed says it is 5.1%, while the Fed fund futures market says it is near 4.7%.)
Trading Economics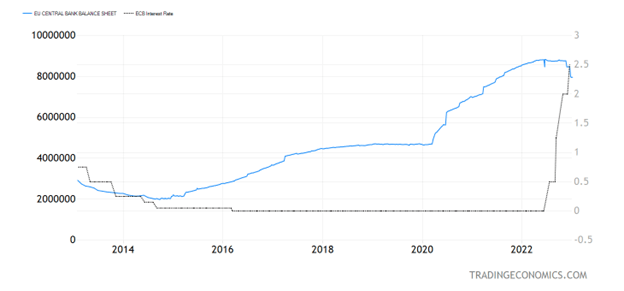
I don’t see how the DAX can keep rallying with that much monetary tightening coming in the next six months in a rapidly deteriorating geopolitical situation.
All content above represents the opinion of Ivan Martchev of Navellier & Associates, Inc.
Disclosure: *Navellier may hold securities in one or more investment strategies offered to its clients.
Disclaimer: Please click here for important disclosures located in the “About” section of the Navellier & Associates profile that accompany this article.
Editor’s Note: The summary bullets for this article were chosen by Seeking Alpha editors.
Be the first to comment