

cemagraphics
(This article was co-produced with Hoya Capital Real Estate)
Introduction
With thousands of ETFs just for US equities available, having one ETF as a Core holding to build size and/or Growth/Value allocation shifts around would be ideal in my view as I doubt (assume) few investors slant 100% of their US equities into one bucket. As the next table highlights, no single size or growth/value component consistently was the top performer.
portfoliovisualizer.com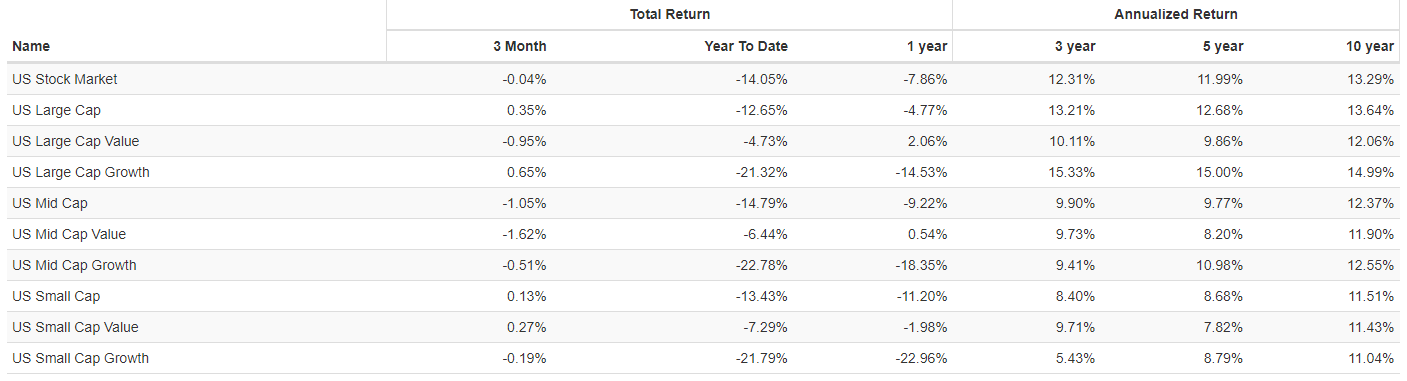
To that end, I will review these two ETFs and briefly cover their underlying index.
- SPDR Portfolio S&P 1500 Composite Stock Market ETF (NYSEARCA:SPTM)
- iShares Core S&P Total U.S. Stock Market ETF (NYSEARCA:ITOT)
For parts of the comparison, I will include a 3rd ETF that is based on the Russell 3000 Index, the iShares Russell 3000 ETF (IWV). For investors looking for one ETF to cover the whole US equity market, I would consider any of the three to be a viable core holdings, using other ETFs to adjust the overall allocation between size and/or growth/value stocks.
SPDR Portfolio S&P 1500 Composite Stock Market ETF review
State Street Global Advisors describes their ETF as:
The SPDR® Portfolio S&P 1500® Composite Stock Market ETF seeks to provide investment results that, before fees and expenses, correspond generally to the total return performance of the S&P Composite 1500® Index. A low-cost ETF that seeks to offer precise, comprehensive exposure to the US equity market encompassing stocks across all market capitalizations, representing approximately 90% of the investable US equity market. SPTM started in 2000.
Source: ssga.com SPTM
SPTM has $5.7b in AUM and provides a 1.6% yield to investors. The managers charge only 3bps in fees. Since both ETFs invest based on an index, reviewing those is an important piece of the due diligence process.
Index review
S&P describes their Index as:
The S&P Composite 1500® combines three leading indices, the S&P 500®, the S&P MidCap 400®, and the S&P SmallCap 600®, to cover approximately 90% of U.S. market capitalization. It is designed for investors seeking to replicate the performance of the U.S. equity market or benchmark against a representative universe of tradable stocks.
Source: spglobal.com Index
They also provided critical data points about this Index:
spglobal.com Index PDF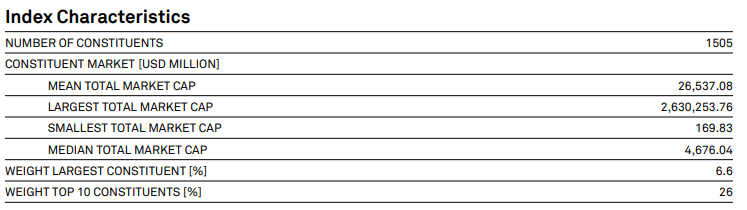
This S&P index uses the following rules in its construction:
spglobal.com Index PDF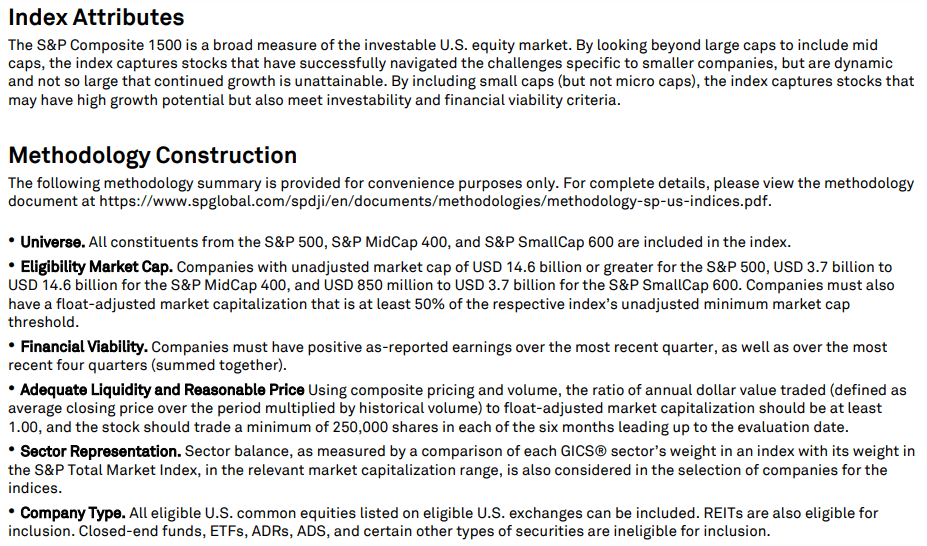
SPTM holdings review
ssga.com SPTM sectors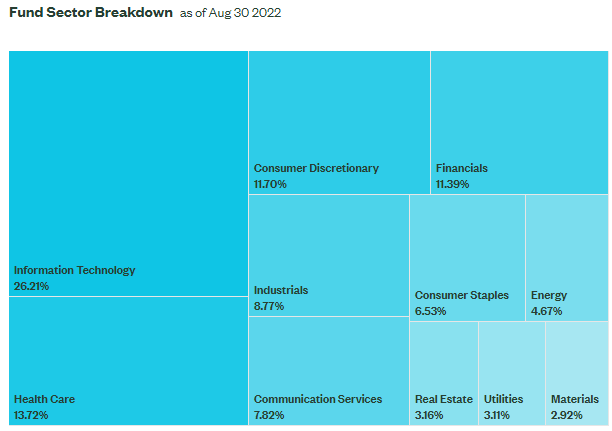
Like most ETFs holding Large-Cap US stocks, Technology stocks are by far the highest sector allocation. Even the allocation to the next two highest sectors (Health Care, Consumer Discretionary) combined are less weight. The smallest three allocations (Materials, Utilities, Real Estate) combined total under 10% of the portfolio, meaning little impact to results will come from there.
Top 20 holdings
ssga.com; compiled by Author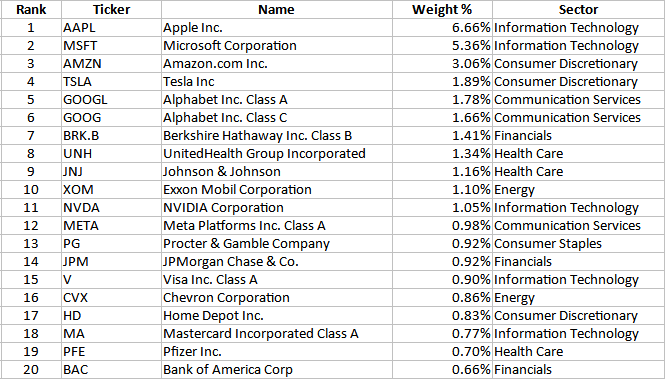
As expected, Technology and Consumer Discretionary stocks dominate the largest positions, comprising about half the list. The Top 10 are 25+% and the Top 20 34% of the entire portfolio.
SPTM distribution review
seekingalpha.com SPTM DVDs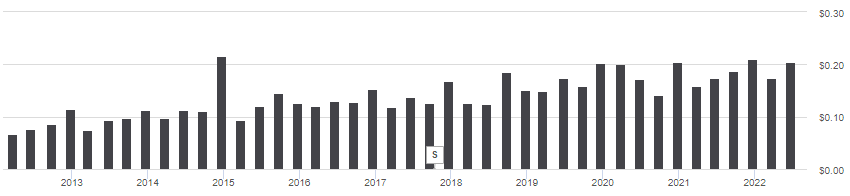
SPTM has grown its distributions by more than 10% over the past decade, though recent growth has been slower. While steady income is provided, a 1.6% yield is on the low side for income-oriented investors. Seeking Alpha gives SPTM an “A” grade for this factor.
seekingalpha.com SPTM scorecard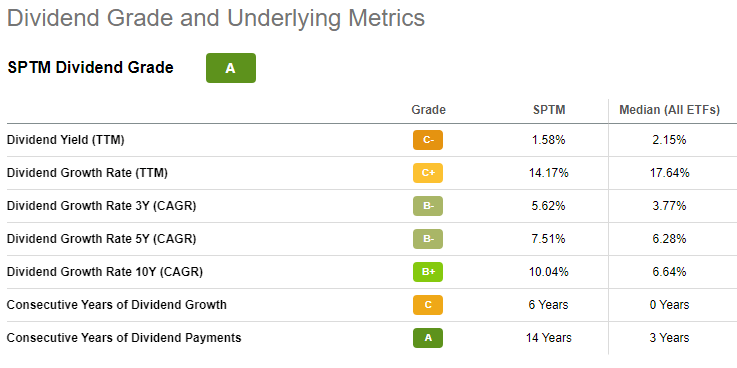
iShares Core S&P Total U.S. Stock Market ETF review
iShares describes their ETF as:
The iShares Core S&P Total U.S. Stock Market ETF seeks to track the investment results of a broad-based index composed of U.S. equities. It provides investors with a low-cost and convenient access to the total U.S. stock market in a single fund, ranging from some of the smallest to largest companies and can be at the core of your portfolio to seek long-term growth. It invests based on the S&P Total Market Index. ITOT started in 2004.
Source: ishares.com ITOT
ITOT has $43.5B in AUM and shows a yield of 1.5%. The managers also get 3bps in fees.
Like SPTM, let’s review the underlying index.
Index review
S&P provides the following description about this Index:
The S&P Total Market Index is designed to track the broad equity market, including large-, mid-, small-, and micro-cap stocks. The S&P 500® and the S&P Completion Index are subsets of the S&P TMI.
Source: spglobal.com Index
These construction points were provided:
spglobal.com Index Methodology PDF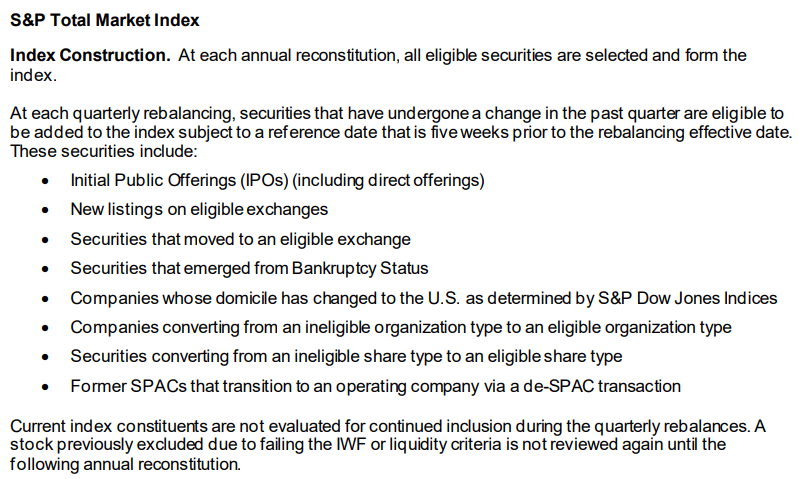
They also provided critical data points about this Index:
spglobal.com Index PDF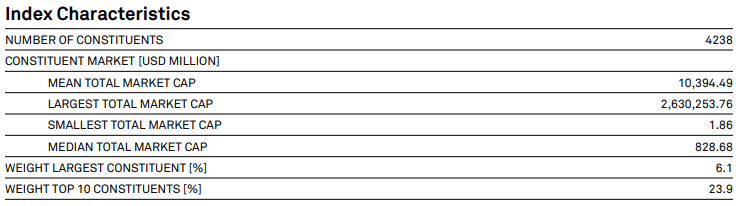
Later we will see that the ETF holds only 85% of the stocks in the underlying index.
ITOT holdings review
Sector allocations closely match SPTM and will be compared later.
ishares.com ITOT sectors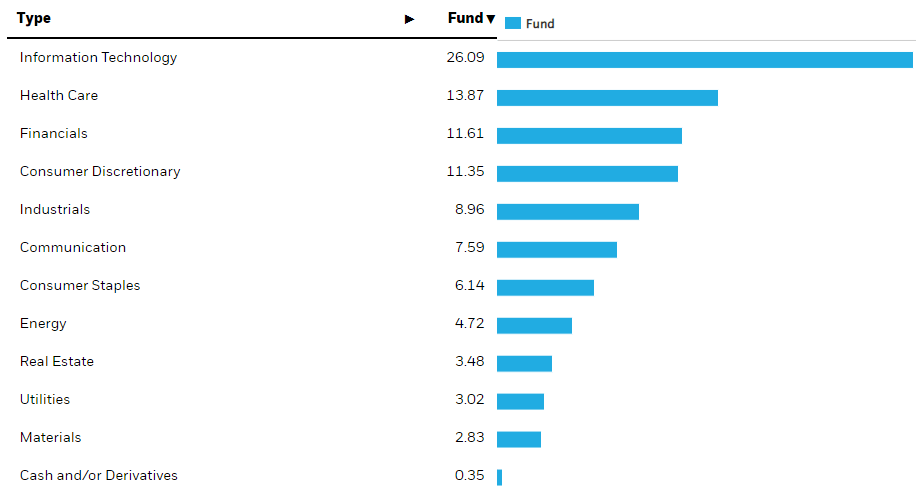
Top 20 holdings
ishares.com; compiled by Author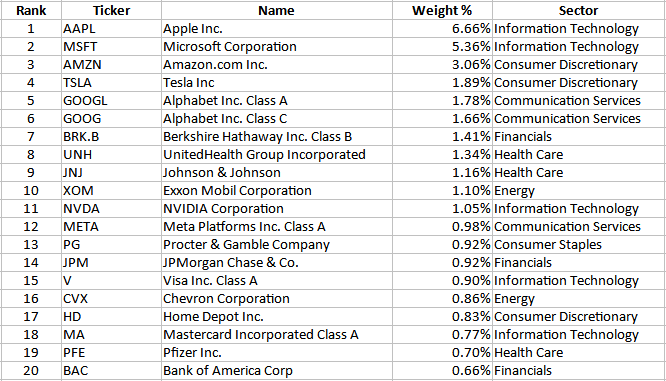
The two ETFs have the same stocks in common until you reach #20. Even having over twice the holdings, the concentration is not much lower: 23% for the Top 10; 31% for the Top 20. Total holdings count is just over 3600.
ITOT distribution review
seekingalpha.com ITOT DVDs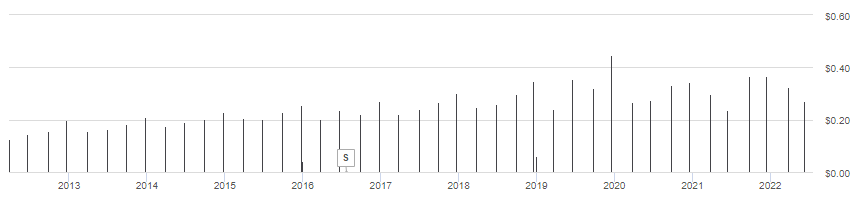
ITOT has slower distribution growth than SPTM has shown over the past five and ten years. That helps explain the slightly lower grade from Seeking Alpha.
seekingalpha.com ITOT scorecard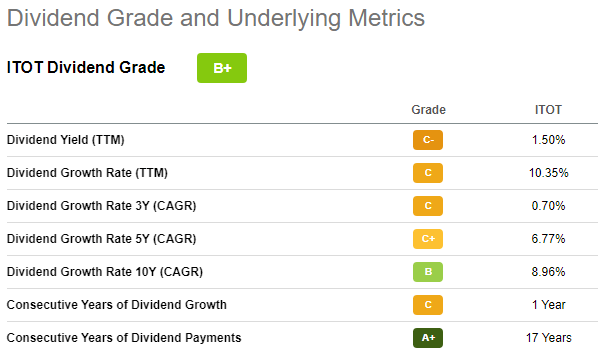
Comparing the ETFs
Over the past decade the index used by SPTM returned 13.07% versus 12.8% for ITOT’s index and that shows in the longer results too. This is how the actual ETFS have since both were available.
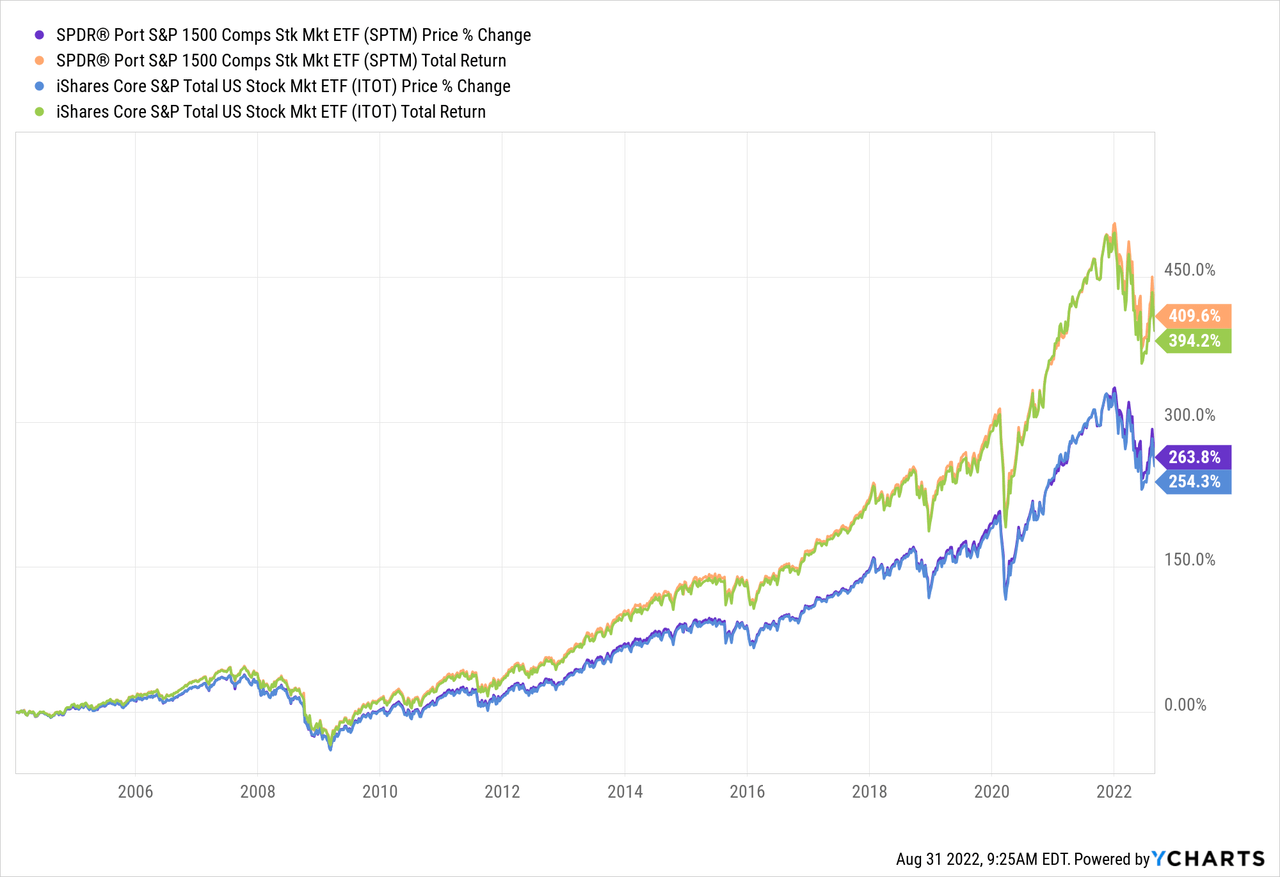
The StdDev shows little difference too, with ITOT barely better. Current equity factors also show little difference between the two ETFs.
Fidelity.com; compiled by Author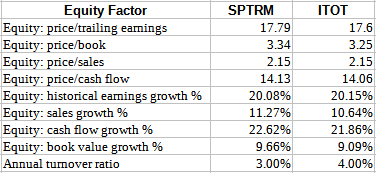
The following comparisons show ITOT could be described as SPTM+ as all but 11 of SPTM’s stocks are in ITOT. The extra 2100 stocks do not shift the sector allocations much.
ETFRC.com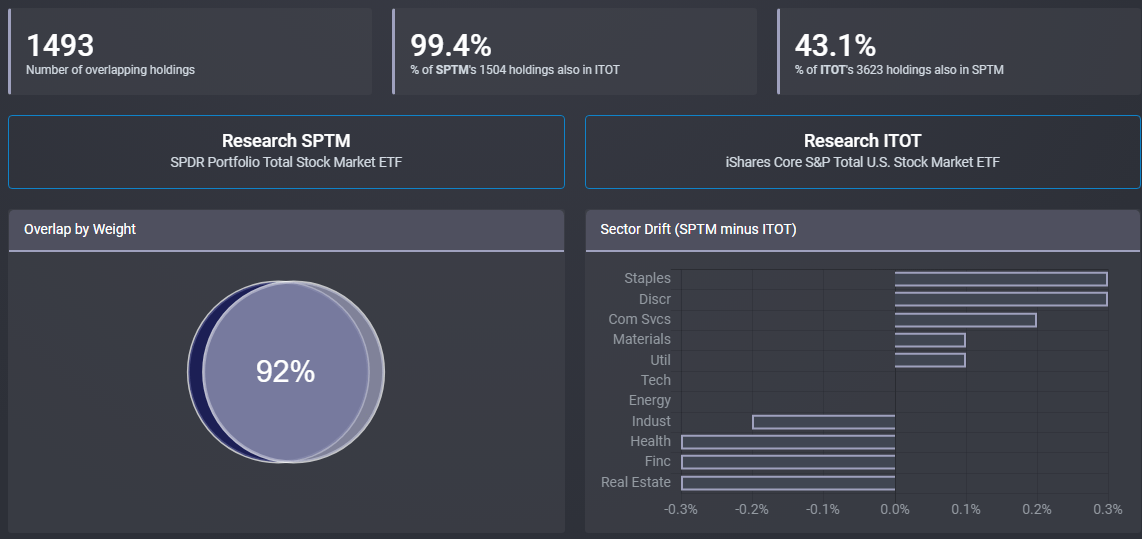
Nor does having twice the stocks alter the over/under weights on individual stocks much, with Apple at .5% being the largest difference.
ETFRC.com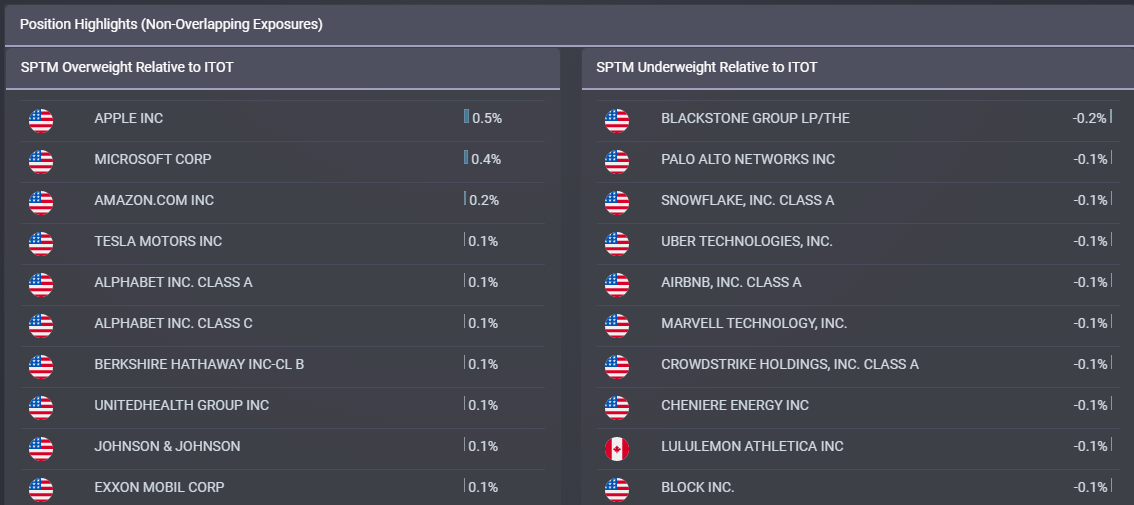
Here are how both ETFs rank/score within the Seeking Alpha universe:
seekingalpha.com; multiple homepages.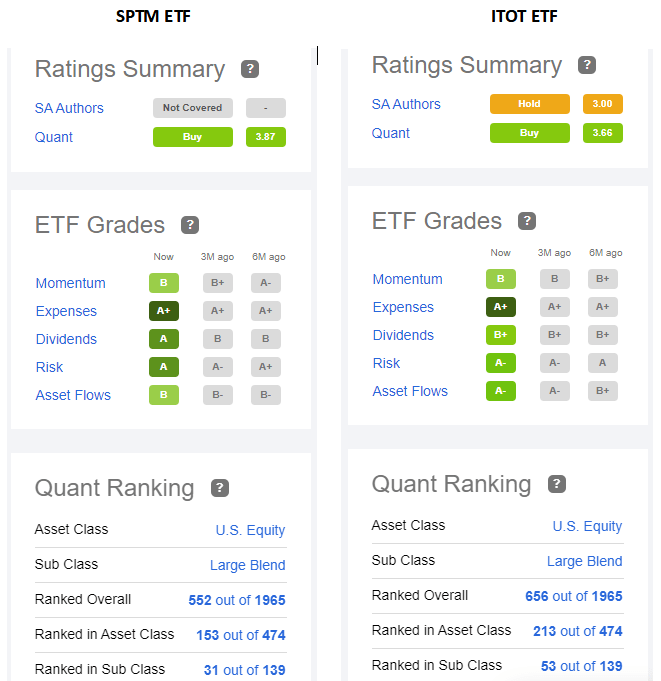
Seeking Alpha’s Quant ranking system prefers SPTM over ITOT.
Portfolio strategy
PortfolioVisualizer.com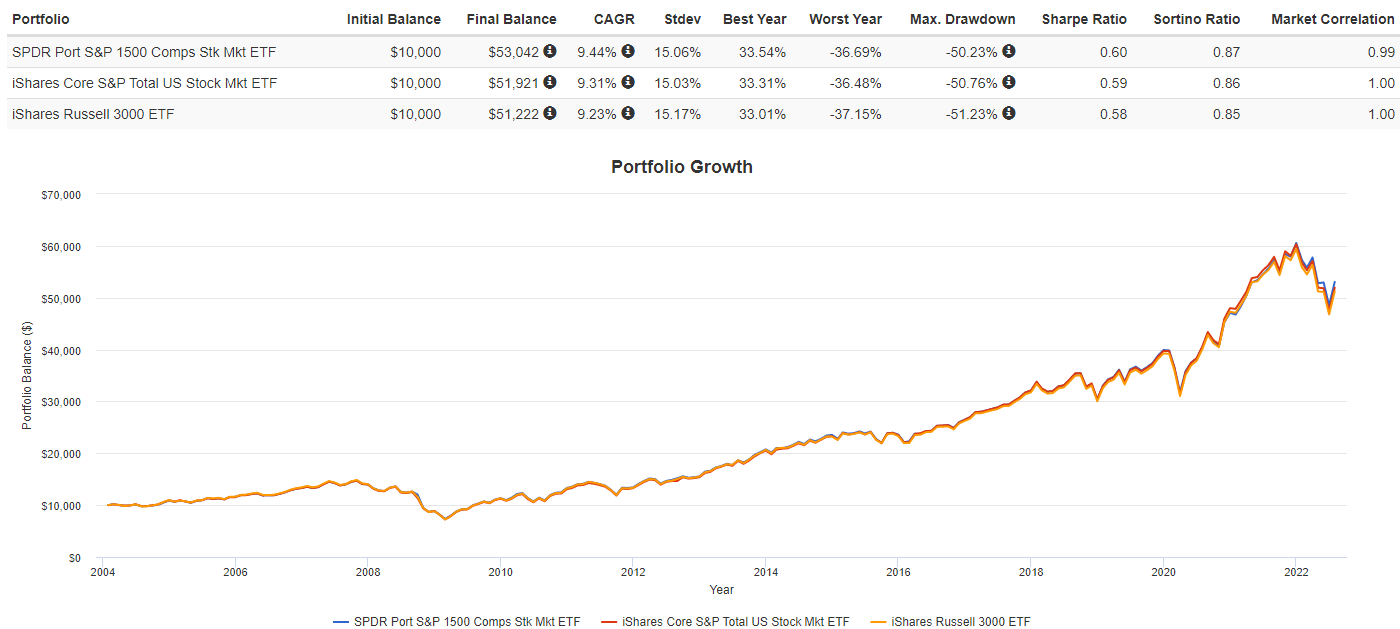
As promised, the above compares the two covered ETFs and includes a third popular one, the iShares Russell 3000 ETF. Basically, three peas in a pod. With CAGRs, risk ratios, and yield the very close, IWV is hurting itself by charging 20bps in fees, 17bps more than others for similar results. SA’s Quants rank IWV below the other two.
Does an investor need exposure to the extra 2100 stocks ITOT provides compared to SPTM? Consider this, the holdings listing for ITOT shows 1250 with a 0.00% holding, meaning each is under that level and they have a combined weight of 2% of the ETF.
Path forward
For investors looking for one ETF to cover the whole US equity market, I would consider any of the three to be a viable core holding, using other ETFs to adjust the overall allocation between size and/or growth/value stocks.
Be the first to comment