

S&P 500, VIX Index, Stock Sector Diversification, Macro – Talking Points
- The S&P 500 has 11 sectors to choose from to diversify stock portfolios
- Broadening exposure is not always perfect at avoiding market volatility
- What levels of VIX undermine this strategy and what can traders do?
What is Stock Sector Diversification?
If an investor wants to diversify exposure in the US stock market, there are plenty of sectors to choose from in the S&P 500. On the pie chart below, there are 11 to pick that range from growth-oriented information technology to value-centered industrial firms. To hedge against sector-specific risks, a trader could spread out their portfolio between some combination of these.
In such a case, if the S&P 500 hits a bump, losses in one corner of the market might be offset or be reduced by gains in another. This might work if all the sectors in the market are not falling in unison. However, when almost every corner of the index is declining in a binary move, a stock diversification strategy becomes increasingly unreliable.
This is not a case against a stock diversification strategy. Rather, this is analyzing conditions in the market that impact sectors moving together in the S&P 500. This is performed using the CBOE Volatility Index (VIX), also known as the market’s preferred ‘fear gauge’. With that in mind, what levels of VIX should traders and investors watch that risk undermining a stock diversification strategy?
S&P 500 Sector Breakdown
What is the VIX and Why Should Traders Watch it?
The VIX was created in 1990 to use as a benchmark for analyzing volatility projections in the US stock market. It trades in real-time, reflecting expectations of the price movement over the next 30 days. As such, it tends to have a very close inverse relationship with the S&P 500. In other words, as stocks fall, the VIX rises and vice versa. For a deeper dive into the VIX, check out a complete guide here.
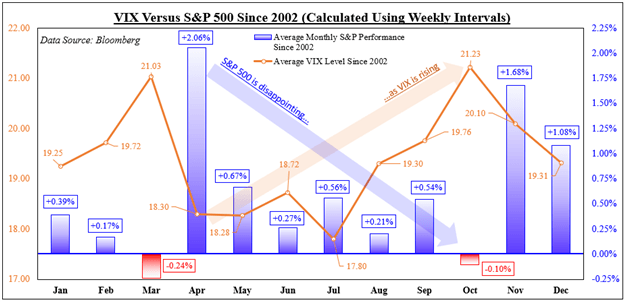
This inverse relationship can be seen in the next chart, which shows the average S&P 500 performance compared to equivalent VIX levels since 2002. For the study, average weekly data is used to calculate monthly outcomes. This is done so that it helps avoid truncating the ‘volatility of volatility’, whereas a monthly reading could run into the data failing to capture the broader trend.
Looking at the data, April tended to see the most optimistic performance for the S&P 500, averaging 2.06%. Afterwards, this performance tapered before bottoming in October, when the benchmark stock index returned about -0.1%. During this period, we saw the VIX climb, starting at 18.30 in April, then rising to 21.23 in October. Knowing this, we can now look at what happens within the S&P 500.
VIX Versus the S&P 500
S&P 500 Cross-Sector Correlations with the VIX
To see when a stock sector diversification strategy can fail, we will need dedicated price indices of the 11 sectors in the S&P 500. The data used for the latter only goes back to 2002. We can then find correlation levels between the VIX and for each sector using a one-month rolling basis. The correlations range between -1 and 1. A -1 reading means perfect inverse movements between two variables, while 1 is perfect unison.
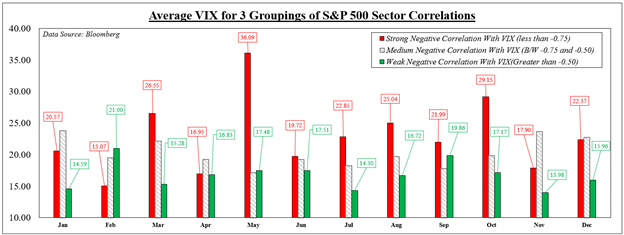
Averaging all 11 outcomes in each period offers a cross-sector correlation reading with the VIX. Next, the correlations are separated into groups ranging from strong (-1 to -0.75), medium (-0.75 and -0.50), and weak (all values greater than -0.5). A strong inverse reading reflects the VIX rising/falling as sectors dropped/climbed together with the most consistency. Weak ones represent sectors moving more freely.
In 7 out of 12 months, higher levels of VIX were associated with stronger cross-sector inverse correlations with the ‘fear gauge’. For example, the average weekly price of the VIX in March was 26.55 when the S&P sectors moved the most in unison. The price dropped to 15.28 when we saw sectors move more freely. Knowing this, what levels of VIX can undermine a cross-sector diversification strategy?
VIX Price Versus Different Levels of S&P Cross-Sector Inverse Correlations
When Can a Stock Sector Diversification Strategy Fail?
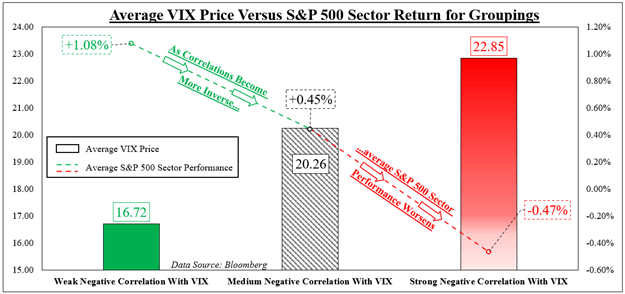
We can now average the prices of the VIX for all months and years since 2002 based on the 3 correlation groupings. Simultaneously, we will average the weekly performance of all the S&P sectors and align them based on the same categories. On the chart below, we can see that the outcome was fairly predictable. Stronger inverse correlations with the VIX aligned with increasingly worse performance between sectors.
When we saw all the sectors move the most opposite to the VIX, the average price of the ‘fear gauge’ was 22.85. When this occurred, the average return of each sector was -0.47%. Conversely, when the sectors moved more freely relative to the VIX, the price of the latter was 16.72. At that price, the average return between each sector was +1.08%.
It should be noted that correlation does not imply causation. Just because the VIX is at some arbitrary price does not mean that it is the sole cause of trading dynamics between sectors. Rather, it is being used here as a frame of reference. What actually causes markets to fall in binary moves is a combination of fundamental factors: monetary policy, fiscal spending, company guidance and more.
What Can Traders Do About Volatility?
Knowing this information, what can traders do when expecting high volatility and strong cross-correlations across market sectors? High bursts of volatility are often short-lived and temporary. During these times, haven-oriented assets tend to outperform. This includes the US Dollar, which often rises during times of global market stress. Short selling stocks is another. Scaling back exposure on current and new undertakings also help. Combining these could help prepare traders for some bumpy roads.
VIX Price Versus Performance of S&P 500 Sectors Based on Correlation Groupings
— Written by Daniel Dubrovsky, Strategist for DailyFX.com
To contact Daniel, use the comments section below or @ddubrovskyFX on Twitter
Be the first to comment