

cemagraphics
Author’s note: This article was released to CEF/ETF Income Laboratory members on October 25, 2022. Please check latest data before investing.
The Weekly Closed-End Fund Roundup will be put out at the start of each week to summarize recent price movements in closed-end fund [CEF] sectors in the last week, as well as to highlight recently concluded or upcoming corporate actions on CEFs, such as tender offers. Data is taken from the close of Friday, October 21st, 2022.
Weekly performance roundup
16 out of 23 sectors were positive on price (up from 0 last week) and the average price return was -1.45% (up from -2.98% last week). The lead gainer was Investment Grade (+7.96%) while California Munis lagged (-2.77%).
Income Lab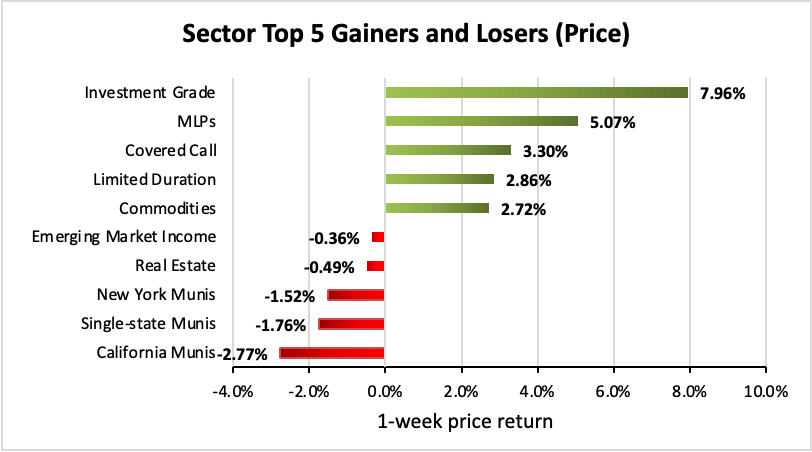
12 out of 23 sectors were positive on NAV (up from 0 last week), while the average NAV return was +0.78% (down from -2.07% last week). The top sector by NAV was Investment Grade (+8.45%) while the weakest sector by NAV was Taxable Munis (-2.73%).
Income Lab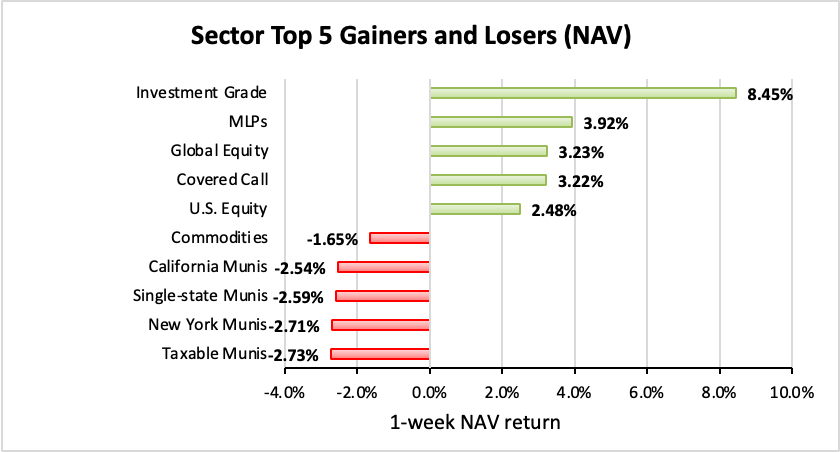
The sector with the highest premium was Taxable Munis (-1.08%), while the sector with the widest discount is Asia Equity (-15.39%). The average sector discount is -7.27% (up from -7.52% last week).
Income Lab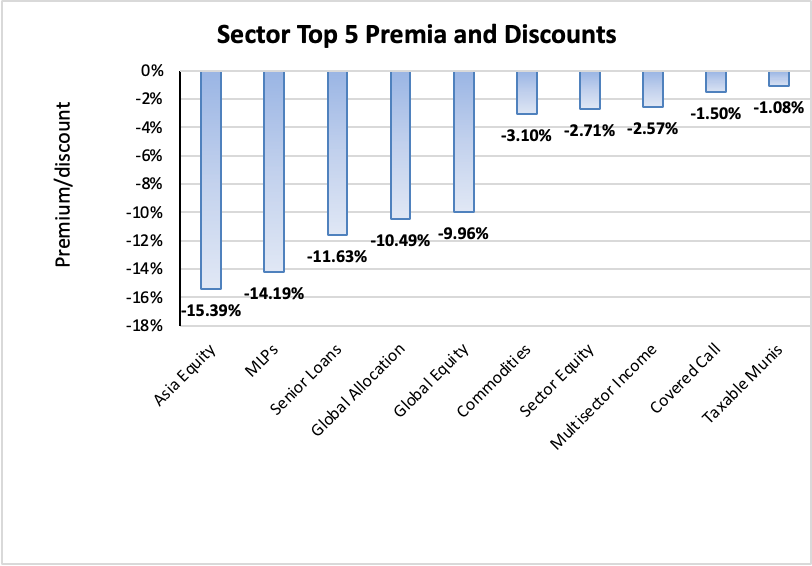
The sector with the highest premium/discount increase was Taxable Munis (+3.77%), while U.S. Equity (-1.64%) showed the lowest premium/discount decline. The average change in premium/discount was +0.25% (down from +0.75% last week).
Income Lab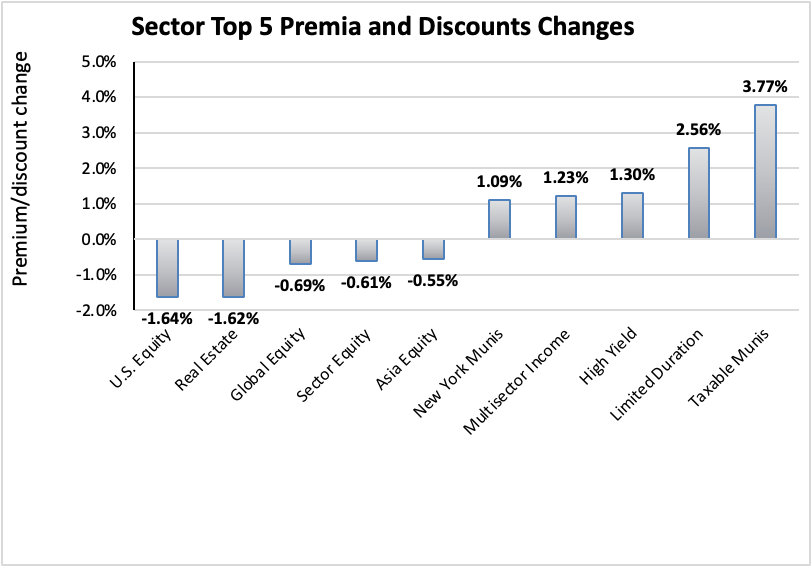
The sector with the highest average 1-year z-score is MLPs (+0.72), while the sector with the lowest average 1-year z-score is Asia Equity (-1.53). The average z-score is -0.80 (up from -0.94 last week).
Income Lab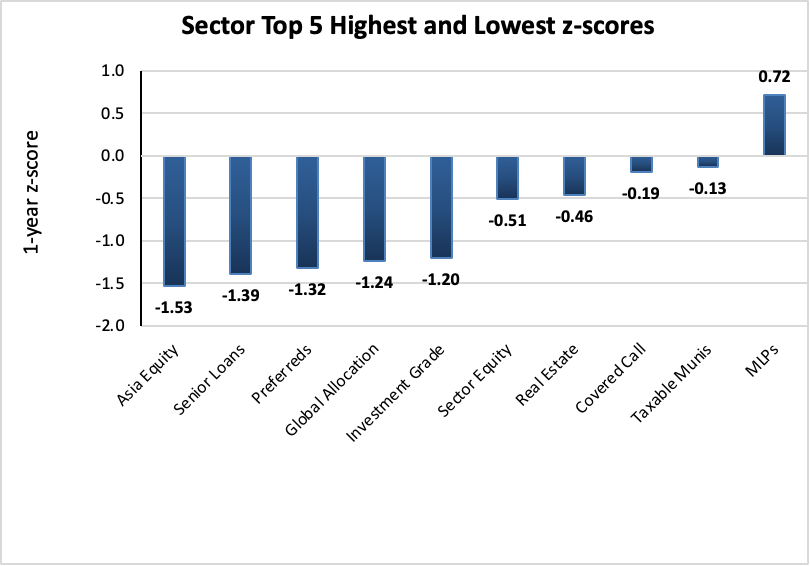
The sectors with the highest yields are Asia Equity (16.37%), Global Equity (13.32%), and Global Allocation (12.87%). Discounts are included for comparison. The average sector yield is 9.37% (up from 9.14% last week).
Income Lab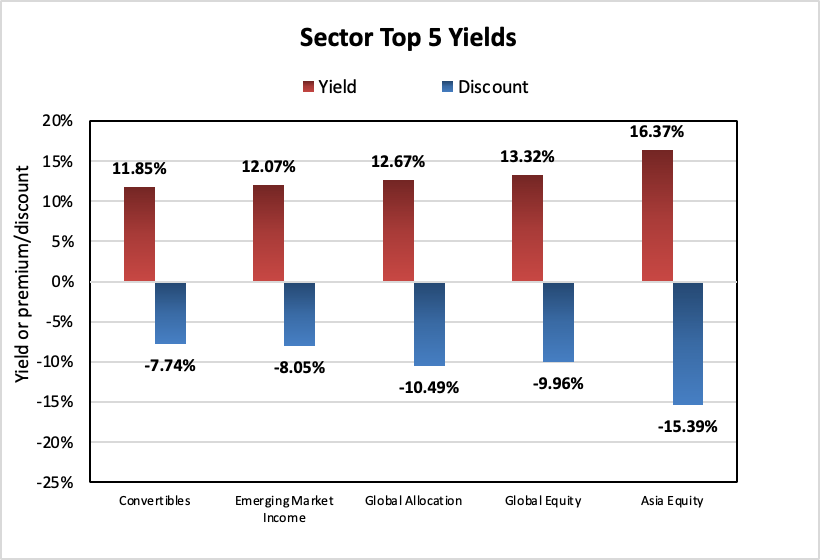
Individual CEFs that have undergone a significant decrease in premium/discount value over the past week, coupled optionally with an increasing NAV trend, a negative z-score, and/or are trading at a discount, are potential buy candidates.
| Fund | Ticker | P/D decrease | Yield | P/D | z-score | Price change | NAV change |
| Nuveen Core Equity Alpha | (JCE) | -14.69% | 24.13% | 2.64% | 0.4 | -10.05% | -4.04% |
| Gabelli Multi-Media | (GGT) | -13.96% | 14.72% | 55.73% | 1.4 | -2.92% | 5.79% |
| John Hancock Hedged Equity & Income Fund | (HEQ) | -11.00% | 10.54% | -0.81% | -0.6 | -7.32% | 2.97% |
| Cornerstone Total Return Fund | (CRF) | -9.92% | 28.35% | 12.58% | -1.8 | -3.67% | 4.82% |
| Gabelli Conv Inc Secs | (GCV) | -9.31% | 9.62% | 18.81% | 0.9 | -4.77% | 2.69% |
| Eagle Point Income Co Inc | (EIC) | -7.61% | 11.66% | 11.56% | 0.9 | -5.20% | 0.00% |
| Gabelli Global Utility & Income | (GLU) | -6.75% | 8.84% | -2.44% | -0.1 | -3.07% | 3.65% |
| Cohen & Steers Total Return | (RFI) | -6.54% | 8.16% | 4.16% | -0.1 | -4.31% | 1.71% |
| Madison Covered Call & Eq Strat | (MCN) | -4.18% | 10.18% | 3.82% | 0.0 | 0.86% | 4.93% |
| Virtus Stone Harbor Emg Mkts Total Inc | (EDI) | -4.07% | 21.93% | -9.88% | -2.5 | -5.43% | -1.16% |
Income Lab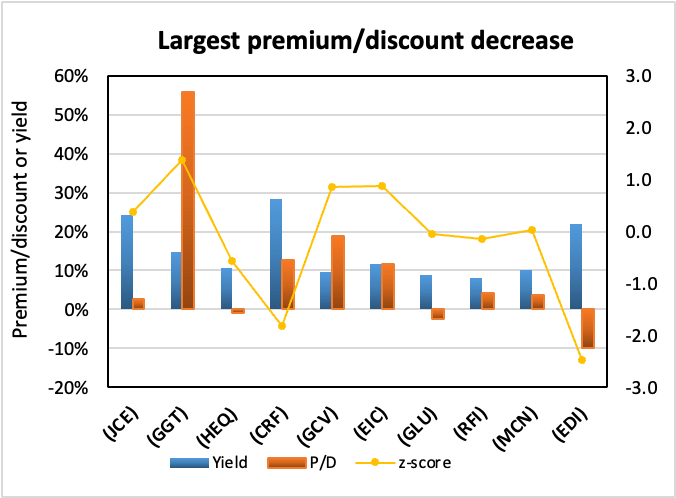
Conversely, individual CEFs that have undergone a significant increase in premium/discount value in the past week, coupled optionally with a decreasing NAV trend, a positive z-score, and/or are trading at a premium, are potential sell candidates.
| Fund | Ticker | P/D increase | Yield | P/D | z-score | Price change | NAV change |
| Nuveen MO Quality Muni Inc | (NOM) | 5.85% | 3.14% | 14.42% | 2.8 | 2.69% | -2.55% |
| Doubleline Opportunistic Cred | (DBL) | 5.32% | 9.03% | 2.24% | 1.8 | 5.10% | -0.35% |
| European Equity Fund | (EEA) | 5.27% | 21.91% | -14.69% | -0.1 | 8.53% | 1.84% |
| Templeton Emerg Mkts Income | (TEI) | 5.23% | 11.79% | -5.11% | 0.8 | 4.98% | -0.81% |
| The Central and Eastern Europe Fund | (XCEEX) | 5.04% | 14.55% | 16.96% | -0.1 | 7.38% | 2.75% |
| Eaton Vance Short Duration Divers Inc | (EVG) | 4.90% | 9.95% | 1.45% | 1.1 | 4.05% | -0.95% |
| Putnam Muni Opportunities | (PMO) | 4.72% | 6.30% | -0.88% | 0.1 | 1.50% | -3.31% |
| New Ireland | (IRL) | 4.44% | 32.14% | -14.46% | -0.5 | 8.07% | 2.47% |
| Guggenheim Tax Muni & Inv Grade Debt Tr | (GBAB) | 4.43% | 9.91% | -0.26% | -0.2 | 2.15% | -2.37% |
| BlackRock Taxable Municipal Bond Trust | (BBN) | 4.36% | 9.06% | -0.31% | 0.2 | 1.62% | -2.80% |
Income Lab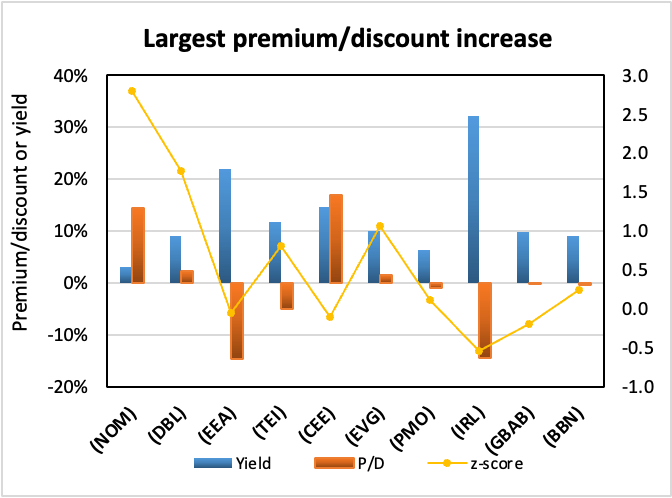
Recent corporate actions
These are from the past month. Any new news in the past week has a bolded date:
October 14, 2022 | BlackRock Corporate High Yield Fund, Inc. Announces Results of Its Rights Offering.
September 27, 2022 | RiverNorth/DoubleLine Strategic Opportunity Fund, Inc. Announces Final Results of Rights Offering.
September 26, 2022 | RiverNorth/DoubleLine Strategic Opportunity Fund, Inc. Announces Preliminary Results of Rights Offering.
September 19, 2022 | Virtus Total Return Fund Inc. Completes Rights Offering.
Upcoming corporate actions
These are from the past month. Any new news in the past week has a bolded date:
October 4, 2022 | RiverNorth Opportunities Fund, Inc. Announces Transferable Rights Offering.
October 3, 2022 | Tortoise Announces Tender Offers for its Closed-End Funds.
September 20, 2022 | First Trust/abrdn Emerging Opportunity Fund Announces Approval of Liquidation.
August 11, 2022 | Abrdn’s U.S. Closed-End Funds Announce Special Shareholder Meetings Relating to Proposed Acquisition of Assets of Four Delaware Management Company-Advised Closed-End Funds.
Recent activist or other CEF news
These are from the past month. Any new news in the past week has a bolded date:
October 21, 2022 | The Cushing® NextGen Infrastructure Income Fund Announces Name Change.
October 5, 2022 | BlackRock Closed-End Fund Share Repurchase Program Update. October 3, 2022 | Virtus Convertible & Income Fund, Virtus Convertible & Income Fund II Commence Tender Offers for Outstanding Auction Rate Preferred Shares.
October 3, 2022 | Virtus Convertible & Income Fund II Postpones Monthly Distribution on Common Shares.
————————————
Distribution changes announced this month
These are sorted in ascending order of distribution change percentage. Funds with distribution changes announced this month are included. Any distribution declarations made this week are in bold. I’ve also added monthly/quarterly information as well as yield, coverage (after the boost/cut), discount and 1-year z-score information. I’ve separated the funds into two sub-categories, cutters and boosters.
Cutters
Income Lab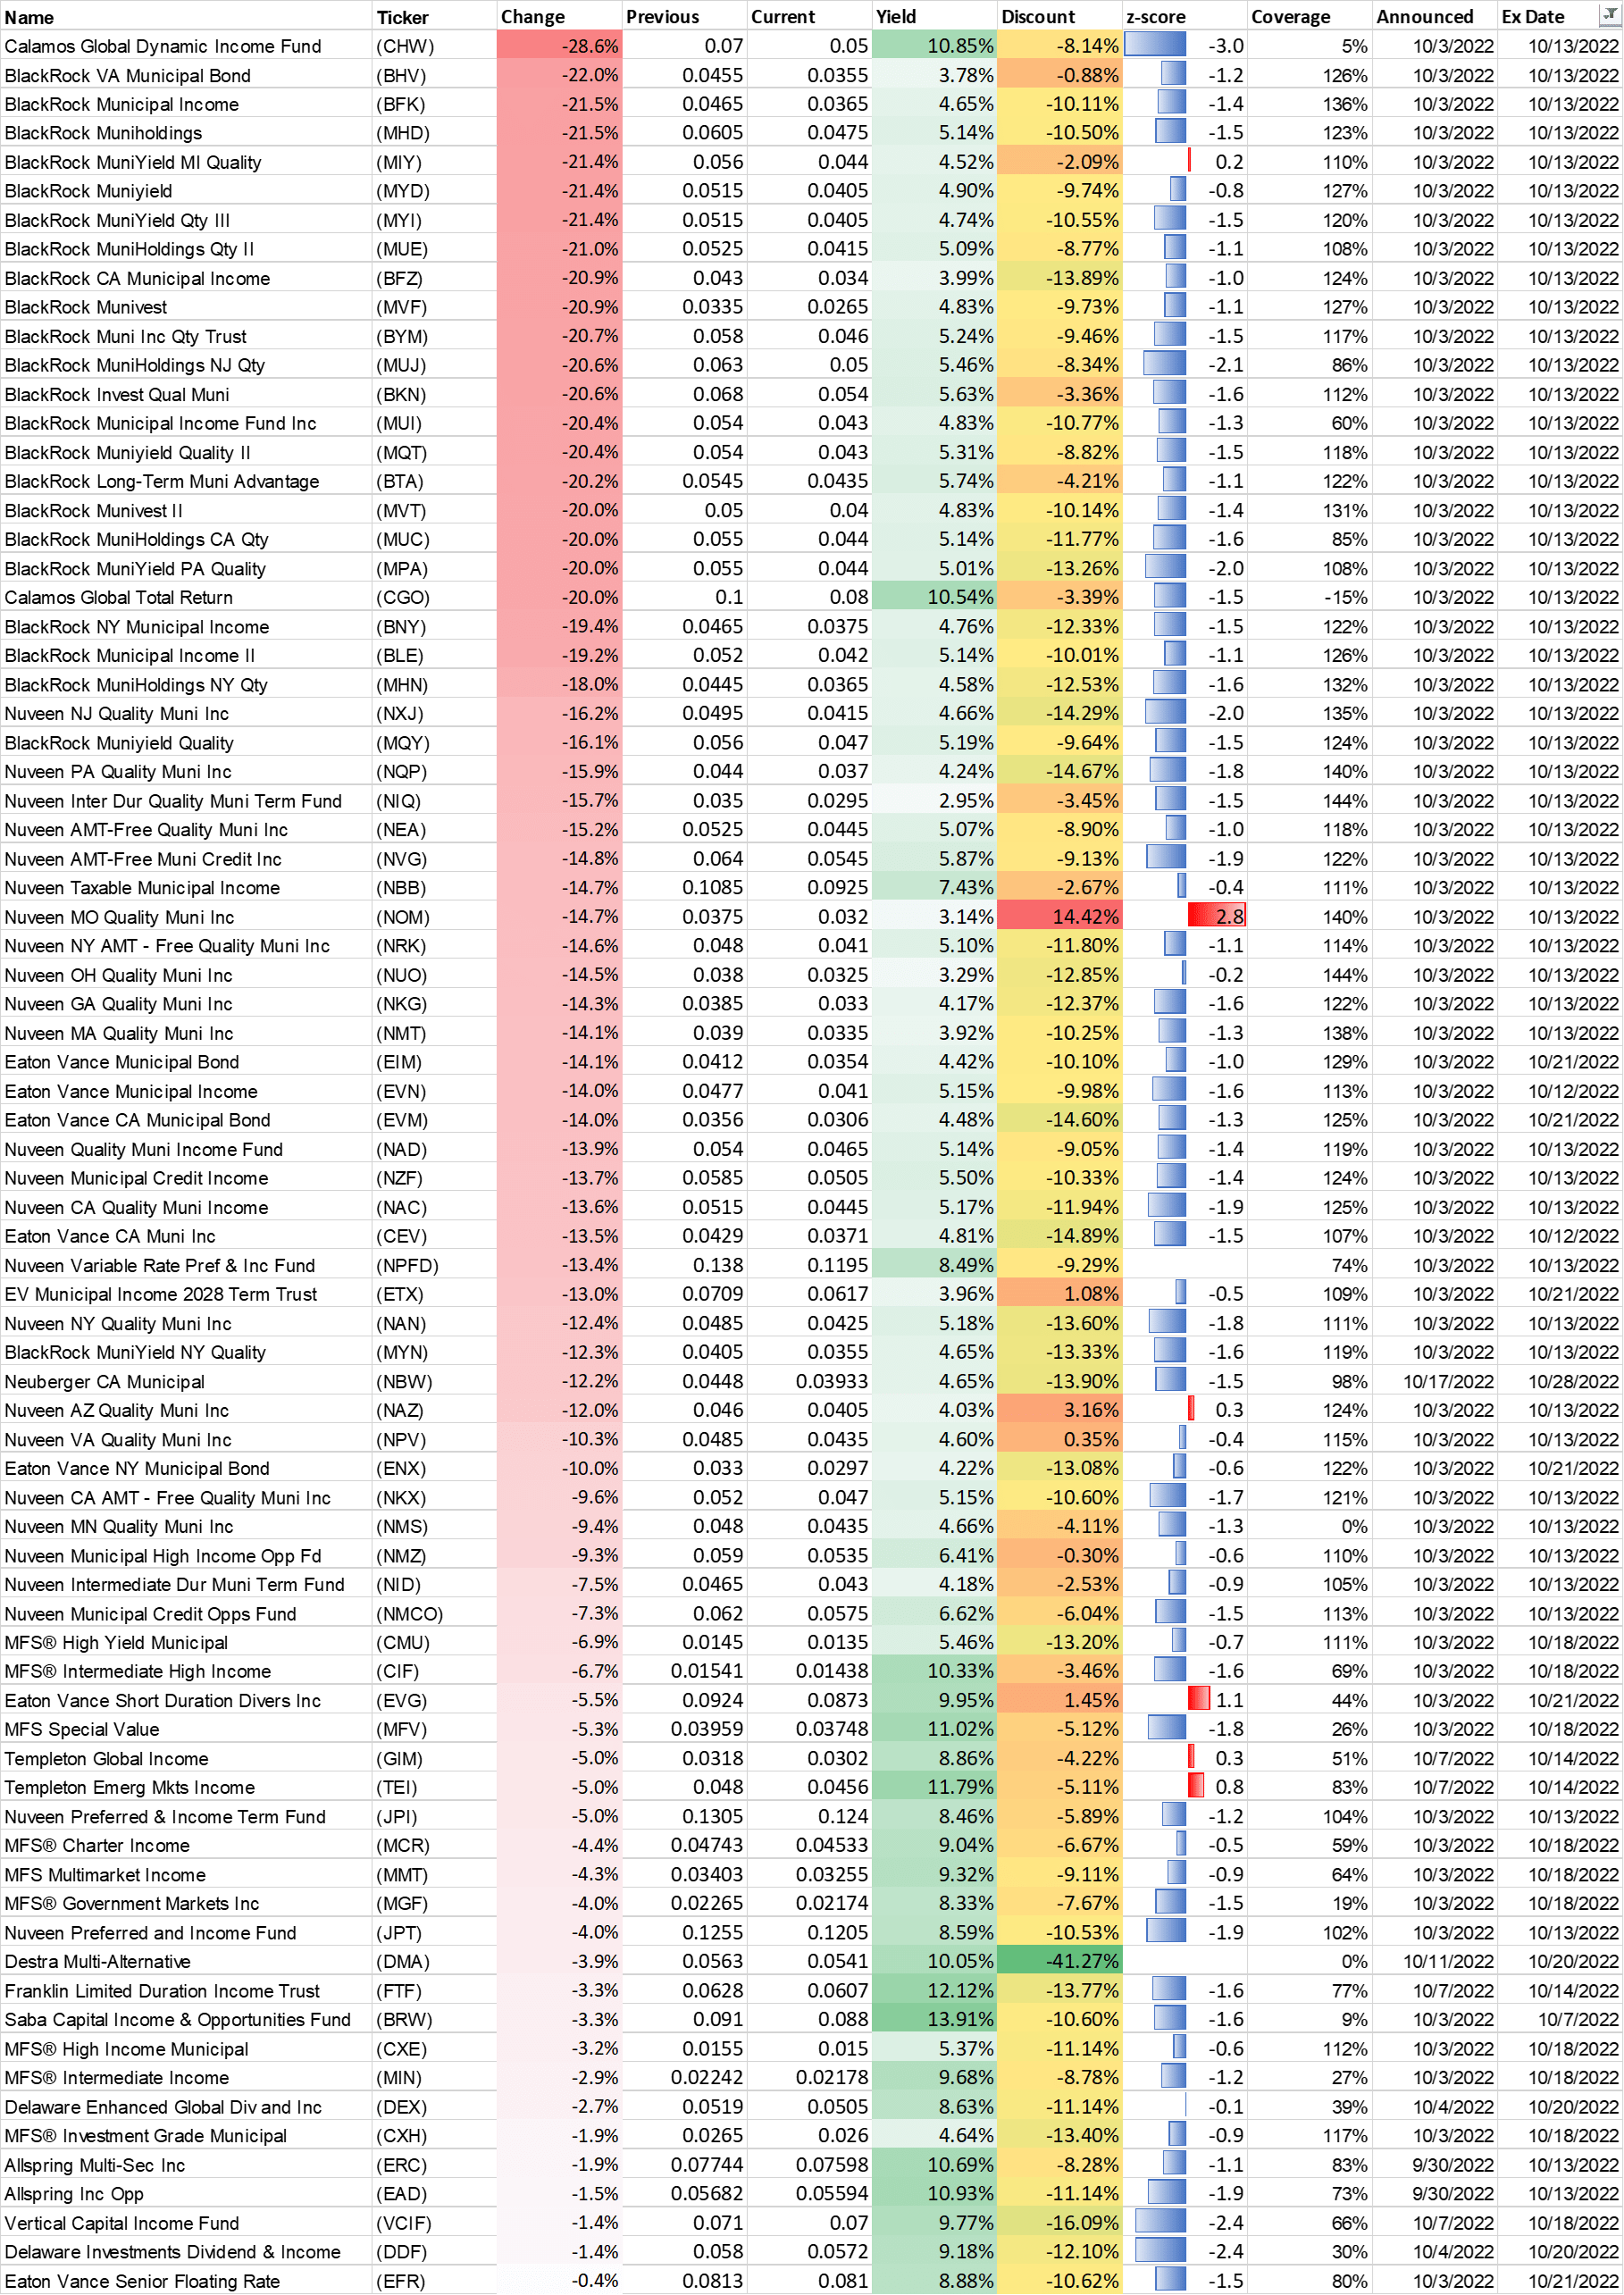
Boosters
Income Lab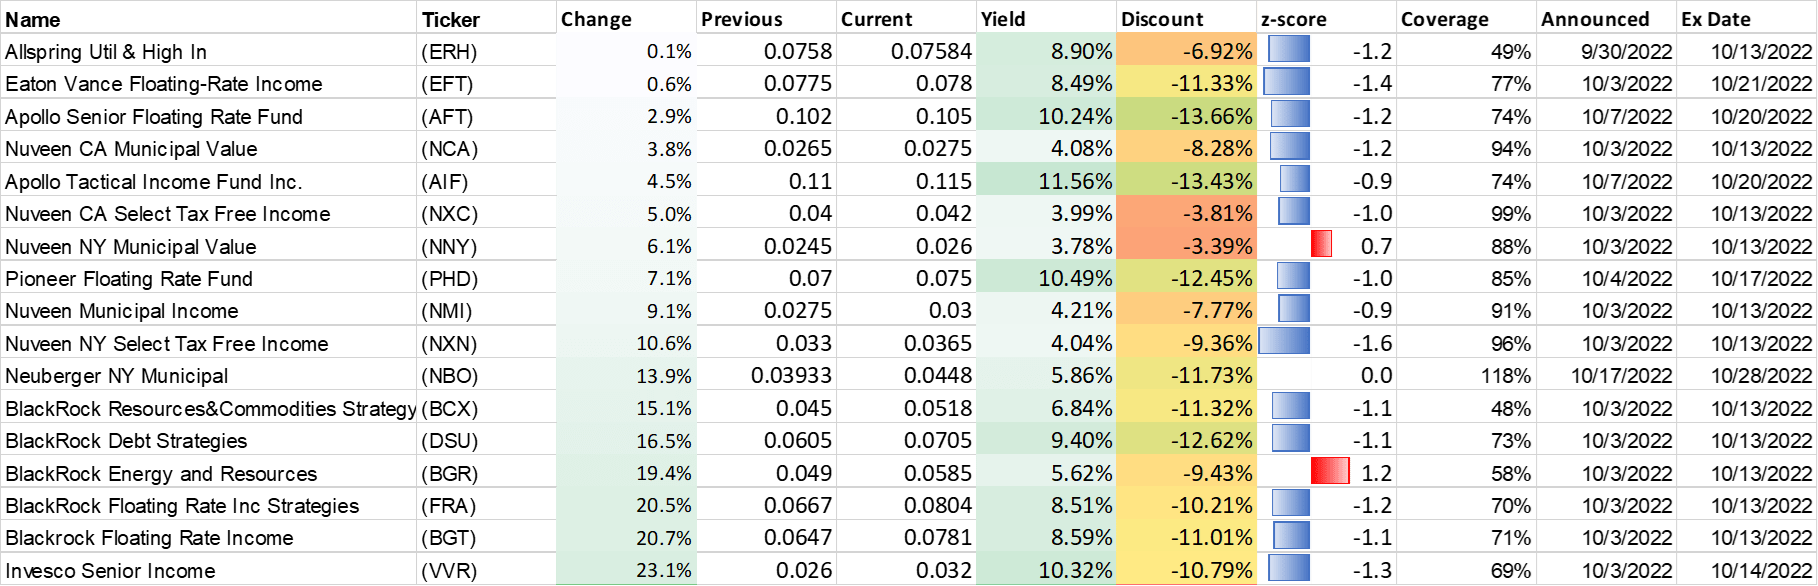
Strategy Statement
Our goal at the CEF/ETF Income Laboratory is to provide consistent income with enhanced total returns. We achieve this by:
- (1) Identifying the most profitable CEF and ETF opportunities.
- (2) Avoiding mismanaged or overpriced funds that can sink your portfolio.
- (3) Employing our unique CEF rotation strategy to “double compound“ your income.
It’s the combination of these factors that has allowed our Income Generator portfolio to massively outperform our fund-of-CEFs benchmark ETF (YYY) whilst providing growing income, too (approx. 10% CAGR).
Income Lab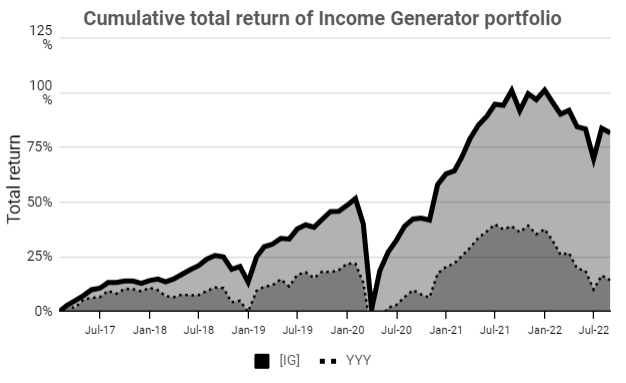
Remember, it’s really easy to put together a high-yielding CEF portfolio, but to do so profitably is another matter!
Be the first to comment