

Sundry Photography
Zoom Video Communications (NASDAQ:ZM) reported Q3 results after the market close on Monday, November 21st, beating expectations on earnings and meeting expectations for revenue. ZM managed to grow its enterprise user base by 209,000 as compared to Q3 of the previous year. Revenue rose 5% YoY, diminished by variations in foreign exchange rates. Adjusting for the impacts of currency fluctuation, revenue rose 7% YoY. EPS was, however, slightly lower than for Q3 of the last fiscal year. Increases in spending on research and development, sales and marketing, and general and administrative (G&A) contributed to reduced earnings. ZM shares have fallen about 4% on Tuesday in response to the Q3 report. While CEO Eric Yuan heralded the addition of email and calendar functions to Zoom, these don’t seem to reach the level of “innovations” (to quote Mr. Yuan) and there is little reason to expect that these additions to the platform will meaningfully contribute to growth. The overall outlook is muted.
Seeking Alpha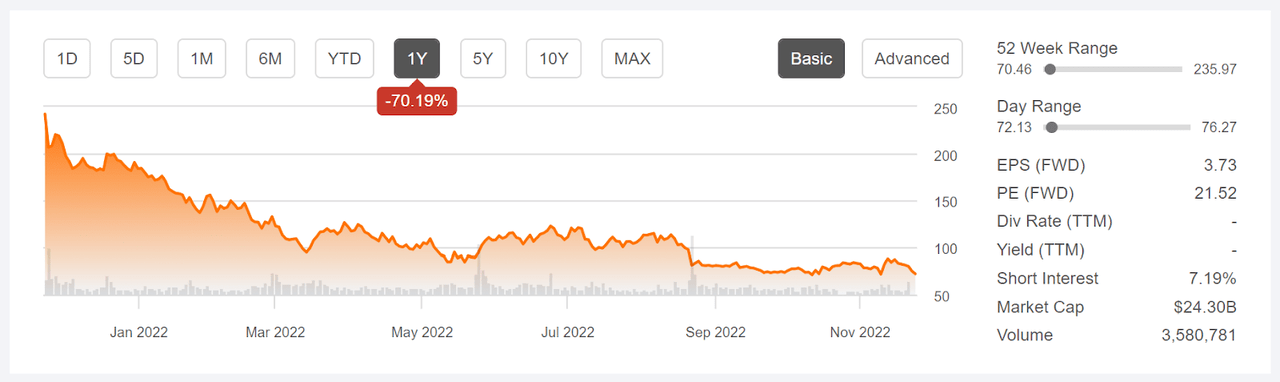
12-Month price history and basic statistics for ZM (Source: Seeking Alpha)
ZM has fallen about 70% over the past 12 months and has a trailing 3-year annualized return below 5%, roughly half that of the S&P 500 (SPY), and well below half the total return for QQQ over the same period.
Looking at a chart of historical and expected future earnings tells the story of ZM’s situation very clearly. After enjoying very rapid growth during 2020 and into 2021 because of the COVID-driven shift to working from home, earnings have inevitably flattened out and are expected to decline in the coming quarters. The company’s longer-term prospects are decent, with a consensus expectation for 14.5% per year in EPS growth over the next 3 to 5 years, but the near term outlook is for continued declines.
ETrade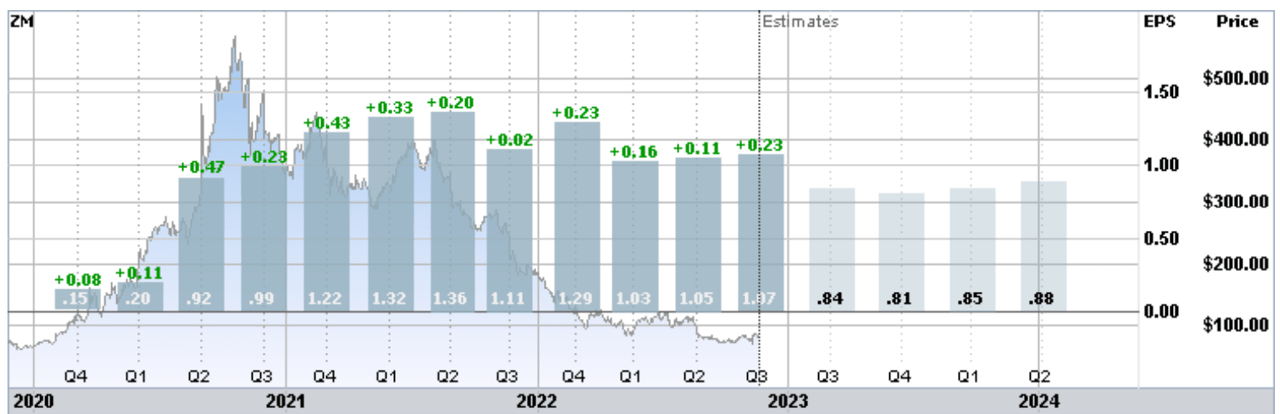
Trailing (3 years) and estimated future quarterly EPS for ZM. Green values are amounts by which EPS beat the consensus expectation (Source: ETrade)
I last wrote about ZM on November 29, 2021, very close to a year ago, at which time I maintained a hold rating on the stock. The Wall Street consensus rating was a buy, with a 12-month price target that was about 40% above the share price at that time. There was, however, a large spread in the price targets from individual analysts. By contrast to the Wall Street consensus, the outlook reflected in options prices was substantially bearish. The market-implied outlook is a probabilistic price forecast calculated from the prices of put and call options on a stock, and represents the consensus view among buyers and sellers of options. The market-implied outlook started 2022 neutral, growing increasingly bearish as the year progressed. Given the bullish Wall Street outlook, with high expected gains, and the bearish view from the options market, I compromised by maintaining a hold rating on ZM.
Seeking Alpha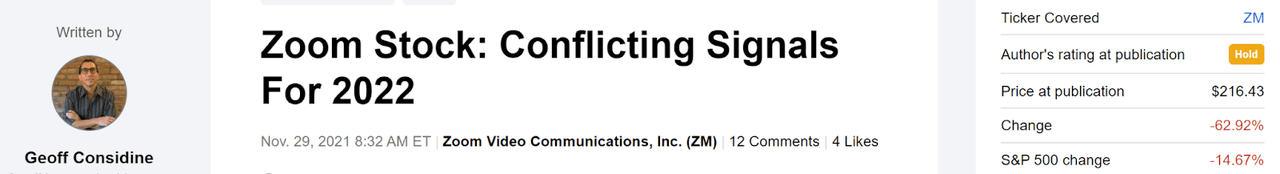
Previous post on ZM and subsequent performance vs. the S&P 500 (Source: Seeking Alpha)
In retrospect, I should have put more weight on the market-implied outlook, given that the dispersion among the individual analyst price targets was so high. Research has shown that the predictive value of the Wall Street consensus price target declines as the spread among the individual price targets increase. As a rule of thumb, I discount the consensus outlook when the ratio of the largest and smallest price targets exceeds a value of 2. The ratio for ZM as of this post was 1.9 from ETrade’s version of the Wall Street consensus outlook and 2.0 from Seeking Alpha’s version.
For readers who are unfamiliar with the market-implied outlook, a brief explanation is needed. The price of an option on a stock is largely determined by the market’s consensus estimate of the probability that the stock price will rise above (call option) or fall below (put option) a specific level (the option strike price) between now and when the option expires. By analyzing the prices of call and put options at a range of strike prices, all with the same expiration date, it is possible to calculate a probabilistic price forecast that reconciles the options prices. This is the market-implied outlook. For a deeper explanation and background, I recommend this monograph published by the CFA Institute.
With about a year since my last analysis and the just-released Q3 results, I have calculated updated market-implied outlooks for ZM through 2024 and I have compared these with the current Wall Street consensus outlook in reconsidering my rating.
Wall Street Consensus Outlook for ZM
ETrade calculates the Wall Street consensus outlook for ZM using price targets and ratings from 24 ranked analysts who have published their views over the past 3 months. The consensus rating is a hold, having shifted from a buy in late September, and the consensus 12-month price target is 17.9% above the current share price. What is perhaps most surprising in looking at these results is how long it took the consensus rating to shift from a buy to as hold as the shares plummeted in 2022.
ETrade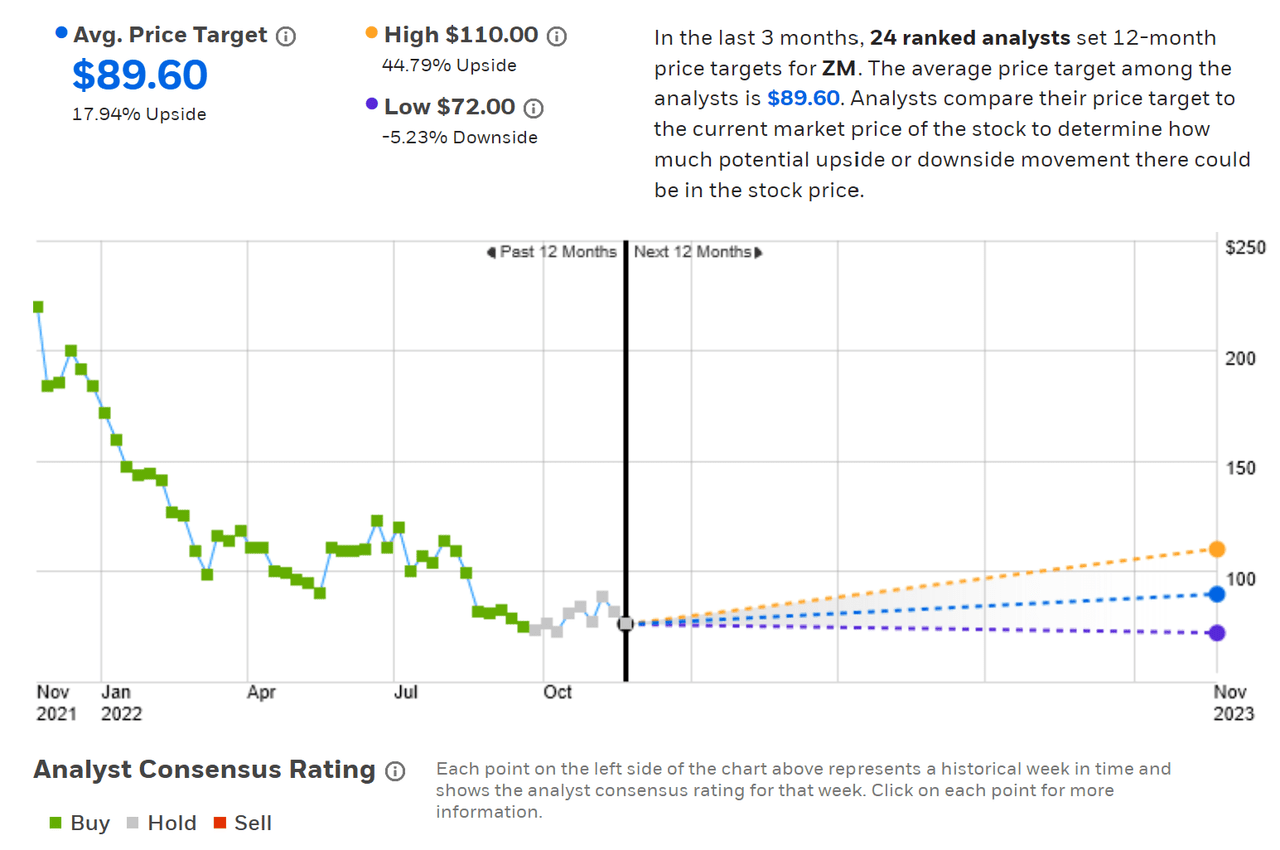
Wall Street analyst consensus rating and 12-month price target for ZM (Source: ETrade)
Seeking Alpha’s version of the Wall Street consensus outlook is based on ratings and price targets from 32 analysts who have published views in the last 90 days. The results are very similar to those from ETrade, with a hold rating (downgraded from a buy in September) and a consensus price target that is 22.6% above the current share price.
Seeking Alpha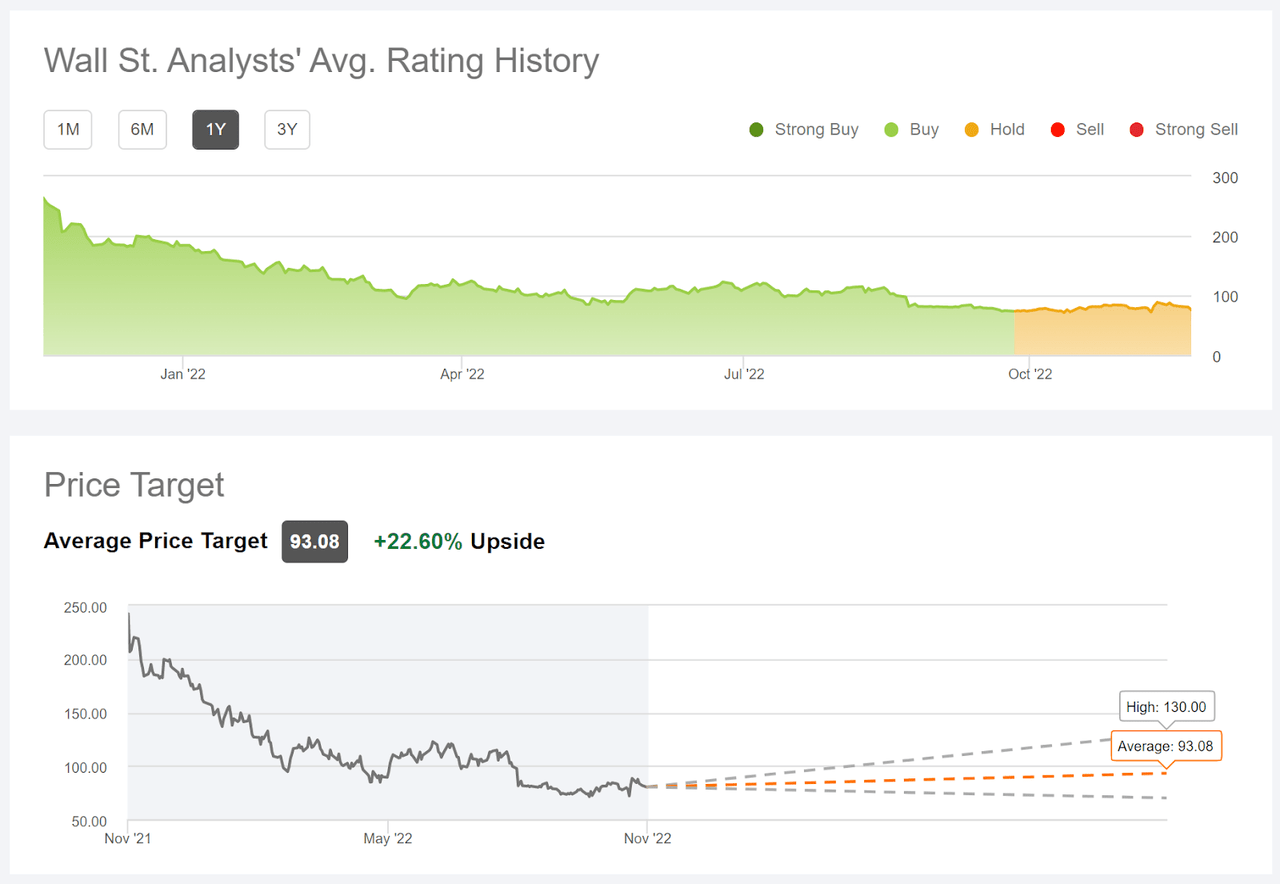
Wall Street analyst consensus rating and 12-month price target for ZM (Source: Seeking Alpha)
Even taking the Wall Street consensus outlook at face value, the question is whether an expected return of 18%-23% justifies the risk level of this stock.
Market-Implied Outlook for ZM
I have calculated market-implied outlooks for ZM for the 6.8-month period from now until June 16, 2023 and for the 13.9-month period from now until January 19, 2024, using the price of call and put options that expire on these dates. I selected these two expiration dates to provide a view to the middle of 2023 and through the end of 2023.
The standard presentation of the market-implied outlook is a probability distribution of price return, with probability on the vertical axis and return on the horizontal.
Geoff Considine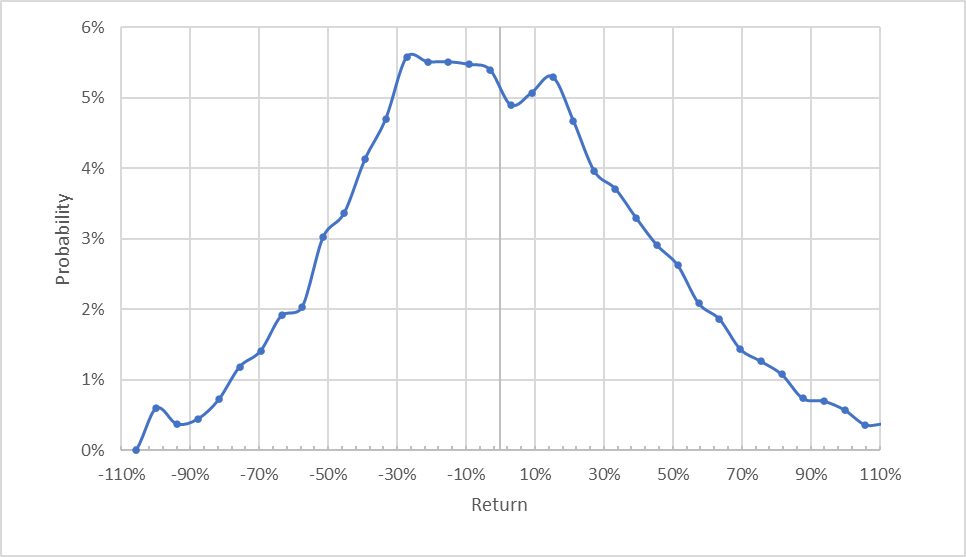
Market-implied price return probabilities for ZM for the 6.8-month period from now until June 16, 2023 (Source: Author’s calculations using options quotes from ETrade)
The market-implied outlook to the middle of 2023 has the maximum probabilities tilted to favor negative returns. Compare the probabilities of returns in the range from 0% to +30% to those in the range from 0% to -30%. The expected volatility calculated from this distribution is 61% (annualized).
To make it easier to compare the relative probabilities of positive and negative returns, I rotate the negative return side of the distribution about the vertical axis (see chart below).
Geoff Considine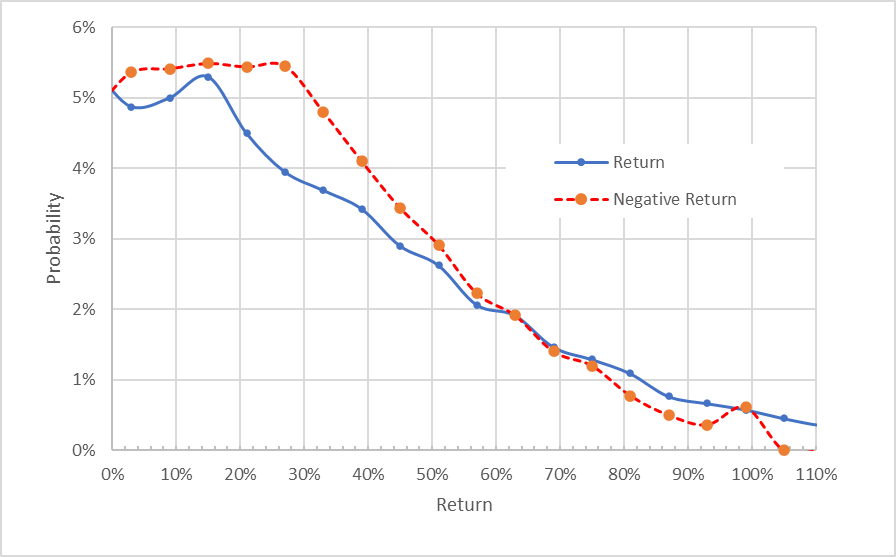
Market-implied price return probabilities for ZM for the 6.8-month period from now until June 16, 2023. The negative return side of the distribution has been rotated about the vertical axis (Source: Author’s calculations using options quotes from ETrade)
This view really illustrates how much higher the probabilities of negative returns are than the probabilities of positive returns, across a wide range of the most-probable outcomes (the dashed red line is above the solid blue line over the left ½ of the chart above). The probabilities of positive returns of very large magnitude are higher than for comparable negative returns, but these outcomes occur with low overall probability.
Theory indicates that the market-implied outlook is expected to have a negative bias because investors, in aggregate, are risk averse and thus tend to pay more than fair value for downside protection. There is no way to measure the magnitude of this bias, or whether it is even present, however. Even considering this potential bias, based on the array of results that I have generated for different stocks, I interpret this market-implied outlook is bearish.
The market-implied outlook for ZM for the 13.9-month period to January 19, 2024 is more bearish than the outlook to mid-2023. The maximum probability corresponds to a price return of about -30% over this period and the expected volatility is 61% (annualized). The secondary peak corresponding to a return of -100% represents the estimated probability of a complete loss, but this situation is not meaningfully estimated using the market-implied outlook (see the CFA monograph for an explanation of why the estimates of the extreme tails of these outlooks are questionable).
Geoff Considine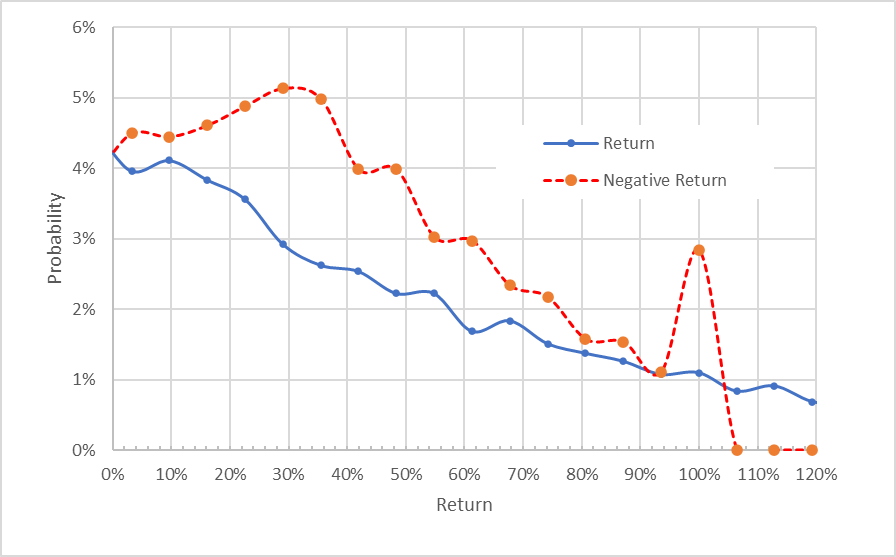
Market-implied price return probabilities for ZM for the 13.9-month period from now until January 19, 2024. The negative return side of the distribution has been rotated about the vertical axis (Source: Author’s calculations using options quotes from ETrade)
In summary, the market-implied outlooks to the middle of 2023 and into the start of 2024 are bearish. The bearishness (as reflected in the spread between the probabilities of positive and negative returns) is more pronounced for the longer-term view. Interestingly, the expected volatility of about 60% is generally comparable to the expected values calculated back in November of 2021.
Summary
ZM reported decent Q3 results, with revenues in line with expectations and earnings above expectations. The shares fell about 4% for the day following this report. While ZM grew spectacularly during the COVID-driven shift to working from home, earnings have been in decline in recent quarters. The consensus outlook for earnings indicates further reductions in earnings as the company attempts to build channels that will support higher post-COVID growth. The prevailing view among Wall Street analysts remained bullish, even as the share price collapsed, before finally shifting to a neutral view in September. The consensus 12-month price target implies returns in the range of 18% to 23% over the next year. As a rule of thumb for a buy rating, I want to see an expected 12-month return that is at least ½ the expected volatility (60%). Even using the high range of the consensus price target, ZM is well below this threshold. The expected return does not justify the risk. The market-implied outlook for ZM is bearish to the middle of 2023 and to the start of 2024. I am changing my rating on ZM to a sell.
Be the first to comment