

Neilson Barnard/Getty Images Entertainment
Waste Connections (NYSE:WCN) is the third largest solid waste company in North America. Waste Connections differs from its competitors by focusing on secondary markets, i.e. not direct large urban centers, as well as markets where they can be the exclusive provider or at least gain a larger portion of the local market share.
Waste Connections provides waste collection, transfer, disposal and recycling services across both the United States and Canada. Waste Connections serves over 6 million commercial, industrial, and residential customers in its service areas which speaks to how fragmented the industry is.
WCN Locations (WCN Investor Presentation May 2022)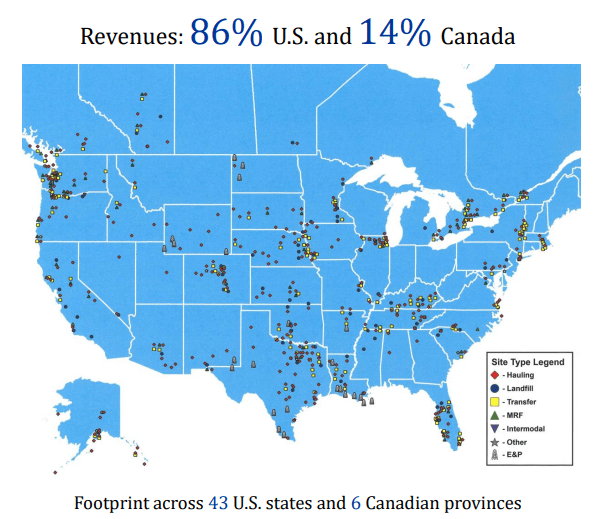
Waste removal and disposal is one of those critical, yet boring and often overlooked businesses. I can tell you I’ve never espoused the virtues of my local trash collector which reinforces the fact that the business is an under-the-radar investment.
WCN Capital Allocation (WCN Investor Presentation May 2022)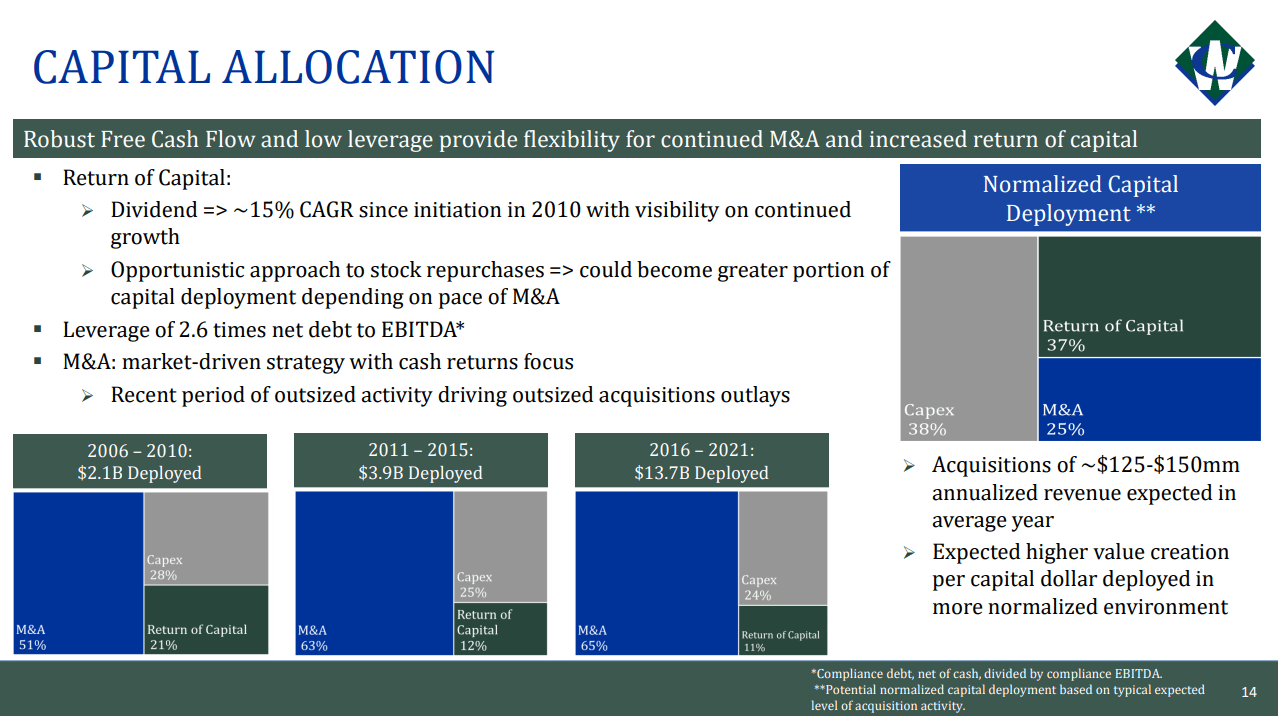
Waste Connections has been quite aggressive on the M&A front, especially so over the 2016-2021 period. However, moving forward management appears to be preparing for share buybacks to be a larger potential source of capital return.
I’m intrigued by Waste Connections and would love to add another trash company to my portfolio so it was time to take a deeper look to see if now might be the right time to pick up some shares.
Dividend History
A dividend payment is one of my favorite ways that a company can show that it’s doing well and while rewarding shareholders. Even better is a company that can consistently increase that dividend as well.
Waste Connections Dividend History (WCN Investor Relations)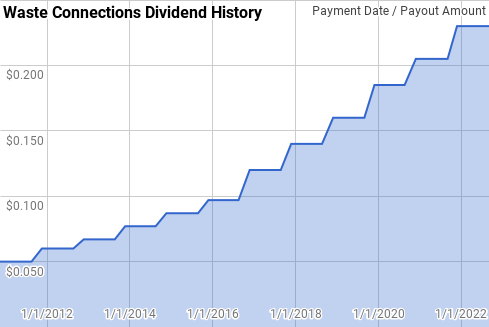
Waste Connections’ dividend growth streak is 12 years old giving them the title of Dividend Contender. While their streak is still pretty young compared to the other trash companies, the dividend raises have been spectacular.
During Waste Connections’ streak, year over year dividend growth has ranged from 5.0% to 21.7% with an average of 14.1% and a median of 14.4%.
There’s been 7 rolling 5-year periods during that time with annualized dividend growth spanning between 12.3% and 16.2% with an average of 15.1% and a median of 15.5%.
The rolling 1-, 3-, 5-, and 10-year annualized dividend growth rates from Waste Connections since 2010 can be found in the following table.
| Year | Annual Dividend | 1 Year | 3 Year | 5 Year | 10 Year |
| 2010 | $0.050 | ||||
| 2011 | $0.210 | 5.00% | |||
| 2012 | $0.247 | 17.62% | |||
| 2013 | $0.278 | 12.55% | 11.60% | ||
| 2014 | $0.318 | 14.39% | 14.83% | ||
| 2015 | $0.358 | 12.58% | 13.17% | 12.35% | |
| 2016 | $0.411 | 14.80% | 13.92% | 14.37% | |
| 2017 | $0.500 | 21.65% | 16.28% | 15.15% | |
| 2018 | $0.580 | 16.00% | 17.45% | 15.84% | |
| 2019 | $0.665 | 14.66% | 17.40% | 15.90% | |
| 2020 | $0.760 | 14.29% | 14.98% | 16.25% | 14.28% |
| 2021 | $0.845 | 11.18% | 13.36% | 15.51% | 14.94% |
Source: Author; Data Source: Waste Connections Investor Relations
For dividend growth investors, the dividend payout ratio is an important metric to track. The payout ratio lets you know how much of a business’ profits or free cash flow are committed to paying the dividend. All else being equal, the lower the payout ratio the better as there’s more potential for the dividend to be increased even faster than the underlying business is able to grow.
WCN Dividend Payout Ratios (WCN SEC filings)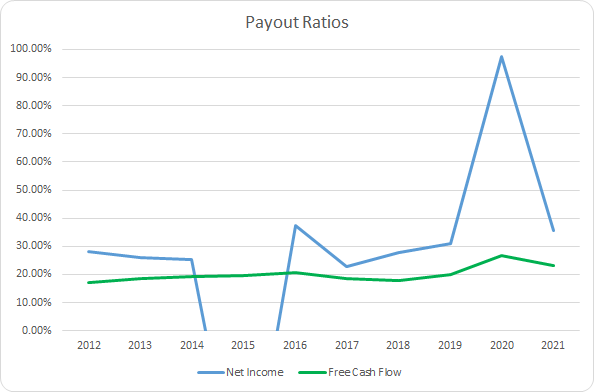
Excluding FY 2015 and FY 2020 the 10-year and 5-year average net income payout ratio for Waste Connections comes to 29.3% for both. Meanwhile the average free cash flow payout ratios are 20.1% and 21.3%. Waste Connections has plenty of capacity to continue with strong dividend increases into the future.
Quantitative Quality
When investing my savings I want to seek out predictable and easy to understand businesses. It doesn’t get much simpler than trash collection and disposal. I want my investments to show consistent improvement across a variety of financial metrics over time.
WCN Revenue Profits and Cash Flow (WCN SEC filings)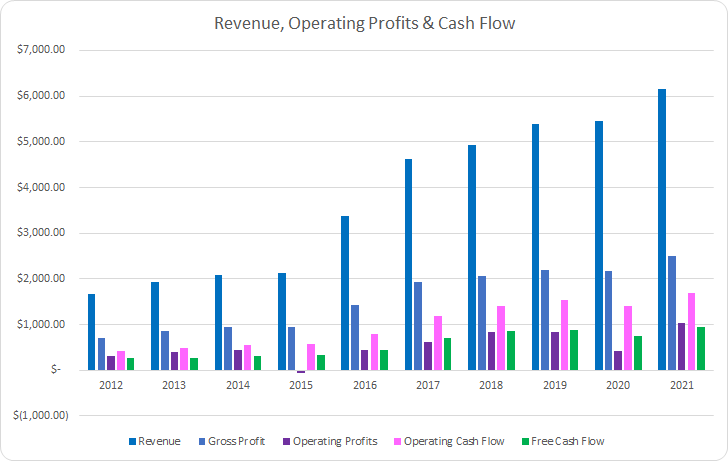
Waste Connections has shown impressive growth over the last decade fueled in large part to acquisitions. Revenues grew by 270% or 15.7% annualized over that time. Gross profits lagged slightly rising 254% or 15.1% annually.
Operating profits rose just 229% or 14.2% annualized lagging behind both revenues and gross profit. However, operating cash flow increased by 308% or an impressive 16.8% annually. Free cash flow improved by 263% during the last decade or 15.4% annualized slightly underperforming revenue growth.
Strong businesses with some kind of moat protecting their business should be able to show at a minimum stable, and more likely rising, margins over time. I typically want to see free cash flow margins greater than 10% and take that as a sign of a business that is able to generate strong cash flow from its operations.
WCN Margins (WCN SEC filings)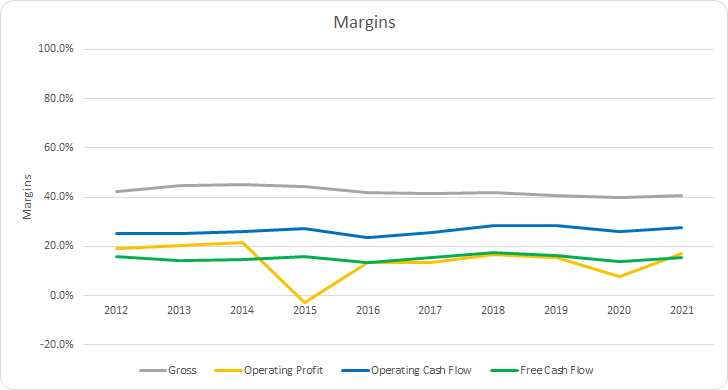
Waste Connections’ gross margins have retreated slightly over the last decade; however, they’ve generally been stable. The 10-year average gross margin is 42.3% with the 5-year average sitting at 40.9%.
Waste Connections’ free cash flow margins have varied from year to year; however, overall they’ve been stable and have surpassed the 10% threshold every single year. The 10-year average free cash flow margin comes to 15.2% with the 5-year average at 15.7%.
Additionally I want to see a business that is efficient at generating free cash flow from its assets and invested capital. The primary metric that I track is the free cash flow return on invested capital, FCF ROIC, but I also monitor the FCF ROA and FCF ROCE.
WCN Free Cash Flow Returns (WCN SEC filings)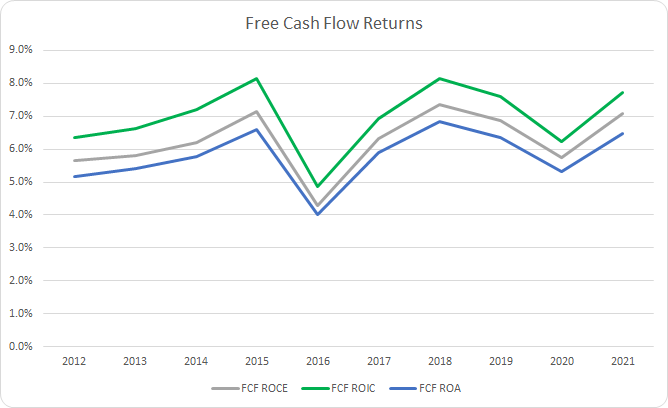
Waste Connections carries relatively low FCF ROICs some of which is explained by the acquisition heavy nature of their business. Over the last 10 years Waste Connections has averaged a 7.0% FCF ROIC with the 5-year average coming to 7.3%.
To understand how Waste Connections uses its free cash flow I calculate three variations of the metric, defined below:
- Free Cash Flow, FCF: Operating cash flow less capital expenditures
- Free Cash Flow after Dividend, FCFaD: FCF less total cash dividend payments
- Free Cash Flow after Dividend and Buybacks, FCFaDB: FCFaD less net cash used on share repurchases
WCN Free Cash Flows (WCN SEC filings)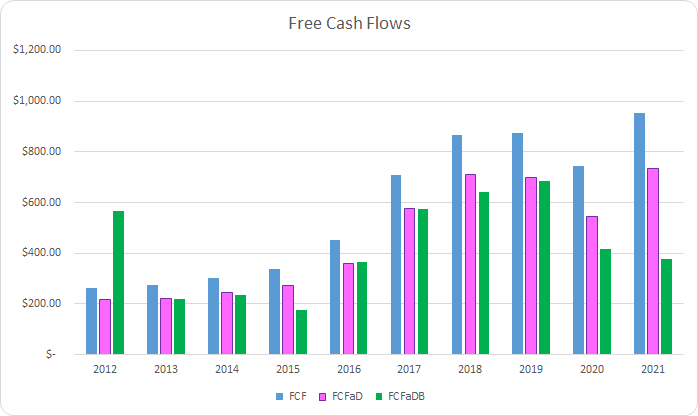
Over the last 10 years Waste Connections has generated $5.8 B in FCF which is all the more impressive considering their market capitalization 10 years ago was around $3-4 B. As we saw earlier Waste Connections has been paying and raising dividends every year over that time sending out a total of $1.2 B to shareholders. That puts the cumulative FCFaD for the last decade at $4.6 B.
Waste Connections has not been a serial share repurchaser opting to continue to grow through acquisitions instead. During the last decade Waste Connections has spent a near total of just $326 M on buybacks which brings the cumulative FCFaDB to $4.3 B.
Historically, Waste Connections has committed significantly more cash flow to dividends compared to buybacks by roughly a 3.7:1 ratio during the last decade. As mentioned above Waste Connections has opted for continued acquisitions rather than buybacks.
WCN Shares Outstanding (WCN SEC Filings)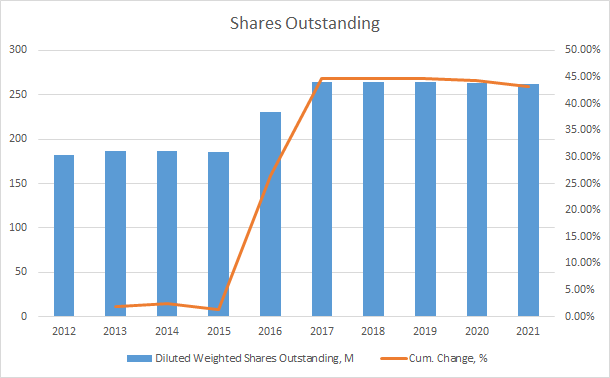
Should acquisition opportunities slow in the future I would expect share repurchases to become a larger part of the capital allocation story for Waste Connections. As such over the last decade Waste Connections’ share count has risen by 43.2% or ~4.1% annually with the bulk of the increase coming in FY 2016 and FY 2017.
When I invest my savings into a business, my intention is to own the shares for a period measured in years and potentially stretching into decades. As such I want to make sure that the debt a business carries does not appear overly burdensome.
WCN Debt to Capitalization (WCN SEC filings)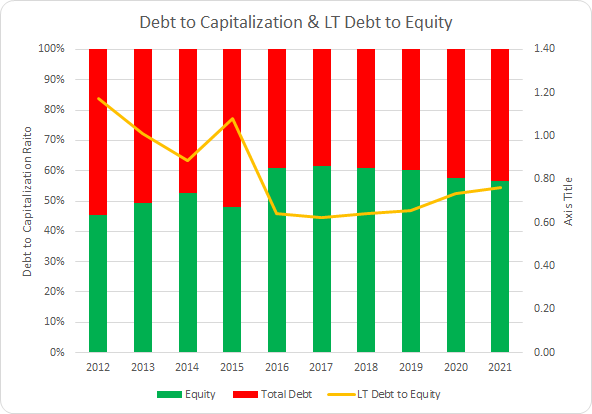
For the most part Waste Connections’ debt-to-capitalization ratio has been stable over the last decade. During that time Waste Connections’ debt-to-capitalization ratio has averaged 45% with a 41% average for the most recent 5-years.
While the capital structure is one way to measure the leverage on the business, I place more weight on the net debt ratios. The net debt ratios examine the levels of net debt versus some measure of profits or cash flow. It can be used to see how much claim there is on the profits that the business generates and give you an idea of how quickly the business could de-lever if need be.
WCN Debt Ratios and ICR (WCN SEC filings)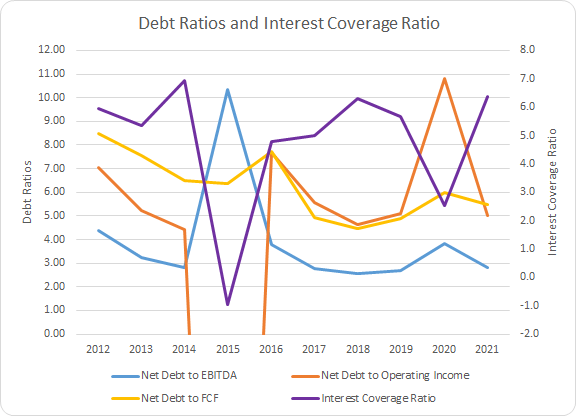
The 10-year average net debt-to-EBITDA, net debt-to-operating income, and net debt-to-FCF ratios are 3.9x, 2.1x, and 6.2x, respectively. Accordingly the 5-year averages are 2.9x, 6.2x, and 5.2x.
Waste Connections carries a sizable amount of leverage versus the profits and cash flow the business generates; however, considering the relatively stable nature of the business they can afford to carry higher debt loads than other businesses.
Valuation
After finding a business that I believe is high quality, I try to value it from different perspectives to narrow down what I believe is a fair price to pay for the business. The valuation methods that I utilize are dividend yield theory, a reverse discounted cash flow model, and a minimum acceptable rate of return, “MARR”, analysis.
Dividend yield theory is a valuation method that centers on the concept of reversion to the mean and operates under the assumption that investors will value the business around a normal dividend yield over time. For Waste Connections I’ll use the 3-year average forward dividend yield as a proxy for fair value.
Waste Connections Dividend Yield Theory (WCN Investor Relations and Google Finance)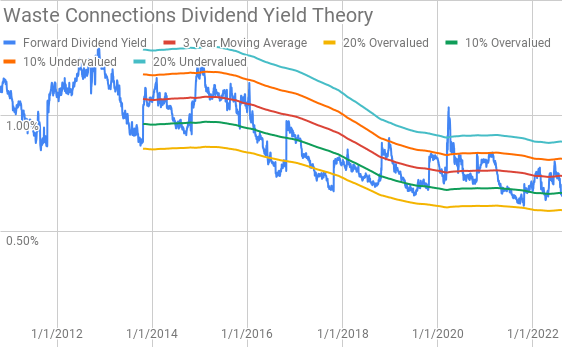
Waste Connections’ shares have not typically offered an attractive dividend yield; however, as we saw in the dividend section above they’ve been more than willing to grant very strong dividend increases.
Waste Connections currently offers a forward dividend yield of 0.65% compared to the 3-year average forward dividend yield of 0.74%. Based on the current $0.23 per share per quarter payout the fair price would be around $124. Waste Connections has rarely approached the 20% undervalued band typically topping out around the 10% level.
A reverse discounted cash flow analysis is a short-hand way to use a DCF model to determine if a business appears reasonably priced. Instead of making explicit assumptions about the growth and margins of the business to determine a valuation, you work backwards from the current market valuation in order to see what kind of assumptions are baked in to the current price.
I use a simplified DCF model built on revenue growth, an initial free cash flow margin of 15.0% that increases to 17.5% during the forecast period. Additionally I’ve assumed a 3.5% terminal growth rate.
For the discount rate I’ve used an after-tax cost of debt of 2.51% along with both a 10% and 8% cost of equity. The discount rate for the 10% cost of equity becomes 9.1% with the 8% cost of equity yielding a 7.3% discount rate.
Under those assumptions Waste Connections need to grow revenues by 13.4% annually through FY 2031 in order to generate the cash flows necessary to support the current market price of $141.56 with the 9.1% discount rate scenario. The 7.3% discount rate/8% cost of equity scenario requires 7.3% annual revenue growth during the forecast period.
Analysts expect Waste Connections to report FY 2022 EPS of $3.78 and FY 2023 EPS of $4.36. They also expect Waste Connections to be able to grow earnings 12.5% annually over the next 5 years. I then assumed that earnings growth would slow to 5.0% annually for the following 5 years. Dividends are assumed to target a 25% payout ratio.
For the future multiple to be used in the MARR analysis I like to see how investors have valued Waste Connections in the past. Over the last decade Waste Connections has typically been valued between ~20x and ~35x; however, for the MARR analysis I’ll examine exit multiples ranging between 15x and 35x.
The following table shows the potential internal rates of return that an investment in Waste Connections could potentially generate provided the assumptions from above prove to be reasonable estimates of the future. Returns assume shares are purchased around $141.56, Friday’s closing price, and that dividends are paid and increased along the timeline that Waste Connections has typically followed.
| IRR | ||
| P/E Level | 5 Year | 10 Year |
| 35 | 12.3% | 8.8% |
| 30 | 8.5% | 7.1% |
| 25 | 4.1% | 5.1% |
| 20 | -0.9% | 2.8% |
| 15 | -7.1% | -0.2% |
Source: Author
Additionally I use the MARR analysis framework to determine the maximum price I could pay for shares today to generate the returns that I desire from my investments. The following table shows the price one could pay for shares today in order to generate varying returns across the multiple ranges from above if Waste Connections can generate the EPS growth as laid out above.
| Purchase Price Targets | ||||||
| 10% Return Target | 12% Return Target | 8% Return Target | ||||
| P/E Level | 5 Year | 10 Year | 5 Year | 10 Year | 5 Year | 10 Year |
| 35 | $155 | $129 | $143 | $109 | $168 | $152 |
| 30 | $133 | $111 | $123 | $95 | $144 | $131 |
| 25 | $112 | $94 | $104 | $81 | $121 | $111 |
| 20 | $90 | $77 | $84 | $66 | $98 | $91 |
| 15 | $69 | $60 | $64 | $52 | $75 | $71 |
Source: Author
Conclusion
The trash business is one that I wish I had built a stake in much earlier than I did. It’s a fantastic, defensive business that usually sees little fluctuations from year to year. For a long-term dividend growth investor that’s music to my ears.
Waste Connections has shown enviable revenue growth over the last decade. While Waste Connections’ business is heavily skewed towards M&A, although organic growth does occur, the results have been fantastic when combined with the fairly disjointed industry.
Waste Connections carries strong margins with a free cash flow margin regularly in the 15% area; however, it’s free cash flow returns aren’t quite what I’d like to see them achieve. That being said I do believe they can push those up higher over time.
Dividend yield theory suggests a fair value range for Waste Connections between $113 and $137. Waste Connections should announce a raise in late October which I’m expecting to come to $0.26. Should the dividend be increased to that level the fair value range would increase to $128 to $155.
The reverse DCF analysis seems to show that Waste Connections needs to essentially repeat the prior decade of growth with modest margin expansion in order to generate the cash flows that would support the current valuation while providing investors 10% returns. Considering management is expecting a normal year to show M&A activity that increases revenue between $125 – $150 M that’s a tall ask as that would increase revenues by just $1.5 B at the high end across a decade.
The reverse DCF doesn’t account for the potential heavier utilization of share repurchases which would lower the required revenue growth rate. In FY 2021 Waste Connections repurchased over 1% of outstanding shares and in Q1 FY 2022 they reduced the share count by ~1.1%.
Additionally the MARR analysis shows that 10% returns are likely hard to come by as well for investors targeting 10% returns without the aid of a continued premium multiple for the next 5 years. Assuming a 25x to 30x terminal multiple 5 years out and a 10% return target Waste Connections is worth between $112 and $133 per share.
Increasing the return threshold to a 12% IRR lowers the fair value to between $104 and $123. Meanwhile lowering the targeted return to 8% increases the fair value to $121 to $144.
Waste Connections is a fantastic business; however, at current market pricing the shares appear very expensive. While growth could very well outstrip estimates in the reverse DCF and MARR analyses that opens up the risk of disappointing investor returns.
While I like Waste Connections the business, the stock appears to offer an unattractive risk:reward from the current levels and I believe there’s likely to be better chances to purchase shares at more opportunistic valuations.
Be the first to comment