

blackred
Whenever I update CapitalSpectator.com’s long-term return forecasts for the major asset classes I sometimes receive emails from readers asking for comparable estimates for shorter-term horizons. My standard response: there’s already a fair amount of noise in the long-run outlook and the noise rises for shorter-time horizons.
A distinctive feature of developing expected returns for the stock market is that longer-run estimates appear to be more reliable than their shorter-run counterparts. There are still no guarantees, of course – the future’s always uncertain. Yet it’s striking that predicting market risk is more reliable in the shorter run vs. longer-run scenarios – the opposite for projecting returns.
Despite the limitations and caveats, demand is always high for estimating what the market might deliver in the near term. The question is whether there are reasonable models for developing perspective on that horizon? Yes, although much depends on your definition of “reasonable”.
If you’re willing to go down this rabbit hole, there are several paths to consider for US equities. One that’s on my short list is using the performance spread via short- and longer-term historical windows. Reliability is in the eye of the beholder and so caveat emptor applies. But in the cause of estimating some rough numbers for deciding which way the wind’s blowing, there’s a case for using performance spreads as a first approximation. Think of it as a calculated risk with a non-trivial degree of noise.
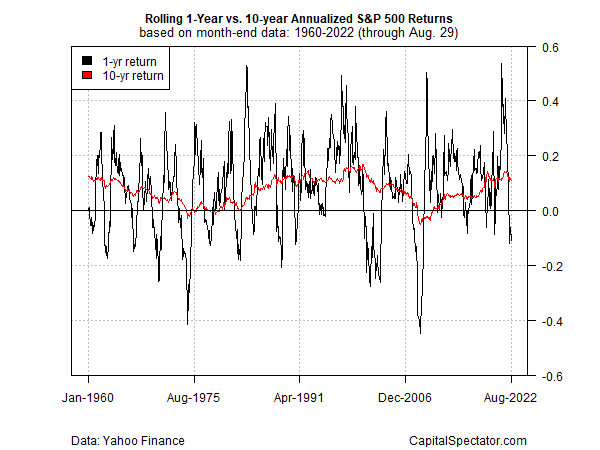
The first step is calculating rolling returns for the 1- and 10-year periods for the S&P 500 Index (note: the 10-year performance is annualized). The reasoning: the 1-year return is volatile relative to the 10-year performance, a mix that serves as a rough proxy for mean reversion in market action. A dive in the 1-year return below the relatively stable 10-year result tends to be followed in short order by a spike above (and vice versa). It’s not perfect and there are plenty of periods when this relationship period is weak. But for relatively deep spikes and dives in the 1-year performance, it’s a useful framework for monitoring market activity with an eye on estimating the probability of what we’ll see in the near-term future.
Notably, comparing the 1-year/10-year spread with subsequent 2-year S&P 500 returns reflects an encouraging pattern: low (high) spreads align with high (low) returns for the trailing 2-year performance (when calculated 12 months ahead). It’s a bit counterintuitive, but history suggests there’s traction in the relationship, i.e., the subsequent 2-year return (12 months ahead) vs. the current 10-year/1-year spread.
For a summary of this relationship, consider the chart below. The y-axis is the 2-year S&P return (annualized) vs. the 10-year/1-year return spread (from 12 months earlier). The spread tends to predict what the 2-year return will be a year out.
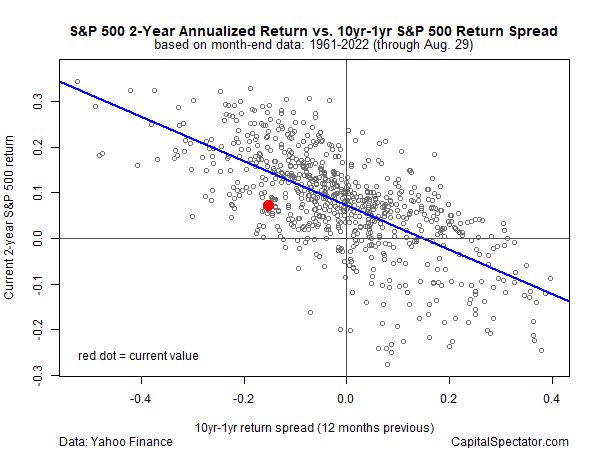
Yes, there’s a fair amount of noise (i.e., the dots vary substantially around the blue linear regression line). But there’s also a discernible pattern and one that’s useful (as long as you don’t think of it as a crystal ball). The regression modeling reports an R-squared of 0.44 and the correlation between the two data sets is a moderately negative -0.66. Overall, pretty good as short-term forecasting efforts go (admittedly, that’s a low bar).
The red dot marks the current data. The trailing 2-year return (as of Aug. 29) is an annualized 7.3% vs. a 10-year/1-year return spread of -15.2 percentage points from 12 months ago. The implication: as long as there’s a negative reading in the 10-year/1-year return spread, the future 2-year market return will be positive. But here’s the problem now: the current spread is positive, by a substantial degree: +22% (11% for the 10-year return less a negative 11% for the 1-year return), which implies a moderately negative 2-year performance a year out.
Can you bank on it? No, but as a first approximation it’s a reasonable way to start guesstimating what the trailing 2-year performance will be in the near-term future.
Correction: an earlier version of this story incorrectly reported the 10-year/1-year spread as inverted. In fact, this spread is NOT inverted for this analysis. Apologies.
Editor’s Note: The summary bullets for this article were chosen by Seeking Alpha editors.
Be the first to comment