

jetcityimage
Investment Thesis
Walgreens Boots Alliance Inc (NASDAQ:WBA) today is very different from what it was in 2014. Apart from being about 2 ½ times bigger in size in terms of Total Assets, it had just diversified into local clinical care services. It had also embarked on a Cost Transformation Program (Cost Program). While there were expenses associated with the Cost Program, we have yet to see the full benefits.
I would consider WBA as a company in transition. The current performance does not capture the full benefits of the new business segment as well as the cost savings. Based on a future post-transition scenario, I estimated that there is a margin of safety at the current price.
Introduction
In 2015, WBA embarked on a Cost Program to reduce costs and increase operating efficiencies. It included store closures, reorganization of operations, and streamlining information technology and other functions.
Initially planned as a 3-year target to achieve USD 1 billion in cost savings, this has been expanded and extended several times. As of May 31, 2022, the annual cost savings target had been updated to $3.5 billion by the end of fiscal 2024. WBA is currently on track to achieve the savings target.
At the same time, the Cost Program “…will result in cumulative pre-tax charges to its GAAP financial results… to be recorded as exit and disposal activities.”
As such, WBA had gone through several transformational changes over the past few years.
- Its merger/re-organization with Boots Alliance GmbH in 2015 resulted in a significant increase in Operating Assets.
- There was another significant increase in Operating Assets when in 2020 it adopted the ASU 2016-02, Leases (Topic 842). This resulted in the recognition of right-of-use assets of $22 billion.
- In 2021, it disposed of its Alliance Healthcare business and acquired Village Practice Management Company (Village MD) to form the core of its US Healthcare segment.
- In 2022, there was the Shields Health Solutions Parent, LLC (Shields) acquisition.
These changes impacted both the total Operating Assets as well as the return as measured by Operating Income / Operating Assets. Refer to Chart 1.
While the Operating Assets had increased, the returns had been declining since 2010. I would distinguish 3 periods with the following average annual returns:
- Pre-2015 of 14.5 %.
- 2015 to 2019 of 9.6 %.
- Post-2019 of 3.3 %.
Thus, in assessing the performance and valuation of WBA, it makes more sense to focus on the post-2019 performances.
Chart 1: Returns and Operating Assets (Author)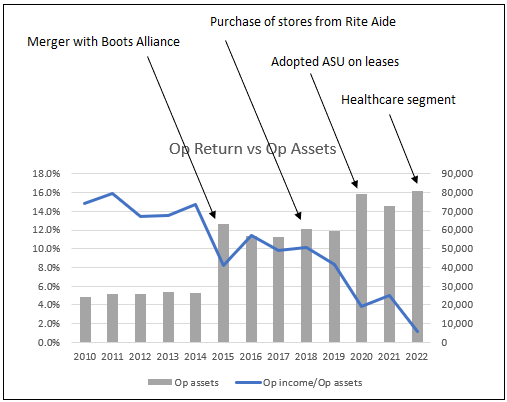
Notes to Chart 1
a) 2022 is unaudited.
b) Operating Assets = Total Assets – Cash & Short-term Investments – Long-term Investments.
Strong Operating Performance
Over the years, WBA had undertaken several acquisitions that can be broken down into two:
- Those whose results are consolidated. These included investments in Boots Alliance and Rite Aide.
- Those accounted for under the equity method. These included the Amerisource Bergen and Sinopharm Holdings Guoda Drugstore investments.
To track the performance of the former, I tracked the Revenue, Operating Profit and Operating Assets as shown in Chart 2.
You can see that while Revenue has been increasing since 2010, Operating Profit had been decreasing. However, the adjusted Gross Profitability (defined as Gross Profit / Operating Assets) appeared to be “stable” post-2015.
In other words, the decline in Operating Profit is due to a substantial increase in the Selling, General, and Admin (SGA) expenses.
- From 2010 to 2014, the average annual SGA expenses were USD 17 b.
- From 2015 to 2022, the average annual SGA expenses were USD 24 b.
But you should not look at absolute values as the revenue of WBA had a significant jump in 2015. On an SGA margin (SGA / Revenue) basis, we have 2010 to 2014 average SGA margin of 23%. This decreased to an average of 20 % from 2015 to 2022. Except for 2022, the SGA margin showed a decreasing trend since 2015.
Considering that some of the Cost Program charges were allocated to the SGA, I would consider this a good performance.
Along this line, I would note that the 2022 result is not reflective of future performance. There was a significant increase in the SGA in 2022 due to a one-off opioid litigation settlement as well as charges under the Cost Program.
Chart 2: Performance Index (Author)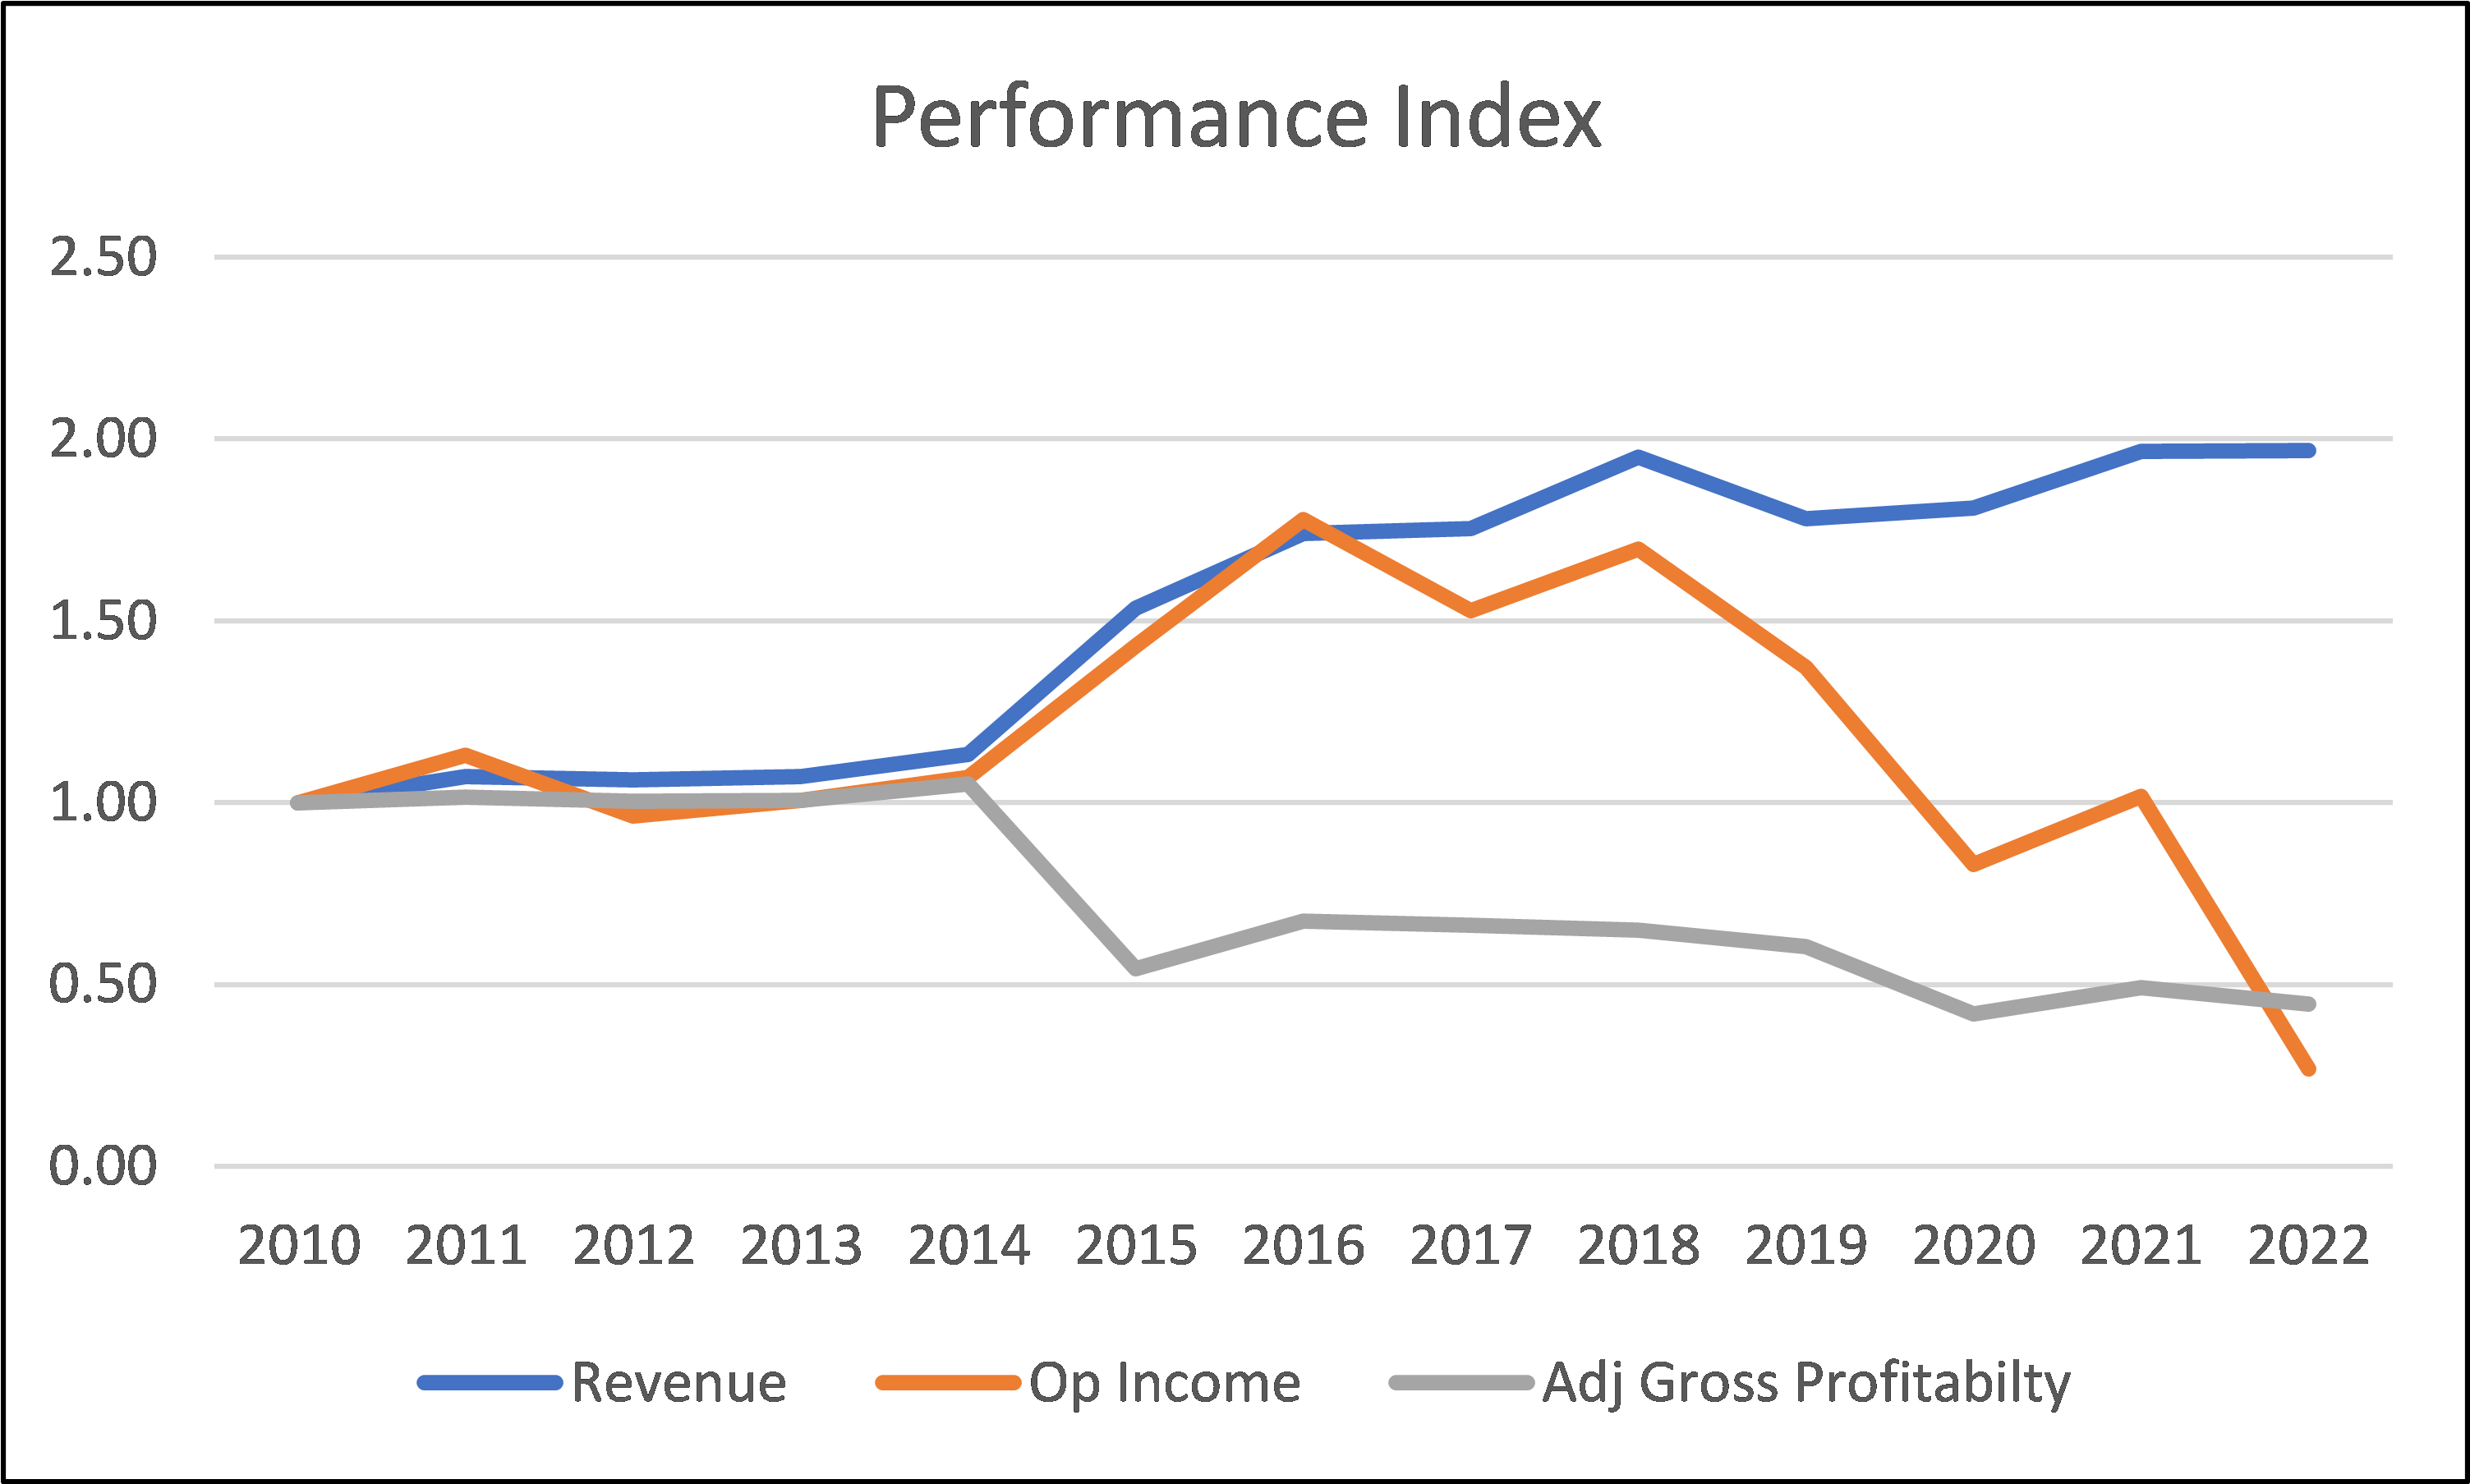
Notes to Chart 2:
a) To derive the index, I divided the values for each year by the respective 2010 value.
b) Adj Gross Profitability = Gross Profit / Operating Assets
Apart from the SGA, there were 2 other positive signs for WBA:
- Revenue growth was a combination of organic and acquisition growths. The positive sign was that WBA had managed to generate same-store sales growth post the Boots Alliance merger. I interpreted this to mean that WBA had also been able to increase the store sales for those that it acquired. Refer to Table 1.
- It has “stable” Gross Profitability. It illustrated that WBA had been able to achieve the same % of gross profits with the additional Operating Assets. According to Professor Novy-Marx, Gross Profitability has the same result as Price Book Value in predicting returns.
Table 1: Same Store Sales Growth (Author)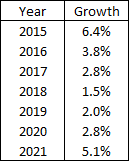
Financially sound
I would rate WBA as financially strong based on the following:
- While it has a Debt Equity ratio of 1.2 as of the end of Aug 2022, this was because, over the past 12 years, WBA had spent USD 25.2 b to buy back its shares. Without the buyback, the DE would be about 0.7.
- From 2010 to 2022, it had been able to generate a positive Cash flow from Operations every year. Post-2019, it generated about USD 5.0 b of Cash flow from Operations annually compared to its average annual interest of USD 0.5 b.
- WBA would have an A rating. This was based on Damodaran’s synthetic rating using WBA’s Aug 2022 interest coverage ratio.
- Post-2019, it had a negative working capital every year. In other words, the Amount Payable and Accrued Expenses far exceed its Inventory and Amount Receivable. I am not sure whether this is a sustainable business model, but it sure eliminates the working capital requirements.
Financial strength is an important factor for companies going through a transition, as we do not know how long the transition would take.
Valuation
I valued WBA based on the Earnings Power Value (EPV) using the single-stage Free Cash Flow to the Firm (FCFF) model where:
Value of the Firm = FCF X (1 + g) / (WACC – g)
FCFF = EBIT X (1 – t) X (1 – Reinvestment rate)
WACC = Weighted Average Cost of Capital based on the average WACC as per Table 3.
t = tax rate
g = growth rate
For the EPV, I assumed that both g and the Reinvestment rate = 0
Thus, the valuation equation reduces to
Value of the Firm = EBIT X (1 – t) / WACC
Value of Equity = Value of the Firm + Cash & Short Term Investments + Long Term Investments – Minority Interests – Debt
EBIT = Gross Profits – SGA
Gross Profits = Adj Gross Profitability X Operating Assets
SGA = average 2020 to 2022 SGA expenses – savings due to Cost Program
The computation and other assumptions used in the valuation are summarized in Table 2.
Table 2: Computation of EPV (Author)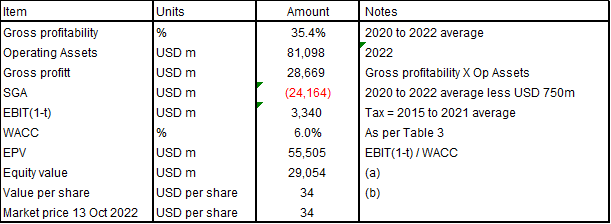
Notes to Table 2
a) Based on Cash & Short Term Investments, Long Term Investments, Minority Interests, and Debt as of the end Aug 2022.
b) Based on 865.9 m shares as of the end Aug 2022.
Table 3: WACC (Author)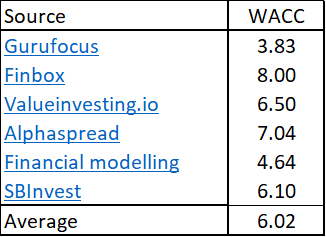
Note to Table 3: The WACC was based on the first page results of a Google search for the term “WBA WACC”
The unknown is the savings that would accrue to the SGA component from the Cost Program. WBA has stated that it would be able to achieve a benefit of USD 3.5 billion annually. However, WBA has not stated the proportion of this that was be reflected in the gross profits and the SGA.
Given the unknown, rather than try to estimate the intrinsic value, I reverse-engineered the market price by varying the savings that would accrue to the SGA under the Cost Program.
For the EPV = market price, the savings would be USD 750 m, i.e., about 21 % of the USD 3.5 b Cost Program benefit.
This suggests that there is a margin of safety at the current price as I have not considered the following:
- The 2020 to 2022 average SGA expenses included some of the Cost Program charges. This was about USD 500 million annually based on the 2019 to 2020 data.
- I have not included the value of the growth component.
- I had assumed that the value of the non-consolidated businesses (the Long-term Assets) are based on the book value. These are viable businesses whose value would exceed the book value.
Valuation risks
WBA had 3 operating segments in 2022.
- The legacy US Retail Pharmacy (formerly the US) segment and the International segment. I estimated that these segments employed about USD 73 b in Operating Assets.
- The US Healthcare segment comprises the legacy Walgreens Health organic business and the new VillageMD and Shields businesses. I estimated that this segment employed about USD 8 b in Operating Assets.
I estimated the Operating Assets by comparing the 2022 Total Assets with those in 2021 Assets.
In 2022, the US Healthcare segment only generates USD 622 million in revenue with negative operating income. My valuation model assumed that the US Healthcare segment has turned around and would achieve the same Gross Profitability as the other legacy segments.
I would argue that even if the US Healthcare segment is not successful, it represents only 10% of the Total Assets. A sensitivity analysis of a worst-case scenario resulted in an EPV of USD 30 per share. This was based on the following assumptions:
- There were only contributions from the US Retail Pharmacy segment and the International segment.
- The US Healthcare was sold off for USD 4 b, i.e., half the value of the segment Total Assets.
- The SGA expenses were proportioned based on the Operating Assets.
Conclusion
WBA is a company in transition. There are 2 drivers of the change:
- The venture into the local clinical care business as represented by the US Healthcare segment.
- The Cost Program.
Management has committed to the benefits of the Cost Program. However, the success of the US Healthcare segment is still to be proven. Assuming that both are achieved, then there is a margin of safety at the current price.
However, I do not expect the US Healthcare segment to be a failure given the management track record. But even if this happens, there is downside protection.
The analysis suggest that the market is valuing WBA based on its transitional performance. This does not represent the value of WBA.
At the current market price, it has enough margin of safety for the long-term value investor.
Be the first to comment