

MStudioImages
The Vanguard International High Dividend Yield ETF (NASDAQ:VYMI) tracks the performance of the FTSE All-World ex US High Dividend Yield Index. At just a 0.22% annual expense ratio, it’s an efficient way to gain exposure to foreign companies with high payout rates. It is a passive fund, so tax impacts are also relatively low. Moreover, investors holding the ETF in a taxable account can capture valuable foreign tax credits by way of the fund’s stakes in international firms.
VYMI holds 1,339 stocks with a median market cap of nearly $39 billion, according to Vanguard. The portfolio’s average P/E ratio is just 8.3x and the ETF has a strong $4.3 billion in total net assets. The fund pays out quarterly dividends around the 24th of March, June, September, and December.
According to Wall Street Horizon’s ETF data coverage, VYMI’s next confirmed ex-date is September 19 with a record date the following Tuesday. The first day the fund trades without the Q3 dividend is Thursday, September 22.
Upcoming Dividend Dates
Wall Street Horizon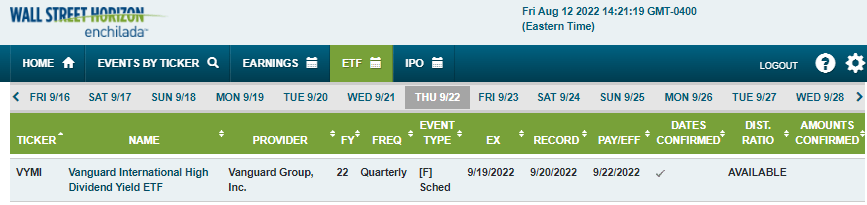
Digging into the portfolio, VYMI has 22% exposure to Emerging Markets and the remainder into diversified developed markets – this is a similar split when looking at the overall ex-US stock index.
Developed Markets Dominated VYMI’s Country Allocation
Vanguard Group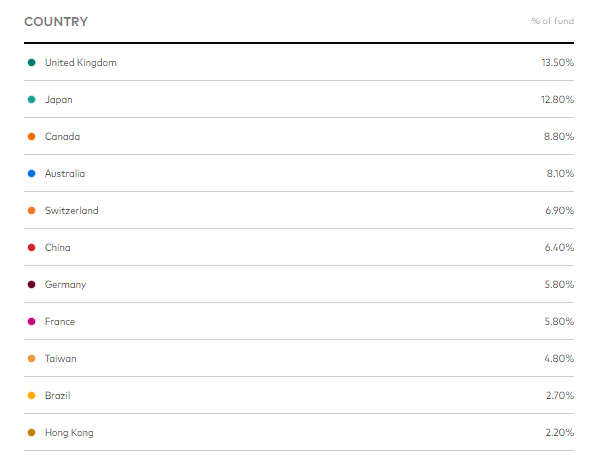
Among the many aspects of VYMI that I like is its diversified single-stock exposure. With Apple (AAPL) notching all-time highs in terms of an individual’s weighting in the S&P 500 recently, VYMI shareholders are exposed only up to 1.97% in one company as of June 30, 2022’s mark date.
VYMI: A Diversified Portfolio
Vanguard Group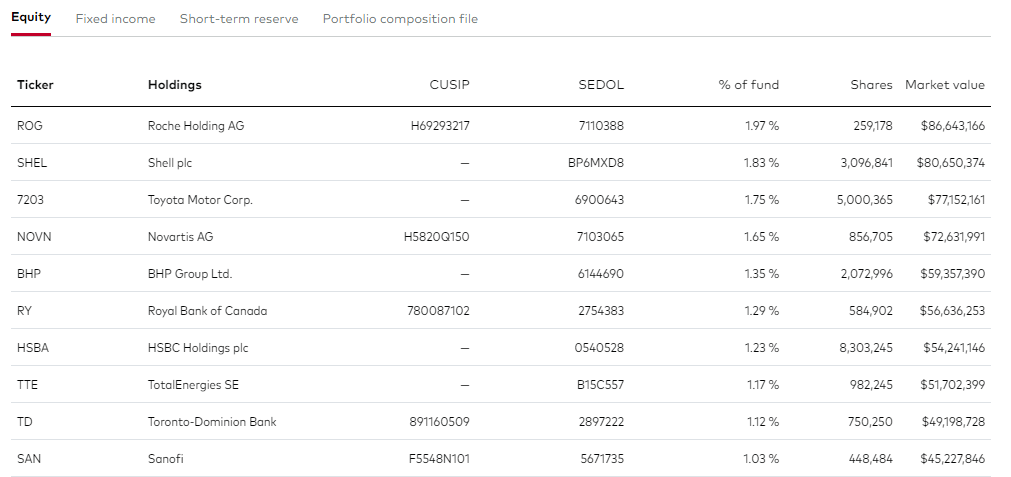
Something investors should always pay attention to is an ETF’s sector exposure. So much of a fund’s return is driven simply by its allocation to the 11 market groups. For VYMI, Financials play a major role. At more than 34% of the ETF, shareholders have about three times the weight compared to the S&P 500. It’s also a wager on higher oil prices by way of an 11% stake in Energy stocks. VYMI’s performance will certainly stray from returns in the U.S. stock market simply by way of just a 2.8% weight in Information Technology (by far the largest domestic market sector weight).
Sector Allocations: Heavy In Value Sectors, Light In Growth
Vanguard Group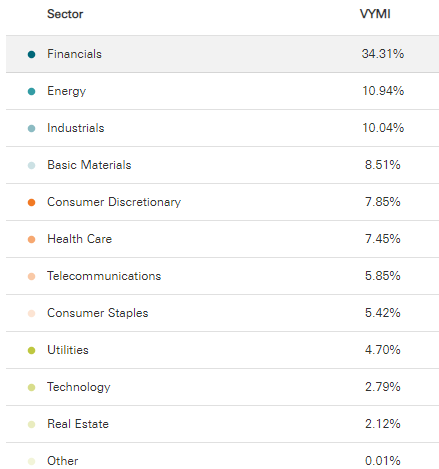
The Technical Take
Foreign dividend-paying stocks are cheap, and VYMI is an efficient vehicle by which to access the space. But what does the chart say? Is there momentum in this niche of the global market?
VYMI recently climbed above an important resistance level. It is critical that the $60 to $61 range, the May low and June rebound high, holds. The next stop could be the early June peak near $67.
VYMI 1-Year Chart: Climbing Above The May Low & Late June Peak
StockCharts.com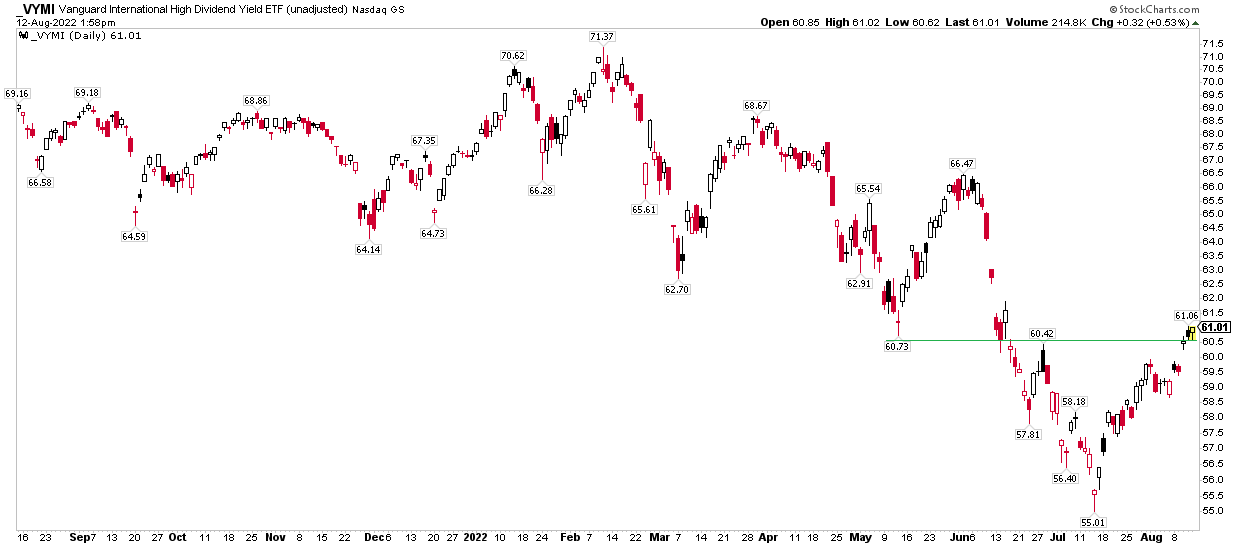
On a relative basis, VYMI was very strong vs the broad ex-US market through May, but then dividend stocks fell out of favor. We have not seen a sustained rebound, although VYMI has ticked up vs the Vanguard All-World Ex-US Index ETF (VEU) in the last week-plus. I would like to see a more sustained trend higher (red line) before going overweight VYMI.
VYMI vs VEU: Relative Weakness Since Late May
StockCharts.com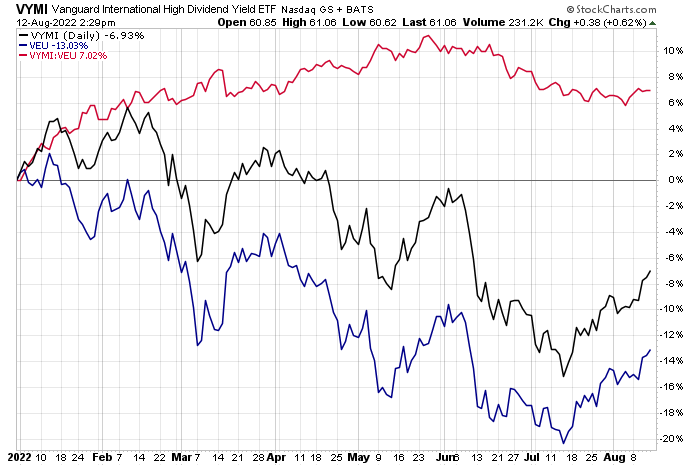
The Bottom Line
VYMI is a solid long-term play for investors seeking exposure to foreign high dividend stocks. Its low cost, cheap valuation, and diversified portfolio make it a worthwhile investment. Near-term, a key price level must prove itself and relative strength should improve before active investors go overweight VYMI.
Be the first to comment