


Foryou13
(This article was co-produced with Hoya Capital Real Estate)
Introduction
An investor could spend their day exploring, analyzing, and picking from just the ETFs offered by the Vanguard Group and have the full investment universe available. They have an ETF for almost any equity or fixed income category an investor could want exposure too (well almost any). Even after an investor has decided to pick a Large-Cap US ETF, Vanguard offers 24 ETFs they list as Large-Cap, though some of those are more “total market” in their focus.
In this article, I chose to focus on two Large-Cap strategies: Total LC and High Dividend Yield LC by exploring and comparing these ETFs:
Along with comparing VYM against VV, I compare VYM against some Large-Cap Value ETFs to see if Value stocks influenced its results as much as its high dividend focus.
Investors will need to decide whether the extra yield is worth the lower long-term return VYM had compared to VV. To complicate that decision, VYM has been performing better recently.
Vanguard High Dividend Yield ETF review
Seeking Alpha describes tis ETF as:
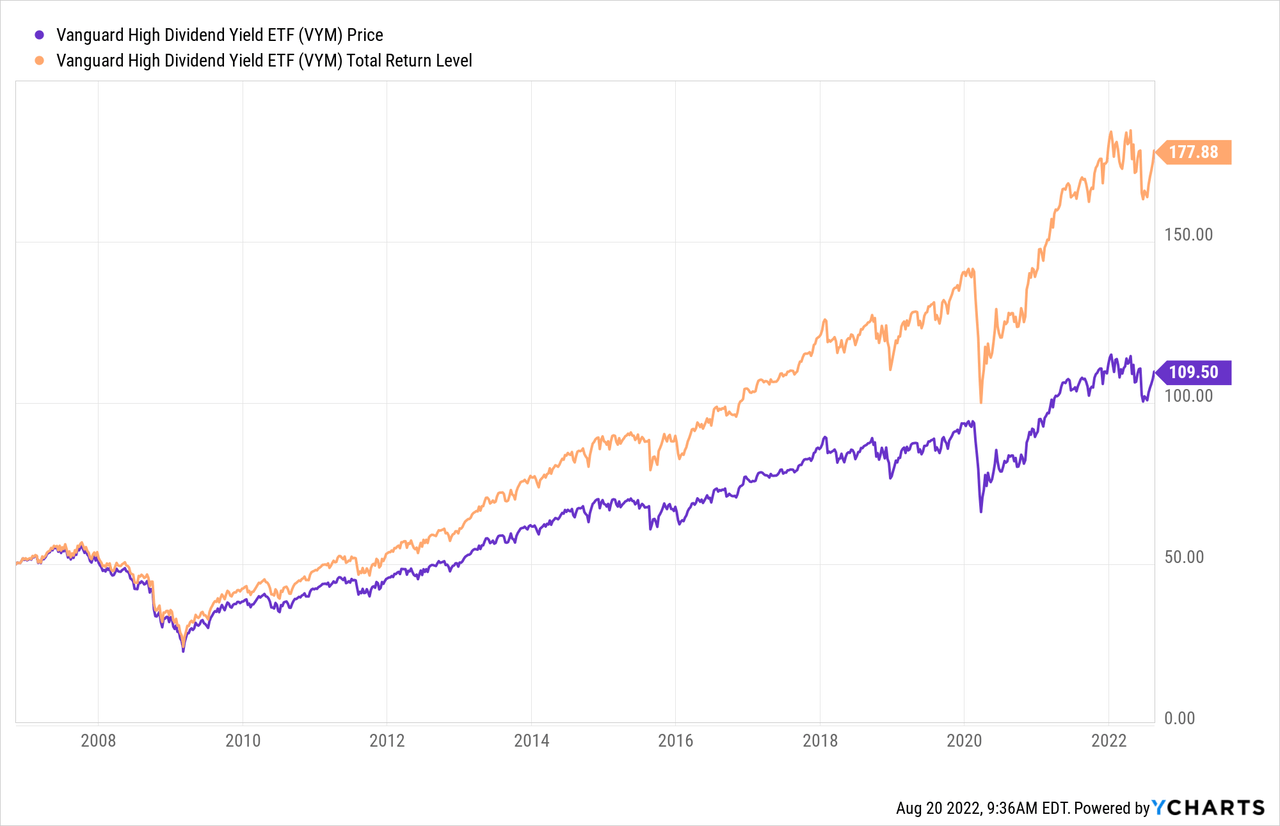
The investment seeks to track the performance of the FTSE High Dividend Yield Index that measures the investment return of common stocks of companies that are characterized by high dividend yield. The manager employs an indexing investment approach designed to track the performance of the index, which consists of common stocks of companies that pay dividends that generally are higher than average. The adviser attempts to replicate the target index by investing all, or substantially all, of the fund’s assets in the stocks that make up the index, holding each stock in approximately the same proportion as its weighting in the index. VYM started in 2006.
Source: seekingalpha.com VYM
VYM has $38.6b in AUM and sports a 2.92% trailing yield. Vanguard charges 6bps in fees. Vanguard classifies VYM as a Large-Cap Value ETF.
FTSE High Dividend Yield Index review
Since VYM invests passively against this Index, it is important to understand its methodology. Two important parts from the Index Methodology PDF are:
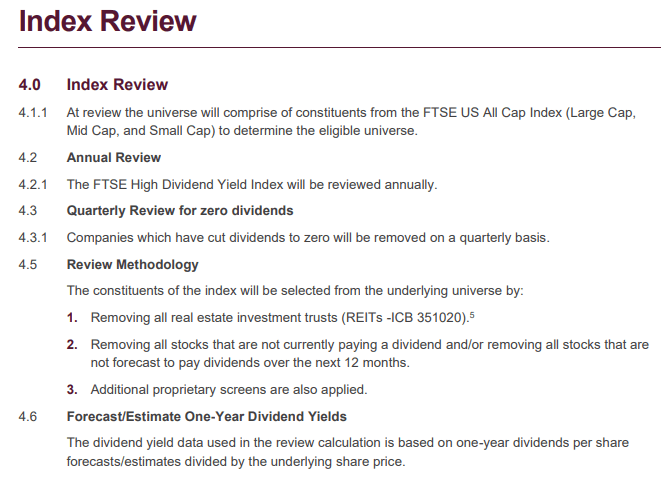
research.ftserussell.com Index PDF
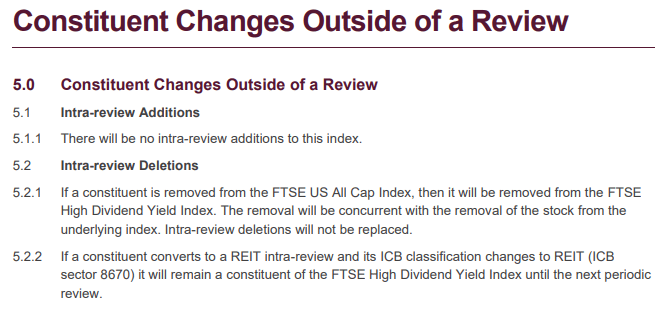
research.ftserussell.com Index PDF
VYM holdings review
Vanguard provides a basic set of equity data points for their ETF:
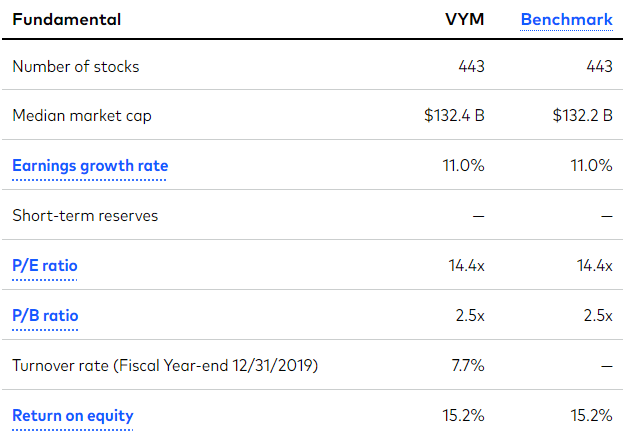
investor.vanguard.com VYM
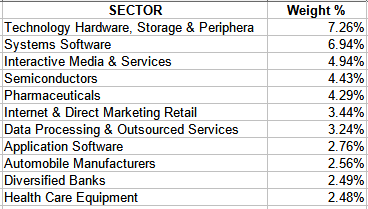
This is how one Vanguard website breaks VYM into sectors. A second site uses more detailed allocations and comes up with 110 sectors.
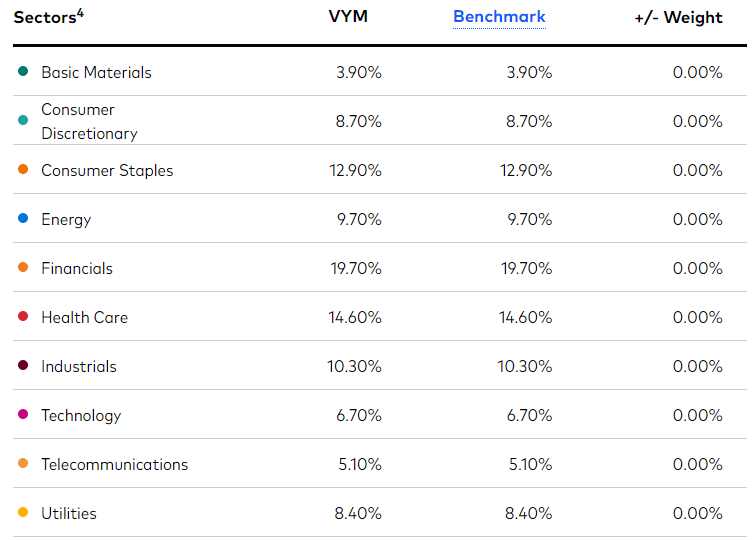
investor.vanguard.com VYM sectors
With only four sectors (out of 10) over 10% of the portfolio and none over 20%, no single sector dominates the portfolio, unlike many Large-Cap ETFs (think Tech stocks).
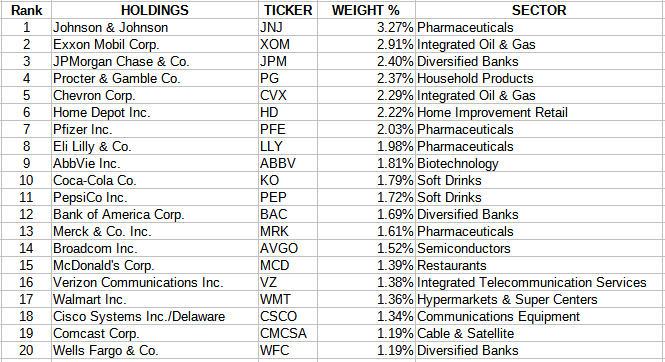
Top holdings
This data is from the Vanguard website that has the more precise sector allocations. Here is a list of all the ones with a 3+% weight.
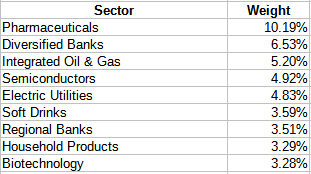
advisors.vangaurd.com; compiled by Author
advisors.vangaurd.com; compiled by Author
Even with a portfolio of over 400 stocks, the Top 20 still comprise 37% of the portfolio weight. That said, currently only one stock is over 3% of the portfolio.
VYM distribution review
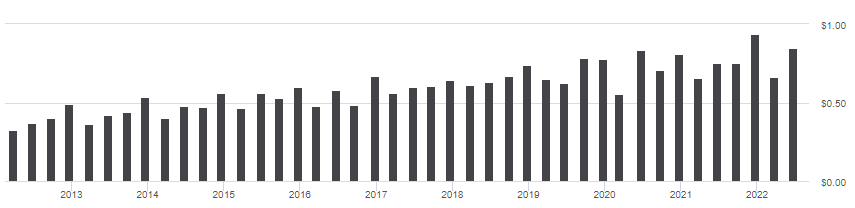
seekingalpha.com VYM DVDs
VYM has shown a fairly consistent payout CAGR between 6-9% over the past ten years. This has helped them earn an “A” from Seeking Alpha on this metric.
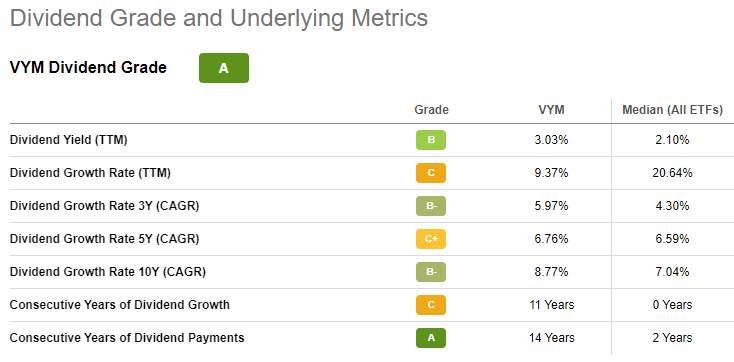
seekingalpha.com VYM scorecard
Vanguard Large-Cap ETF review
Seeking Alpha describes this ETF as:
The investment seeks to track the performance of the CRSP US Large Cap Index that measures the investment return of large-capitalization stocks. The fund employs an indexing investment approach designed to track the performance of the CRSP US Large Cap Index, a broadly diversified index of large U.S. companies representing approximately the top 85% of the U.S. market capitalization. The advisor attempts to replicate the target index by investing all, or substantially all, of its assets in the stocks that make up the index, holding each stock in approximately the same proportion as its weighting in the index. VV started in 2004.
Source: seekingalpha.com VV
VV holds $36.7b in AUM and has a trailing yield of 1.42%. For VV, Vanguard only charges 4bps in fees. Vanguard classifies VV as a Large-Cap Blend ETF.
CRSP US Large Cap Index review
CRSP, or the Center for Research in Security Prices, provides this brief description of the Index used by the VV ETF:
The CRSP U.S. Large Cap Index includes U.S. companies that comprise the top 85 percent of investable market capitalization. The index includes securities traded on NYSE, NYSE American, NYSE ARCA, NASDAQ, Bats Global Markets and the Investors Exchange. Reconstitution occurs quarterly after the market close on the third Friday of March, June, September, and December. The transition period begins after the close of the Wednesday (first transition day) after the second Friday of March, June, September, and December, and ends (final transition day) after the close of the Tuesday after the third Friday of March, June, September, and December.
Source: crsp.org Index
The Index holds 568 stocks with market-caps from $2t down to $829m, with an average size of $57b. For those interested in its construction, CRSP provides an Index Methodology PDF also.
VV holdings review
Basic portfolio data points provided by Vanguard are:
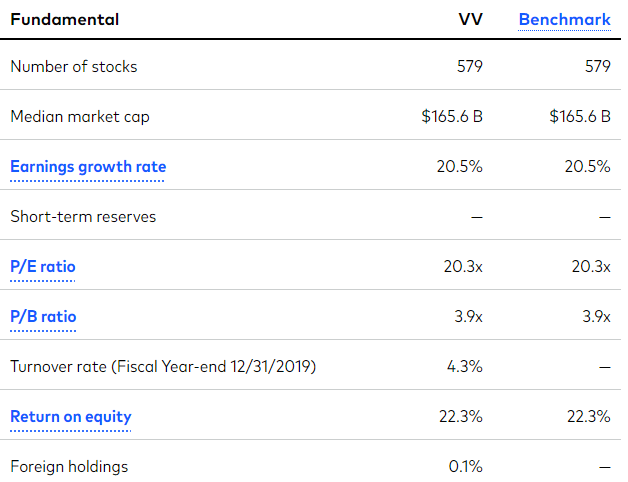
investor.vanguard.com VV
The limited sector allocation, using the same scale as for VYM above, shows the following allocations.
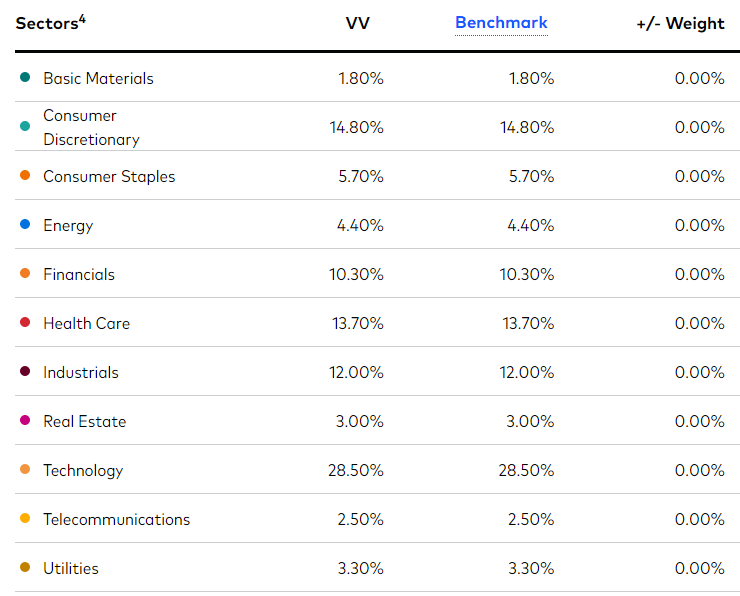
investor.vanguard.com VV sectors
While I will go into sector comparisons later but notice the Technology weight here: 28.5%. VYM’s top sector, Financials, places 5th in VV.
Top Holdings
Again using the more precise sector allocations, those with 2.48% weighting or more were:
advsors.vanguard.com; compiled by Author
The more detailed sectors shows how the Technology sector comprises many different activities.
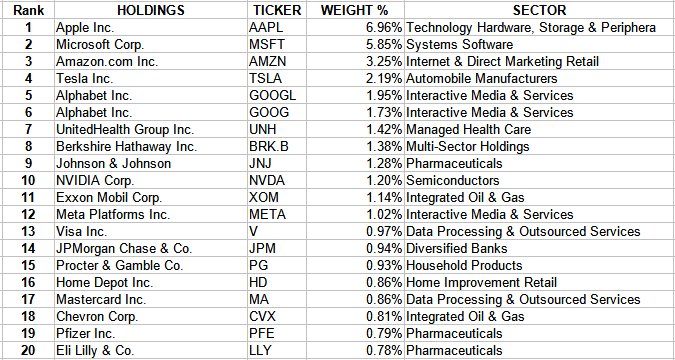
advisors.vanguard.com; compiled by Author
Like VYM, the Top 20 amount to 37% of the portfolio of 579 stocks. Here three stocks have a 3+% weighting. Their results are critical as just those three stocks are 16% of the portfolio: all classified as Tech stocks.
VV distribution review
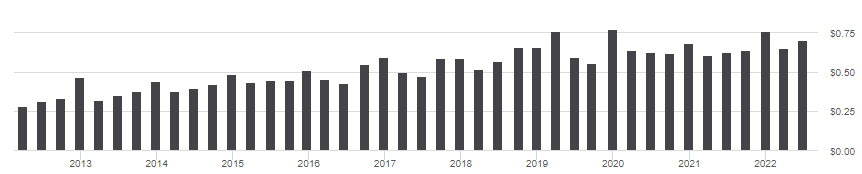
seekingalpha.com VV DVDs
Their lower payout growth rate helps explain the slightly lower overall dividend grade of “B+”. That said, the pattern of growth has been above 5% until recently.
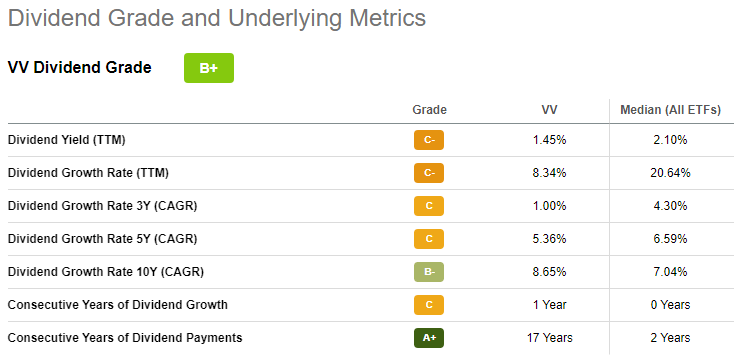
seekingalpha.com VV scorecard
The importance of Consecutive Years of Dividend Payments has in achieving an overall high grade for dividends is obvious as it is the only sub-grade higher than the overall grade.
Comparing ETFs
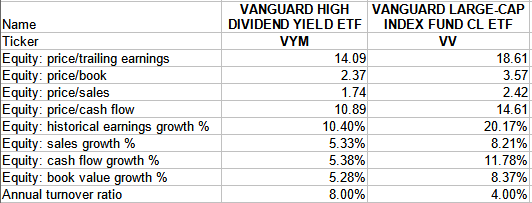
Along with knowing returns and yields, trying to understand how each ETF achieved those results is important. While the following data is point-in-time, these factors usually do not change much over time.
| Large-Cap | Mid-Cap | Small-Cap | Median MC | |
| VYM ETF | 92.3% | 6.8% | 0.9% | $132b |
| VV ETF | 98.2% | 1.8% | 0.0% | $166b |
The VV ETF is more focused on Large-Cap stocks than VYM, and within that segment, the biggest ones as its average market-cap is 2X that of VYM, $184b to $94b, with the median market-cap higher too.
Fidelity.com; compiled by Author
The Price ratios favor VYM as being more Value (expected), while the growth ones point to VV being more Growth orientated (expected also). The next charts show how the divergent strategies result in sector and holding differences.
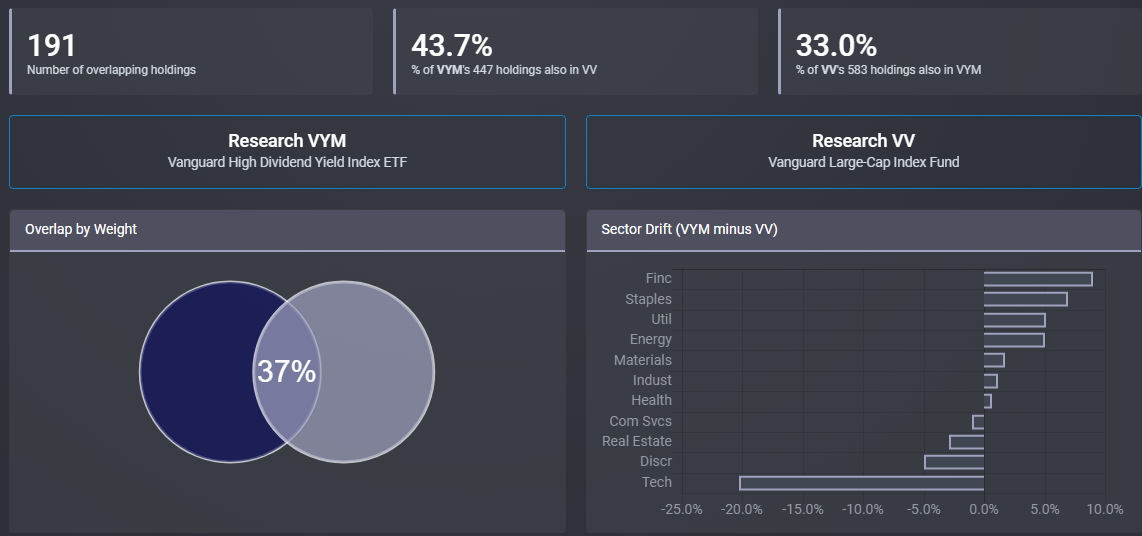
ETFRC.com
Compared to others I have done, a 37% weight overlap is on the low side and having a sector, here being Tech stocks, with a weight spread over 20% being one of the biggest I have seen. One benefit is owners of both ETFs are not “doubling up” on a majority of the stocks in either ETF. The next table shows the biggest weighting differences, both ways, between VYM and VV.
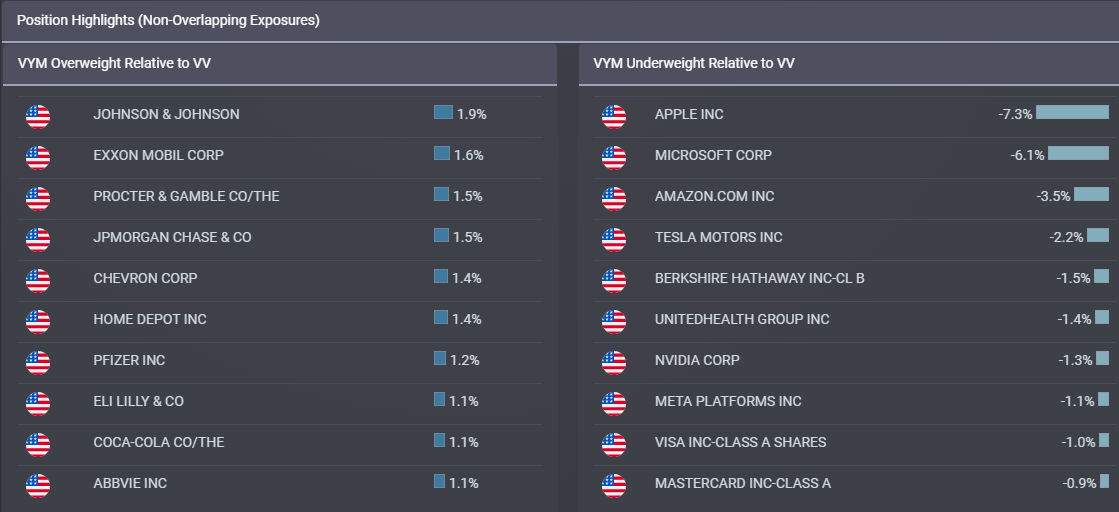
ETFRC.com
VYM doesn’t own any shares in the stocks shown as being underweight compared to VV; that is not the case for the stocks underweighted in VV versus VYM. Owning VYM would go well with any ETF that is heavily allocated to the large US Technology stocks.
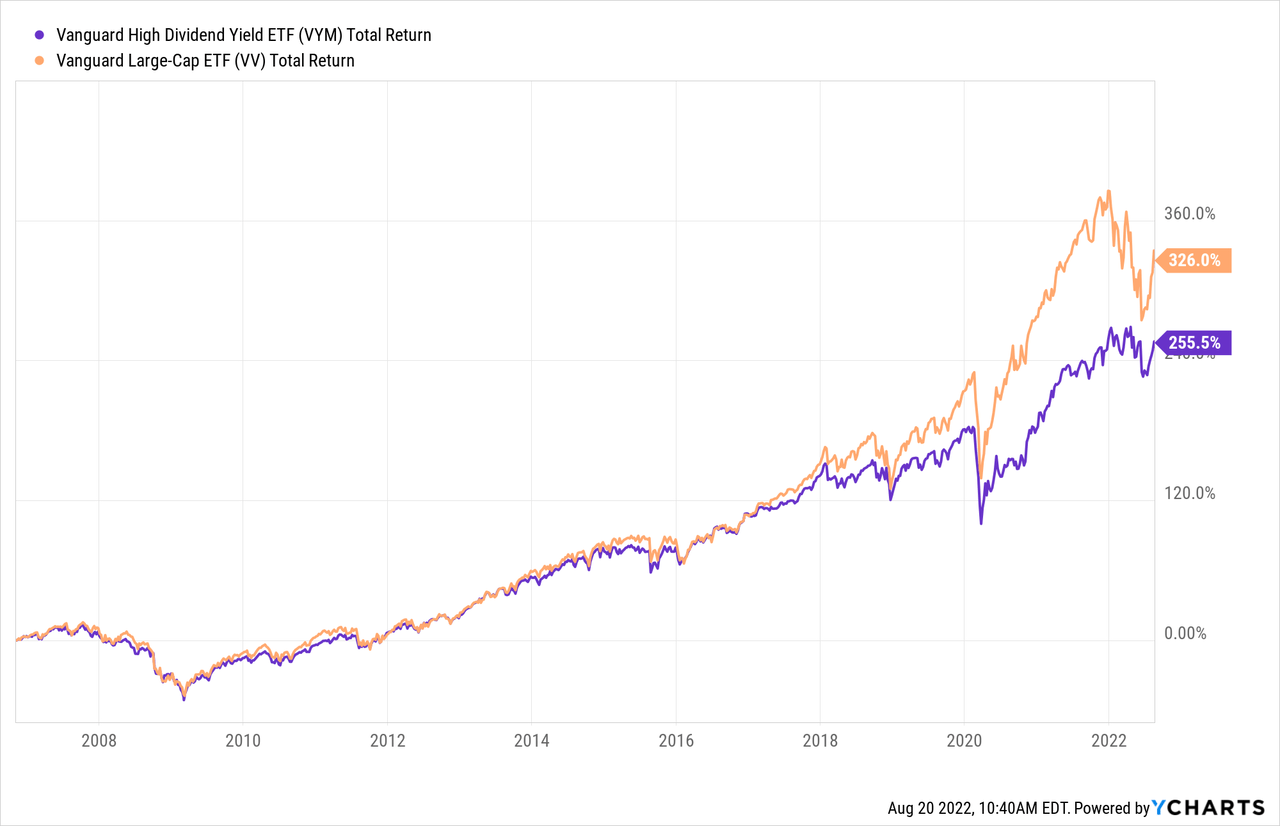
CAGR and risk review
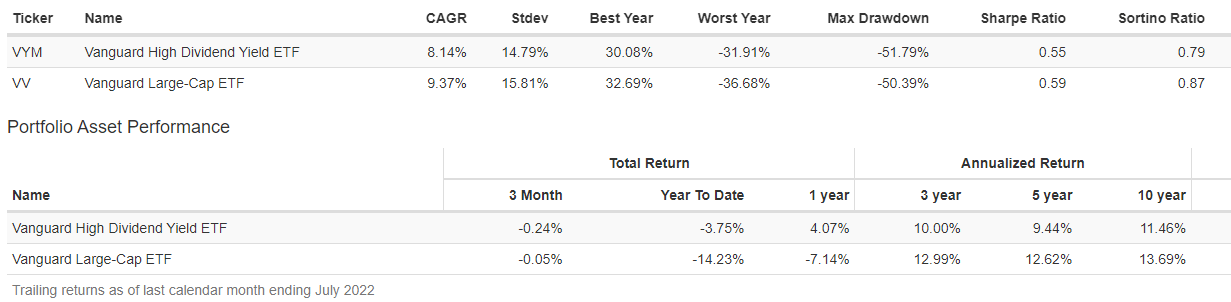
PortfolioVisualizer.com
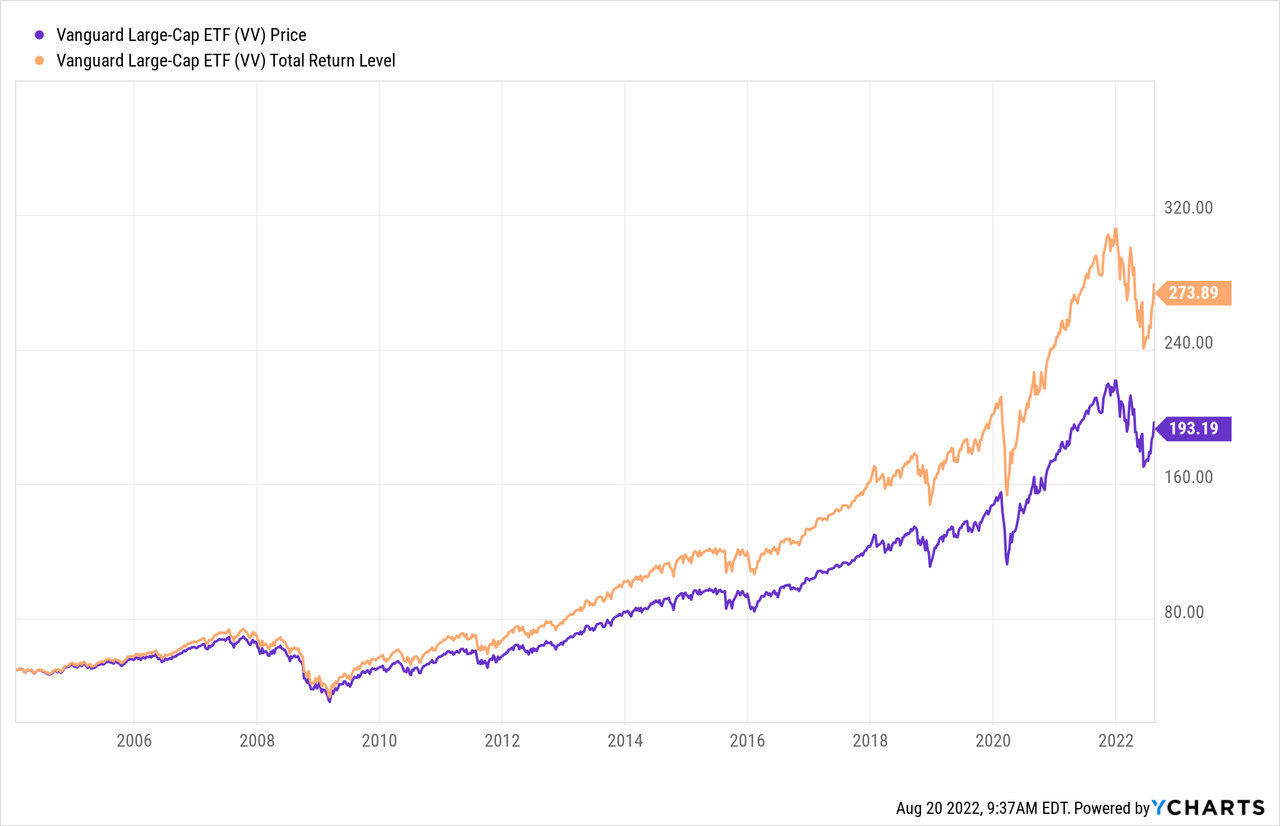
The above chart and data illustrate how sector allocations can drive results. When big Tech soared, so did VV. In 2022, it shows the negative effect of overweighting a poor performing sector. Since 2006, VV has the better CAGR and risk results, though both of those data points are reverse in 2022. Of course, for investors wanting more income, the 2X yield of VYM to VV might be worth accepting a lower total return. Another comparison is based on reinvestment strategy.
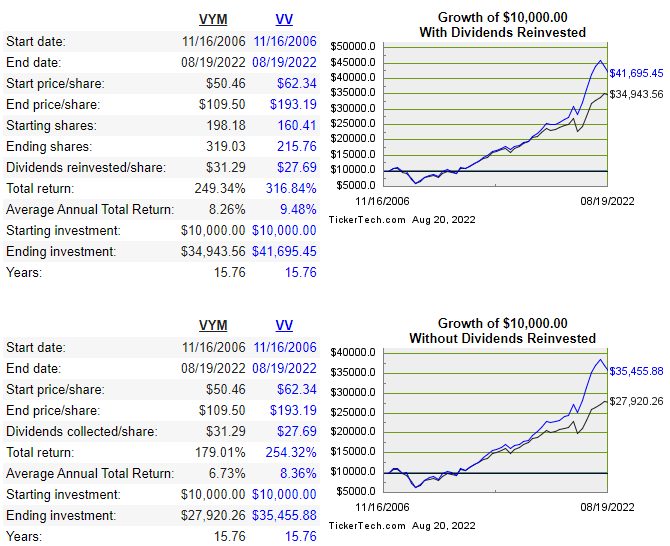
dividendchannel.com
Investors who chose to reinvest their dividends had a smaller reduction in total return, 122bps to 163bps over those who took the dividends. More recently, the gap favored those who reinvested.
Portfolio strategy
With Vanguard considering VYM a LC-Value ETF, I compared it to the four ETFs Vanguard also classifies as LC-Value. As a note, the Vanguard Value ETF (VTV) uses the Value version of the CRSP index used by VV.
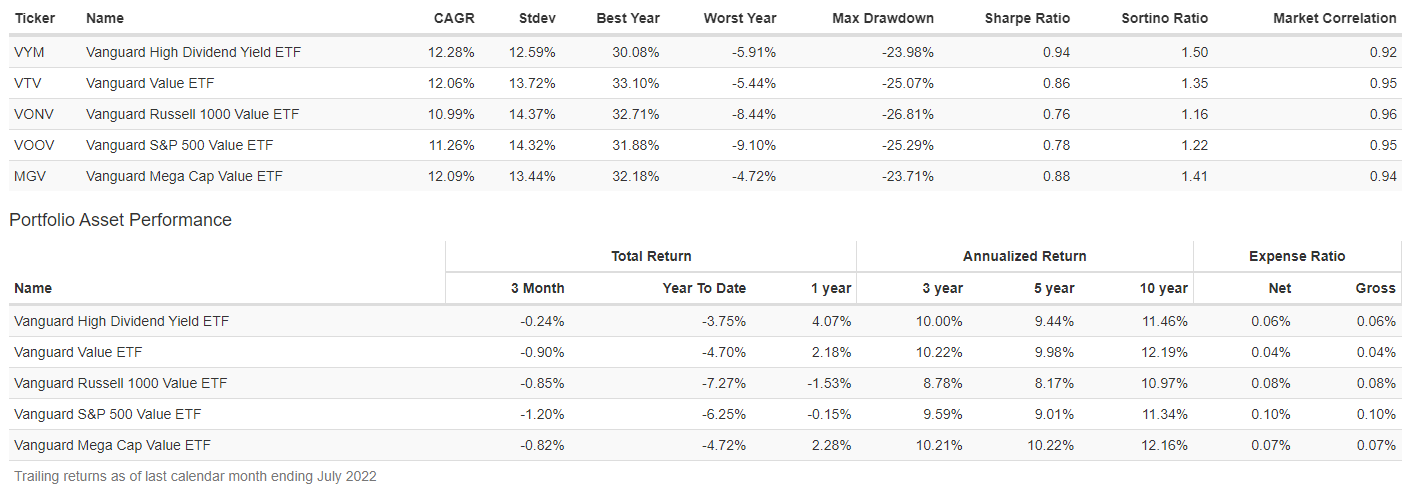
PortfolioVisualizer.com
These funds show a current 54-71% holdings (by weight) overlap with VYM. There are sector differences that varied by ETF. VYM has shown slightly better returns from late 2010, along with slightly better risk data. While both the VTV and the Vanguard Mega Cap Value ETF (MGV) have better (slightly) 3-yr returns, VYM was again on top over the past year thanks to the weakness in the big Tech stocks. Currently, VYM also has the best yield of the LC-Value ETFs shown here. Bottom line from my view is Value seems to be driving VYM results as much if not more than their investing in higher yielding stocks.
Final thoughts
Seeking Alpha evaluates and grades ETFs on multiple factors, and provides a summary of how their Authors and Quant rate each ETF.
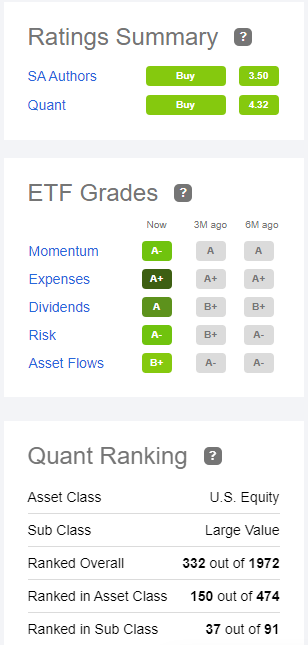
seekingalpha.com VYM homepage
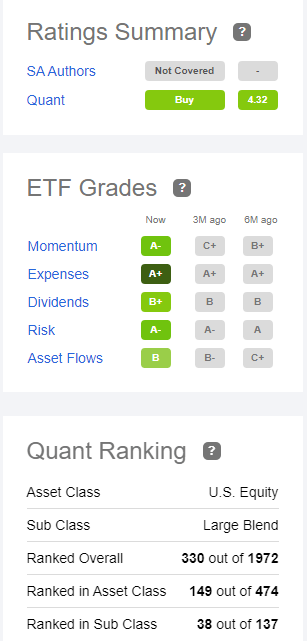
seekingalpha.com VV homepage
VV’s ranking within the US Equity asset class is one notch higher than VYM’s. Here is a link into Seeking Alpha’s process behind the above.
Owning both the VYM ETF and VV ETF would provide good combination for investors wanting Large-Cap stocks. Both provide complete holdings lists to get exact list of the overlap, which is respectively low for two ETFs with the same basic market-cap focus.
Be the first to comment