

tum3123
Investment thesis and background
This article examines two popular emerging market funds: the Vanguard FTSE Emerging Markets ETF (NYSEARCA:VWO) and iShares Emerging Markets Dividend ETF (NYSEARCA:DVYE). The article is motivated by the following two considerations.
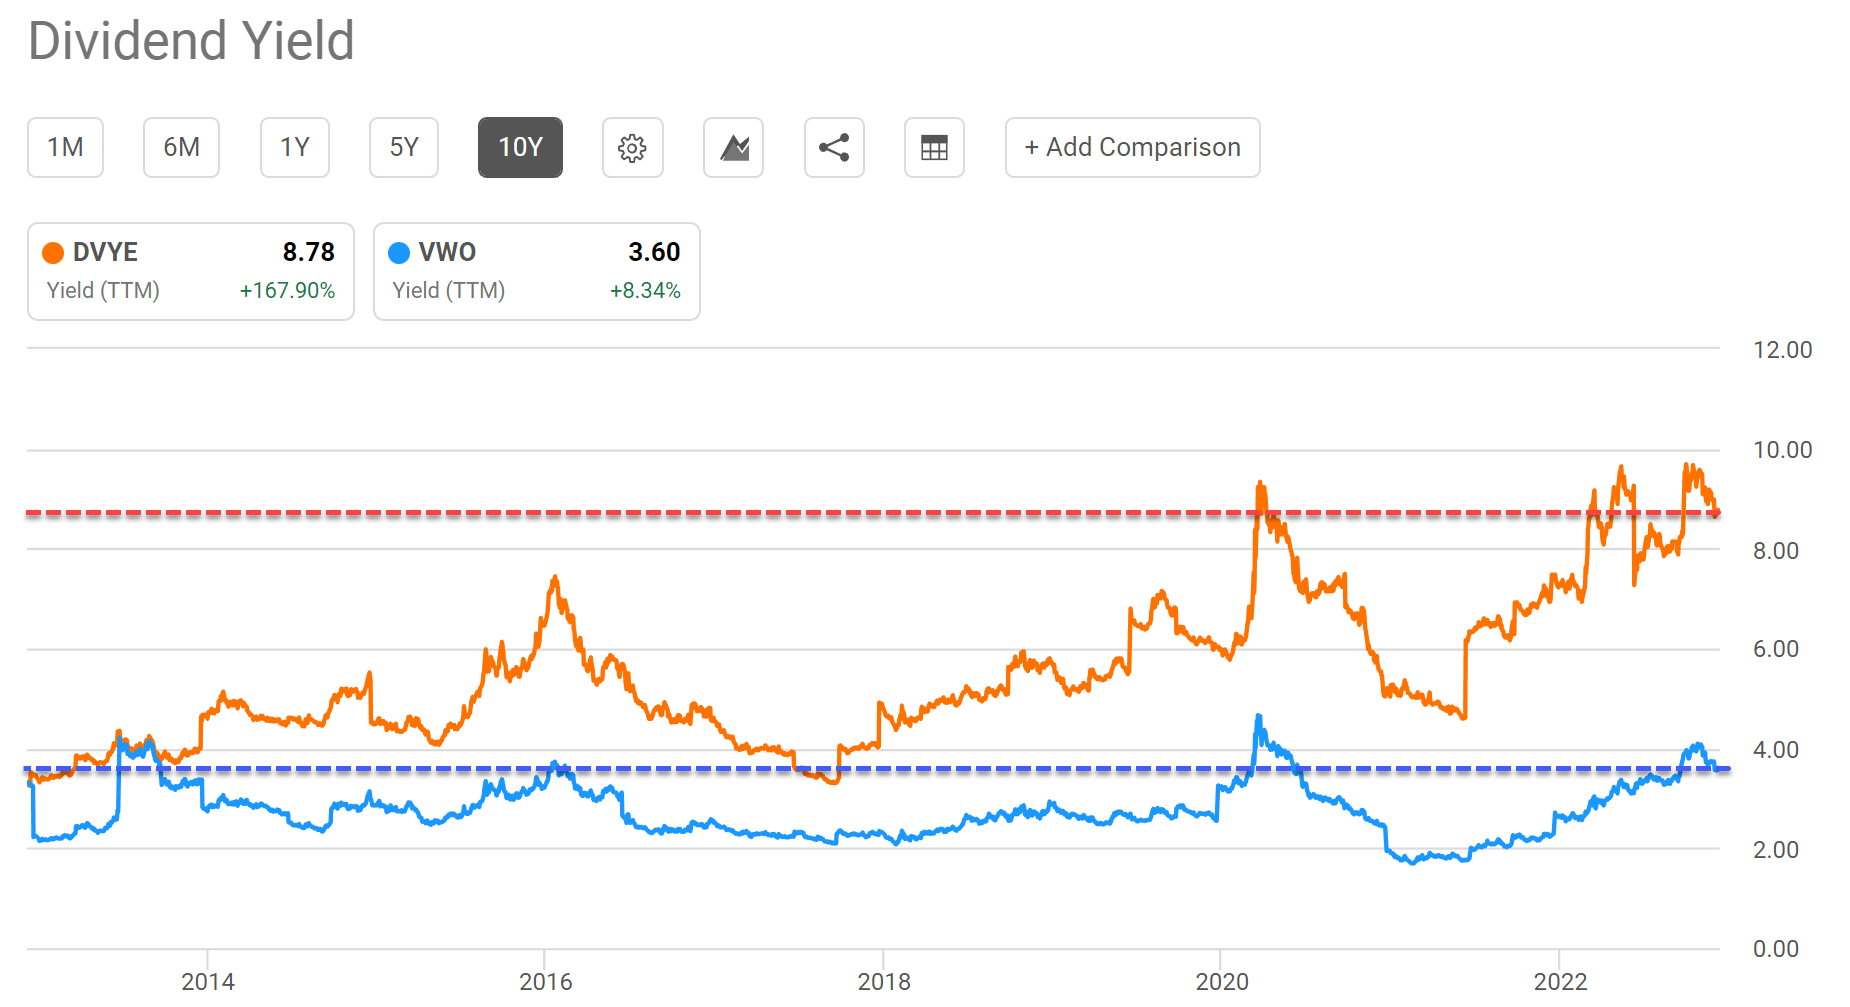
The first consideration is the valuation contraction. As you can see from the following table, DVYE’s is currently yielding 8.78%, which is higher than its 4-year historical average of 6.86% by nearly 30% (+27.9% to be more precise). VWO’s picture is quite similar. Its current yield of 3.60% is also about 30% above its historical average of 2.81% too (+28.1% to be more precise). As you can see from the second chart below, their current levels of dividend yields are attractive over an even wider time frame too. Both are currently yielding near the peak levels in the past decade as seen.
The second consideration is that they can both provide good geographical diversification to your portfolio. As our readers know, our investing philosophy is fundamentally shaped by Ray Dalio. And we firmly believe that geographical diversification should be one of the first key steps in the overall scheme of things. And in the remainder of this article, we will explore how both VWO and DVYE can play such a role, especially for investors whose exposure is primarily U.S.-focused.
Source: author and Seeking Alpha data. Source: author and Seeking Alpha data.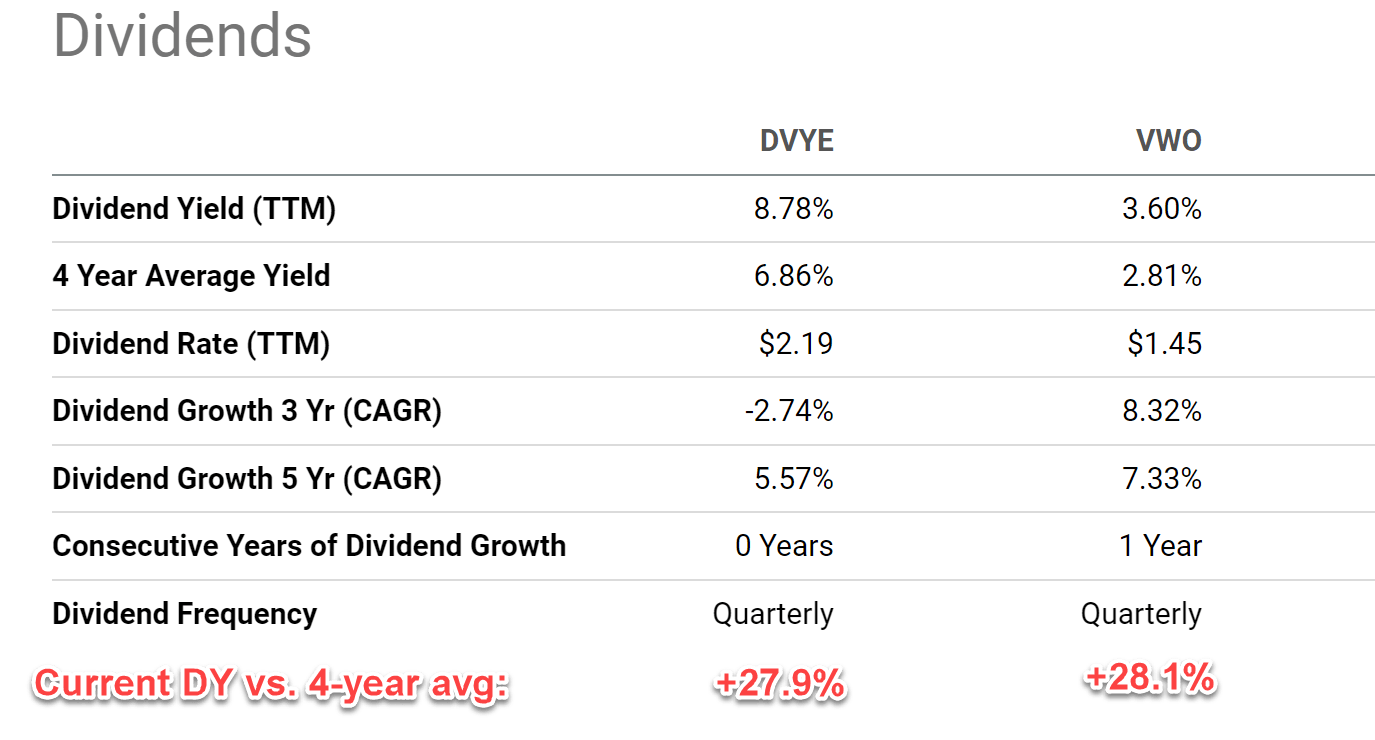
VWO and DVYE: Basic information
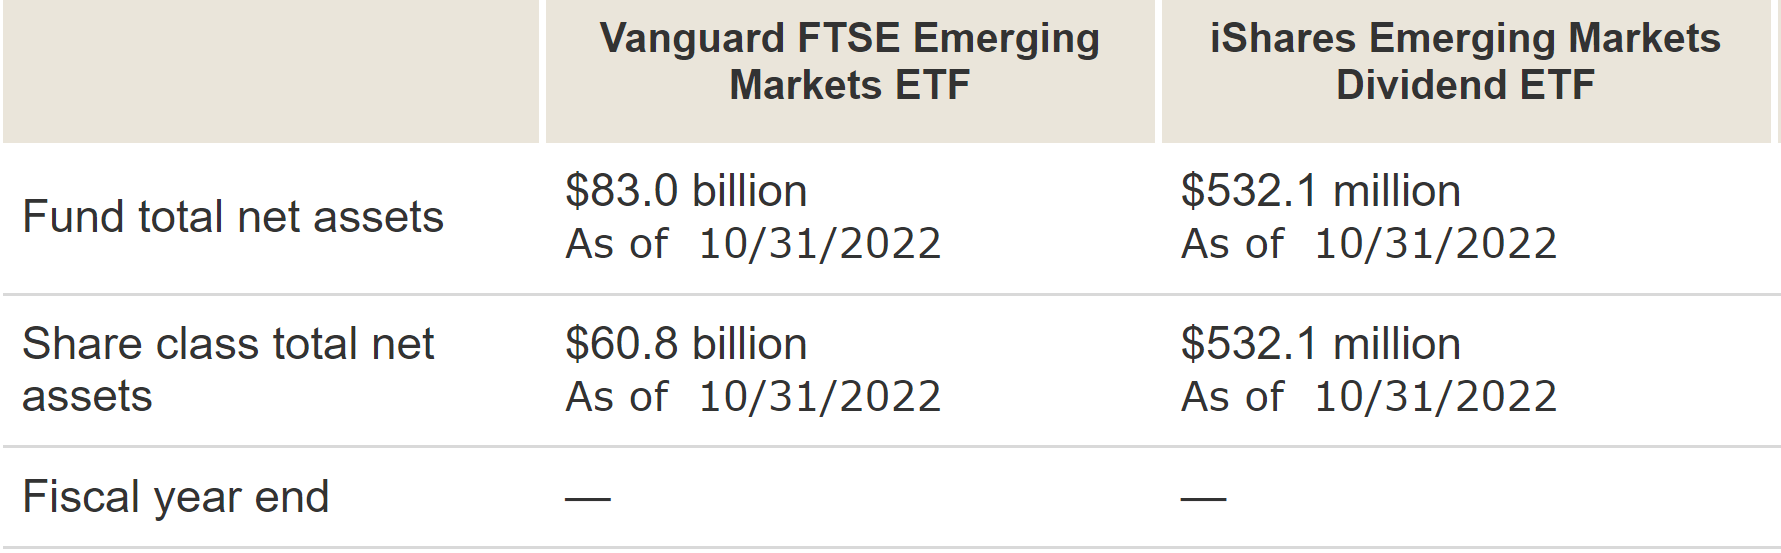
Let’s first take a look at the basic information for VWO and DVYE. Both are Diversified Emerging Markets ETF funds. The DVYE fund is the smaller one here, with only $532 million of AUM. In contrast, VWO is one of the largest funds in this space, with more than $60 billion of AUM under management. Thanks to its scale, VWO features a rock-bottom fee of 0.08%, while DVYE charges a much higher fee of 0.49%.
The more fundamental differences are in the indexing method. VWO tracks the FTSE Emerging Markets index and holds more than 5,500 stocks, while DVYE tracks ~100 dividend-paying emerging market stocks. More details are provided in their fund description below (quoted and slightly edited by me):
VWO description: The fund invests in stocks of companies located in emerging markets around the world, such as China, Brazil, Taiwan, and South Africa. Its goal is to closely track the return of the FTSE Emerging Markets All Cap China A Inclusion Index. It has high potential for growth, but also high risk; share value may swing up and down more than that of stock funds that invest in developed countries, including the United States. It is only appropriate for long-term goals.
DVYE description: The DVYE ETF fund seeks to track the investment results of an index composed of relatively high dividend paying equities in emerging markets. It provides exposure to a broad range of established companies in emerging markets countries and access to 100 dividend-paying emerging market stocks. It can be used to expand income strategies to emerging markets
Source: Vanguard.com Source: Vanguard.com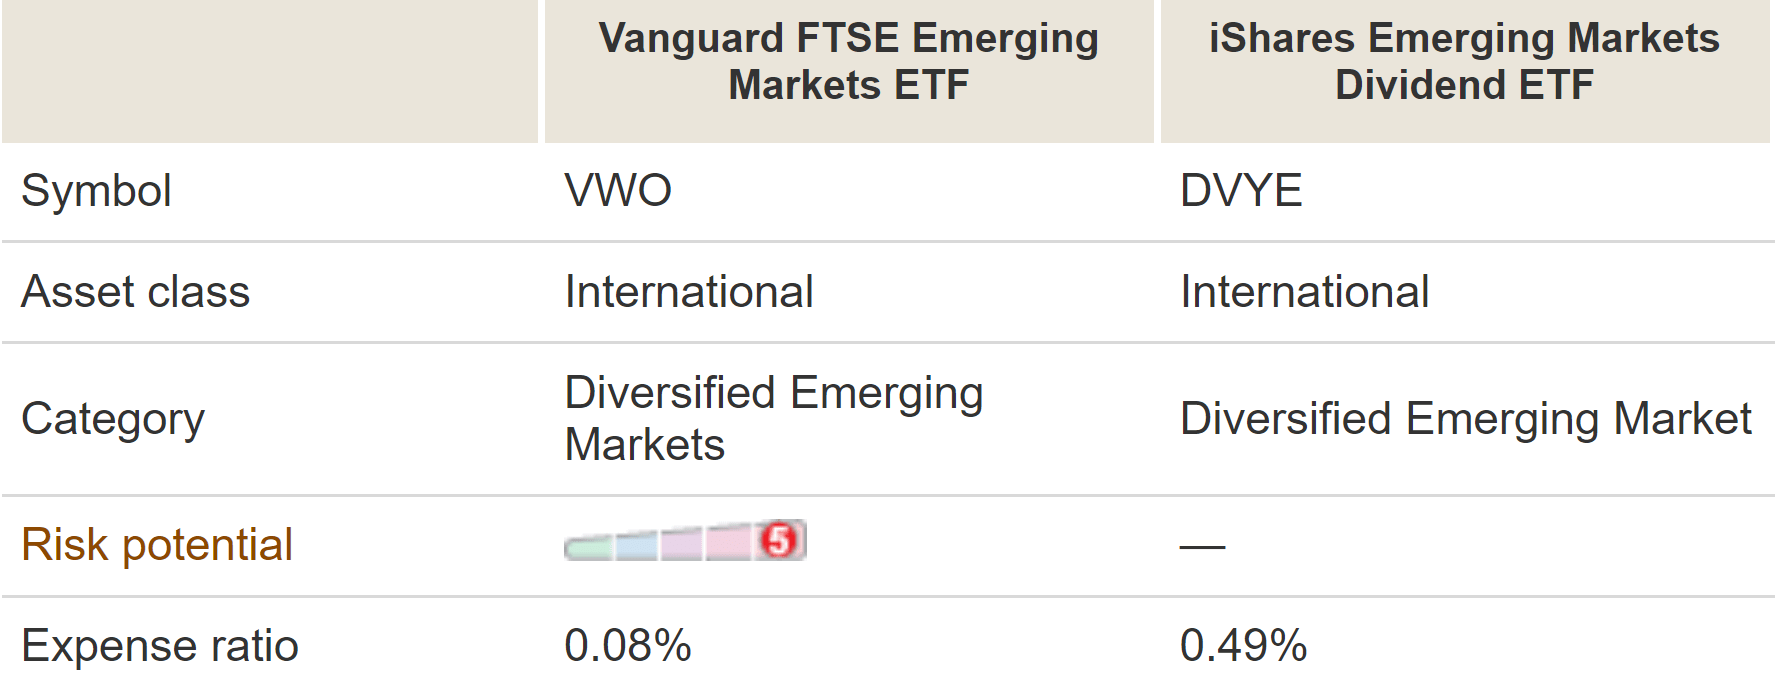
DVYE and VWO: Geographical diversification
Based on the above introduction, the top 10 holdings for DVYE and VOW are listed next to provide a better idea of their holdings. As seen, both funds are heavily invested in the developing countries such as China, India, and Brazil. To wit, China is the largest exposure for VWO, representing 28.9% of its asset. And Brazil is the largest exposure for DVYE, representing 31.7% of its total asset.
Source: Vanguard.com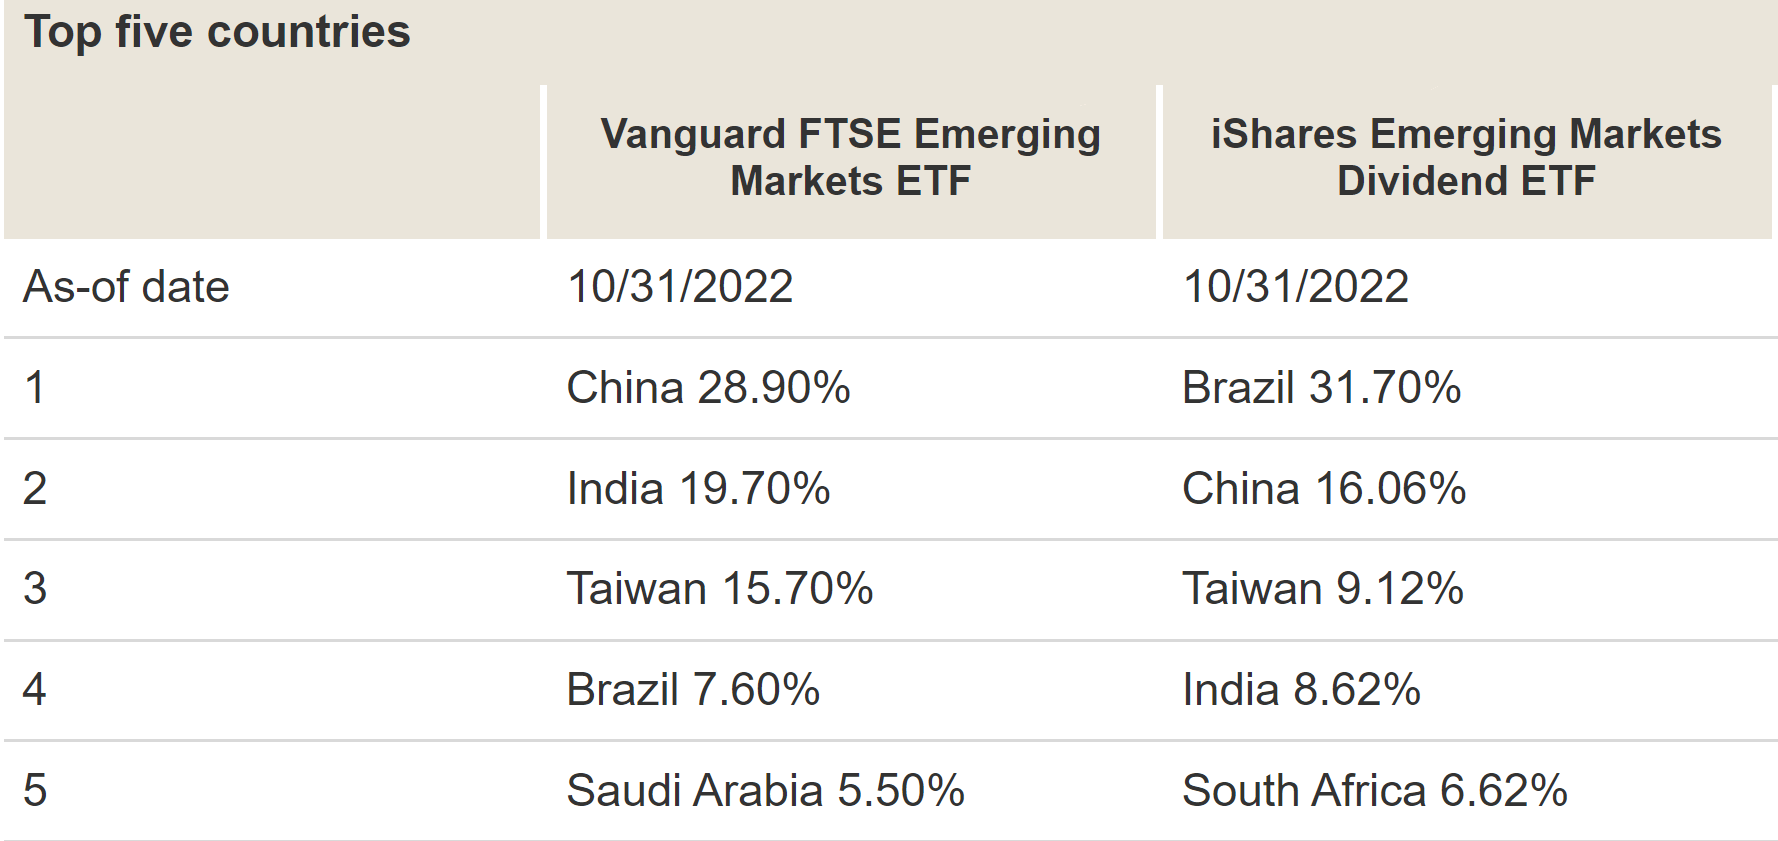
As aforementioned, we firmly believe that geographical diversification should be one of the first key steps in the overall scheme of investing. As seen from the next table, both DVYE and VWO can serve as a good diversifier for investors whose exposure is U.S.-focused due to their geographical exposure. To wit, DVYE’s correlation against the S&P 500 (approximated by SPY) is only 0.67, an even lower 0.56 against the U.S. tech sector (approximated by QQQ), and only 0.61 against the U.S. small caps (approximated by IWM). The correlation of VWO relative to these major U.S. indices are similarly low: in a range between 0.70 to 0.63.
Source: Portfolio Visualizer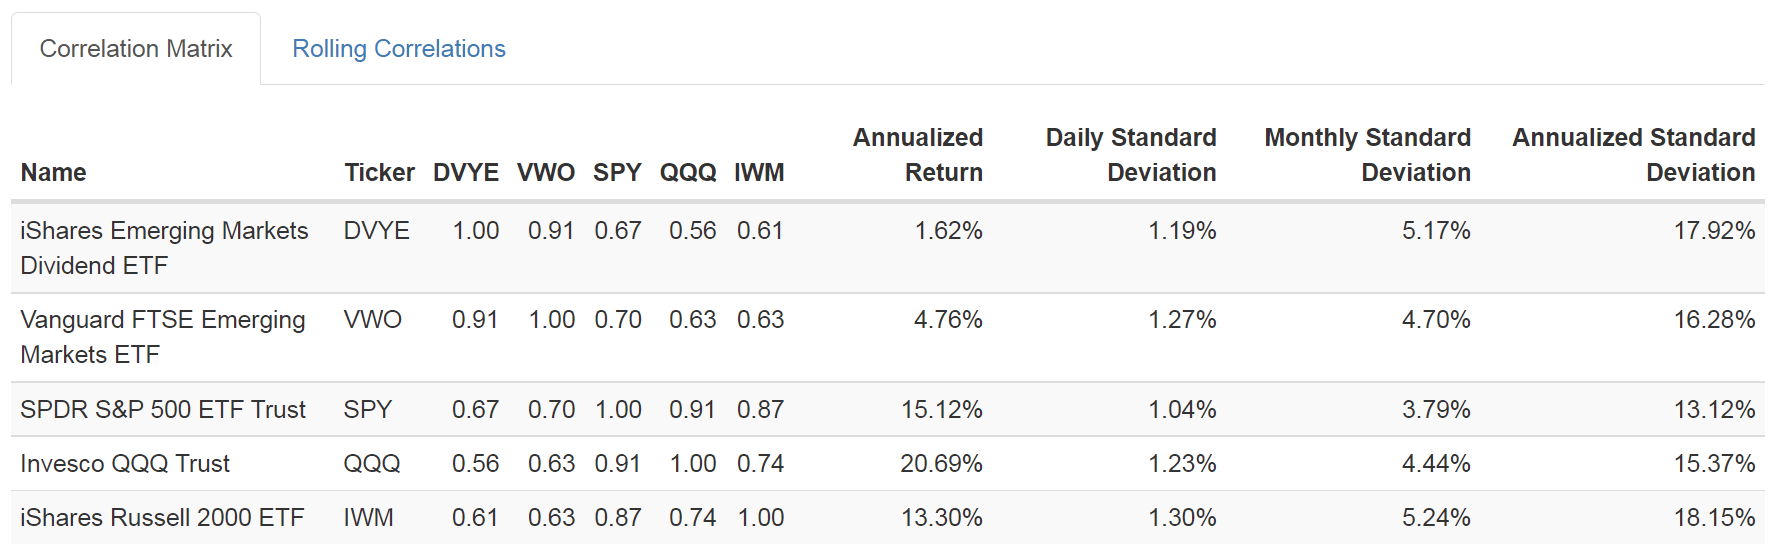
DVYE and VWO: Valuation compression too large to ignore
After years of underperformance (more on this later), the valuation multiples of emerging markets have become very attractive at this point, both in absolute terms and relative terms.
As you can see from the following table, DVYE’s P/E ratio is only 4.6x and it’s selling at a 30% discount from its book value (P/BV ratio of 0.7x). The picture for VWO is similar. VWO’s P/E ratio is 9.7x and its P/BV ratio is 1.8x. Note VWO’S valuation premium relative to DVYE is justified the way I see things. For one thing, the medium market cap in VWO is $15.8 billion, more than four times higher than the medium market cap in DVYE. Larger companies provide better scale, stability, and safety.
Source: Vanguard.com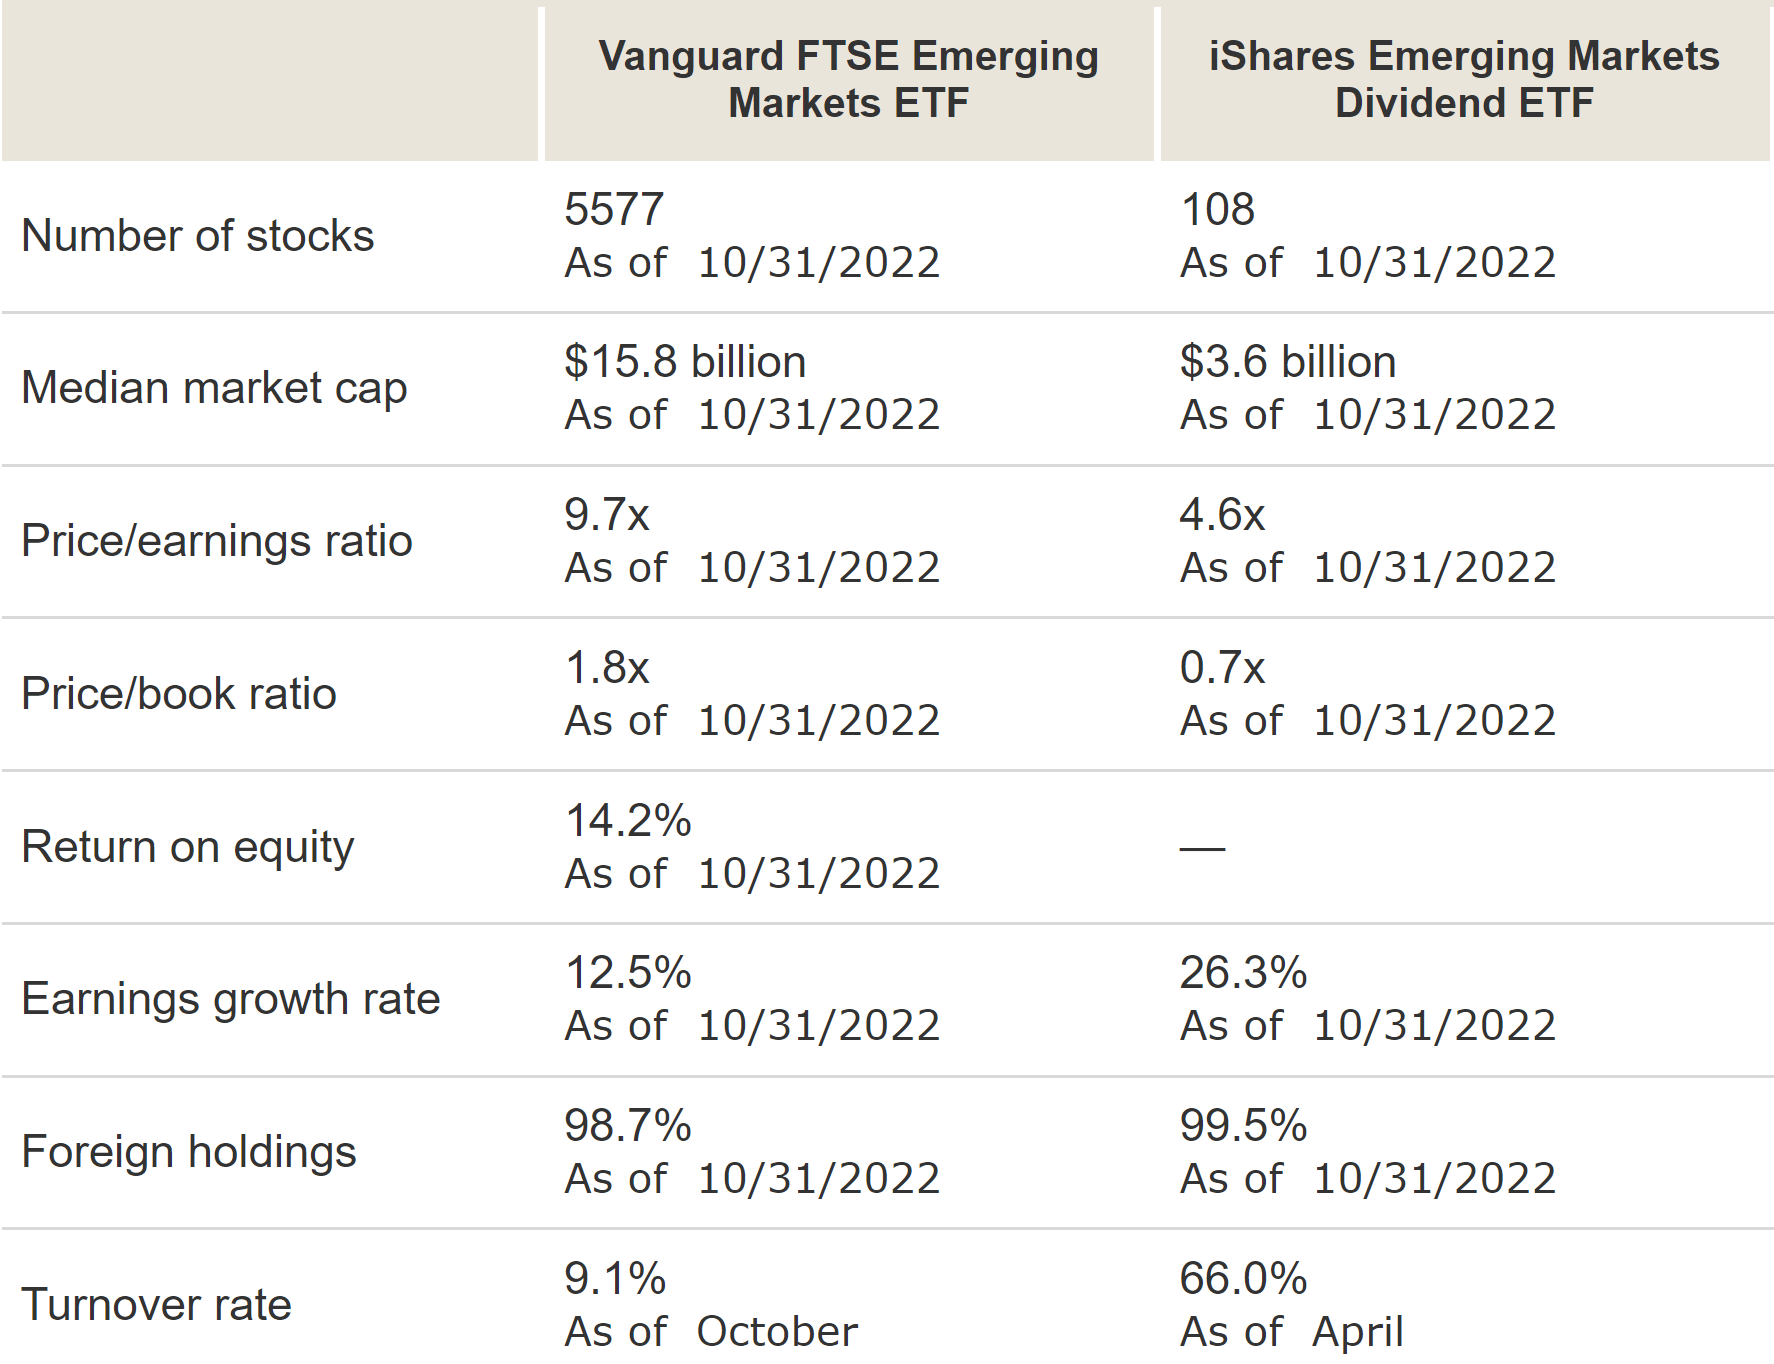
DVYE and VWO: Past performance
As aforementioned, the main reason for their current cheap valuation is years of price underperformance as seen in the chart below. VWO delivered an annual total return of 1.76% CAGR between 2013 and now. And DVYE suffered an annual total return of -2.65% CAGR in the same period. In contrast, the overall U.S. market went through one of the most remarkable bull runs (delivering about 13.2% CAGR in this same period).
And my view is that given how compressed their valuations are now, I see a much brighter return potential for the years to come.
Source: Portfolio Visualizer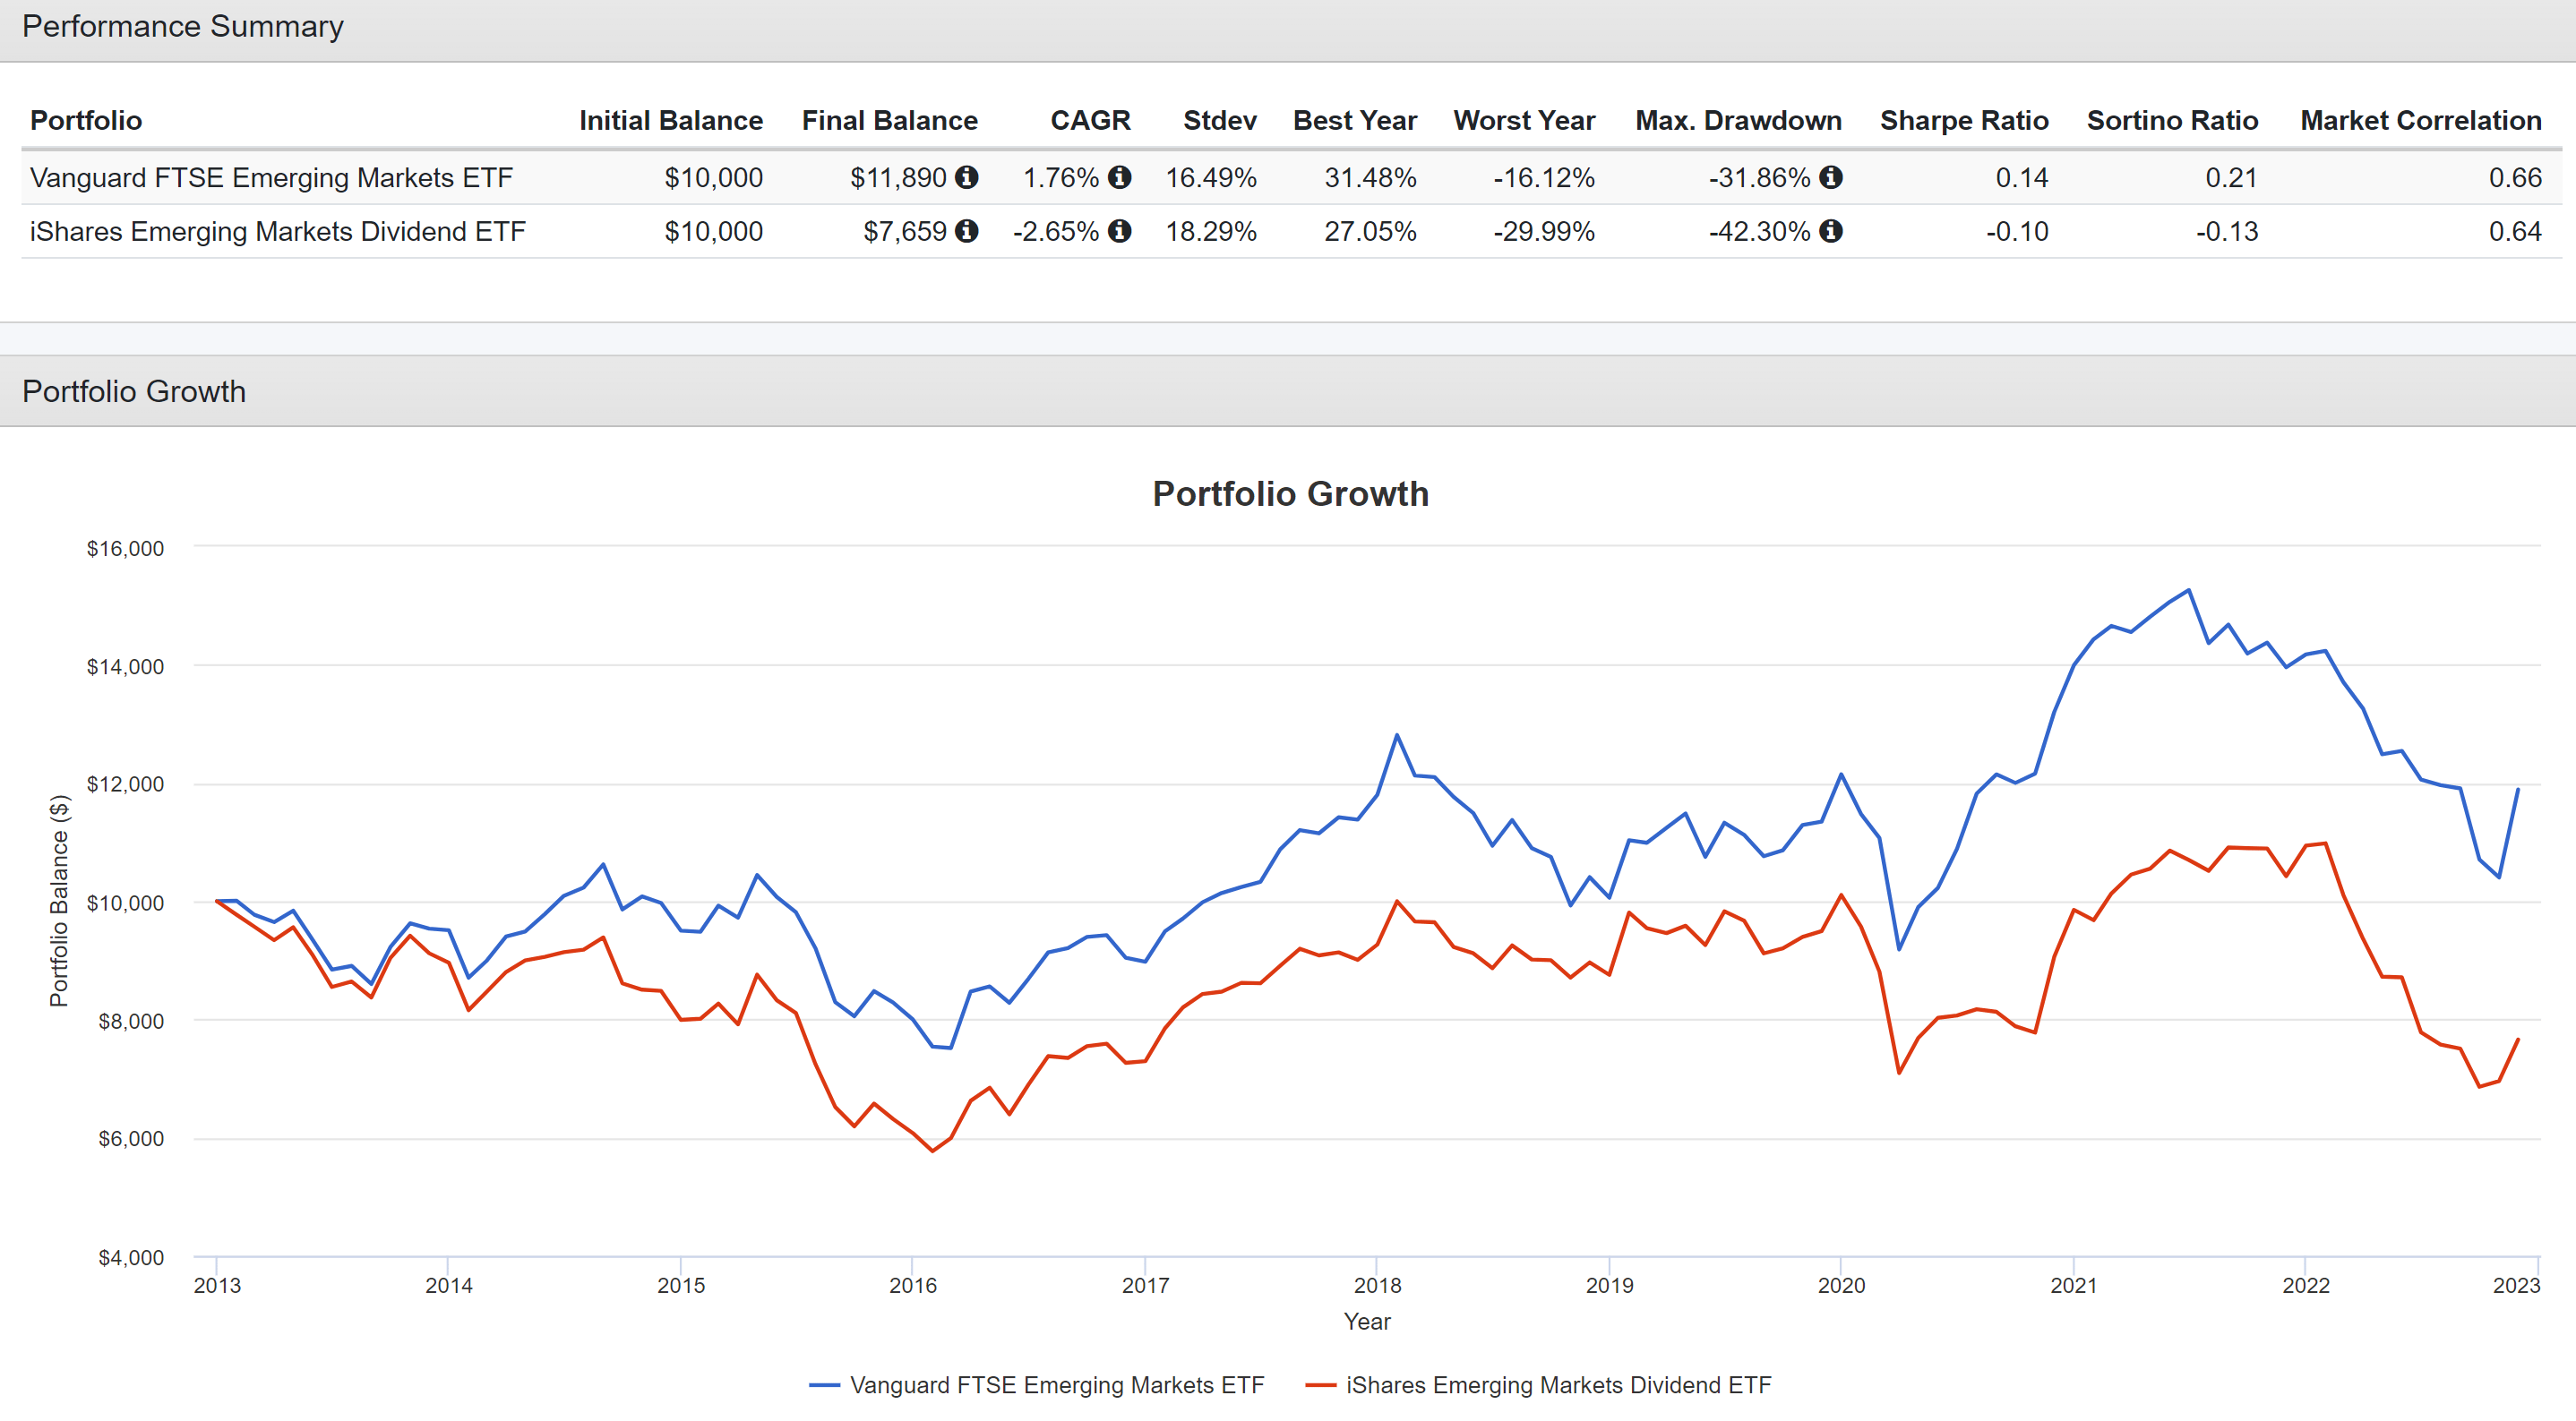
Other risks and final thoughts
Besides the risks of underperformance mentioned above, investing in emerging markets also entail other risks as well. Due to their indexing method, the size and scale of the companies in these funds are much smaller than the S&P 500. As a result, both DVYE and VWO have suffered much larger volatility risks in the past as seen in the chart below. In particle, DVYE has suffered volatility both higher than the S&P 500 VWO and also VWO (after all, it has the smallest media market cap). To wit, it has suffered larger standard deviations (18.3%, compared to VWO’s 16.5% and SPY’s 14.7%), larger worst year losses (30%, compared to VWO’s 16% and SPY’s 13%), and a worse max drawdown (42%, compared to VWO’s 31% and SPY’s 23%).
Source: Portfolio Visualizer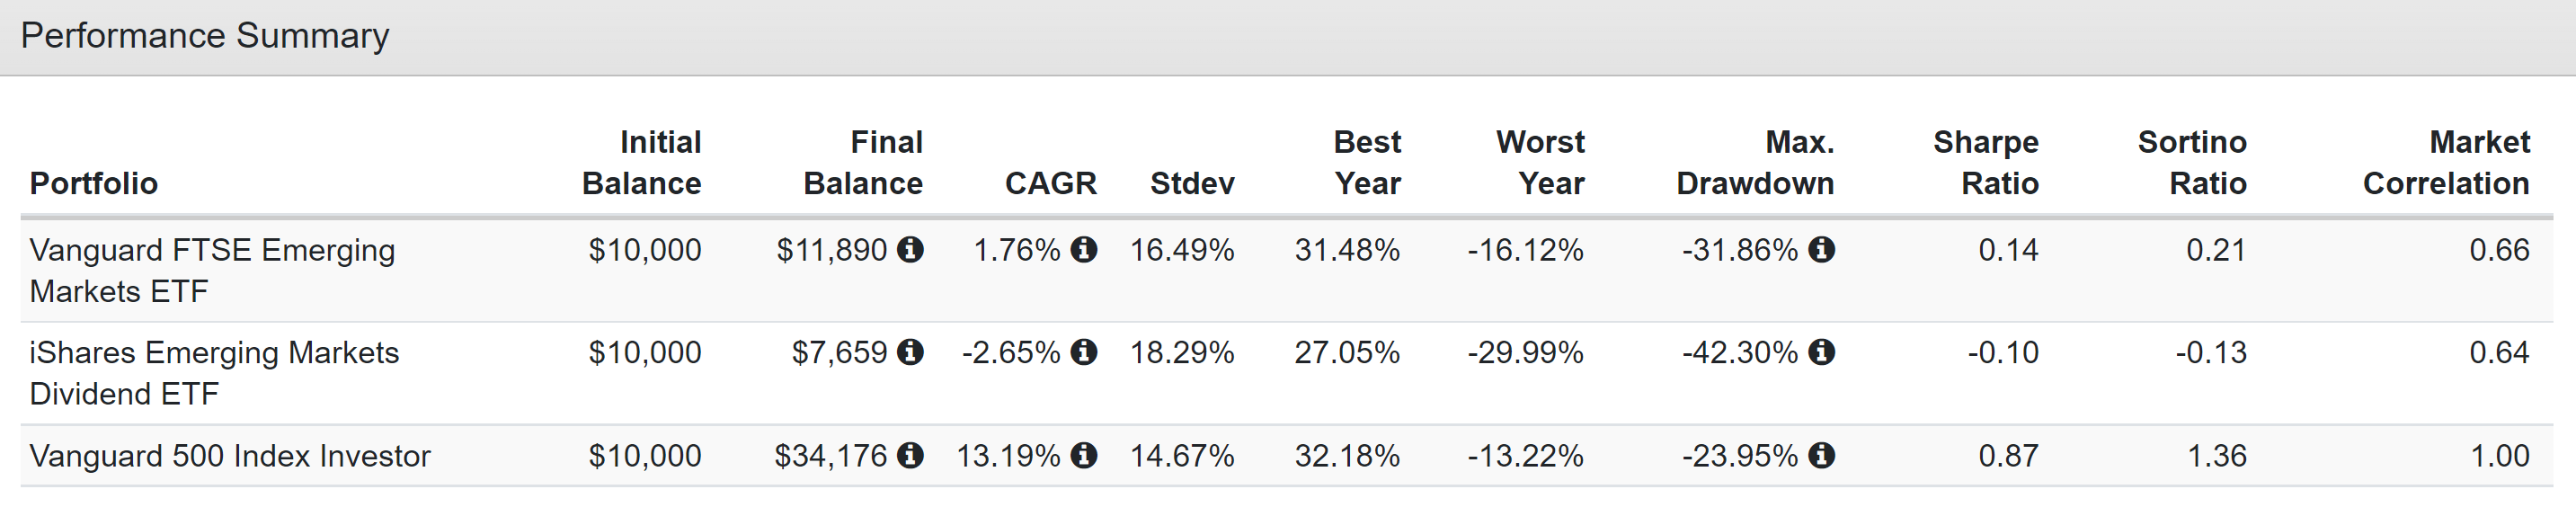
All told, I see both VWO and DVYE as attractive candidates under current conditions. The valuation for emerging markets has become too compressed to ignore. In terms of dividend yields, both DVYE and VWO are discounted by about 30% compared to their historical levels. In terms of P/E ratios, both DVYE and VWO are selling in the single digits. And DVYE is even selling at a 30% discount from its book value with a P/BV ratio of 0.7x. Furthermore, both VWO and DYVE can serve as good geographical diversifiers for investors whose exposure is primarily U.S.-focused. The correlation of both VWO and DYVE relative to these major U.S. indices are quite low: only in a range between 0.70 to 0.56 historically.
To conclude, I do not see a bad choice here. Investors just need to pick the fund that is aligned with their individual risk tolerance and goals. DVYE is better suitable for income-oriented investors, with its focus on high-dividend stocks. It has been yielding substantially higher than VWO in the past. And its current yield of 8.78% is more than 2x higher than VWO’s 3.6%.
Be the first to comment