

Torsten Asmus
Recessions tend to be tough on risk assets. Stocks normally take a major tumble starting before the recession is visible and begin to recover before the recession ends. It’s pretty much inevitable. Not every market decline is linked to a recession but pretty much every recession is accompanied by a decline in stocks. That being said, not all stocks react in the same way. Stocks with products consumers can’t do without (consumer staples, utilities, financials, and health care) often do better while industry areas like consumer discretionary, which encompasses products customers can do without, generally do worse. The categories of “growth” and ‘value” divide the market as a whole into broad categories that tend to underperform or outperform in “ordinary” recessions. To simplify the comparison, I am going to use the Vanguard Growth ETF (NYSEARCA:VUG) and the Vanguard Value ETF (NYSEARCA:VTV) to define the categories.
VUG and VTF are helpful because both use the CRSP (Center For Research in Security Prices) indexes developed by the University of Chicago Booth School of Business. Six factors define “growth”: long and short term earnings growth, 3-year historical growth in sales and earnings, the ratio of investment to assets, and return on assets. It’s all about the future and contains nothing about valuations. All five defining “value” factors involve price and valuation: book to price, 3-year future earnings to price, 3-year historical earnings to price, dividend to price, and sales to price. (The terms invert common parlance.) With one exception “value” is firmly fixed in the present and not the future. Those factors will frame the discussion of probable performance in a recession.
One thing to bear in mind is that not all recessions are alike. It has actually been quite a while since the economy had a garden variety recession stemming from an overheated economy which led the Fed to “take away the punchbowl,” as the saying goes, “just when the party started to rock.” The last three recessions each had a very specific theme. The 2000-2003 recession was mild despite the fact that it was accompanied and to some degree driven by a powerful crash of overpriced dot-com stocks. Value stocks did very well with a rally which remained under the radar. VTV and VUG did not exist at that time.
The 2007-2009 crash accompanying the Great Recession was driven by low quality mortgage debt which almost pulled the financial system under. Because housing and financials are prominent in value funds, value investors took a shellacking along with growth. One of the stalwart value funds, Dodge and Cox Stock Fund (DODGX), was badly beaten up because it had too much faith in traditional value areas. Here’s a chart of the performance of VUG, VTV, and DODGX from just before to just after the crash and crisis:
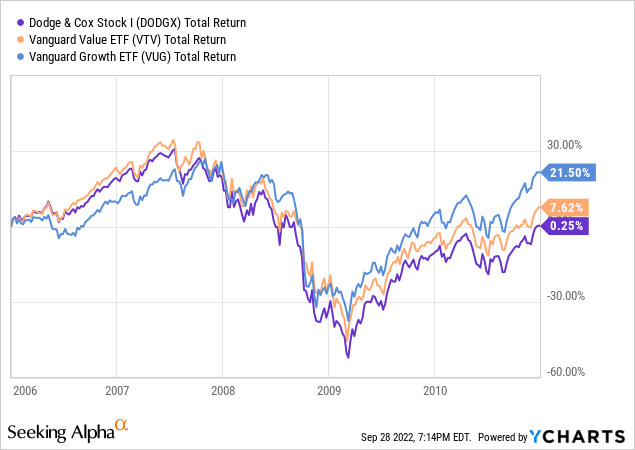
What you see in the above graph is that everything got crushed. There was nowhere to hide. If you look closely, however, you will see that growth held up longer and stopped going down sooner than value prefiguring strong leadership in the recovery. Stocks and market sectors which outperform in recessions often emerge as long term winners afterward. The Dodge and Cox Stock Fund, which deserved its reputation as a fund that outperformed in hard times, was actually hit a little harder than the value index. Its error resided in the belief that the 2008-2009 event would resemble the past. I spent some time thinking about that mistake because I managed money professionally at the time and had several clients in DODGX.
The most recent recession, the brief downturn involving the COVID lockdown, was the strangest of the three recent recessions. Unemployment went up quickly to 15% before powerful help from the government kicked in. The stock downturn was sharp but lasted only a month. Many tech companies thrived in an environment when an increasing amount of business took place online. Here are the charts for VTV and VUG:
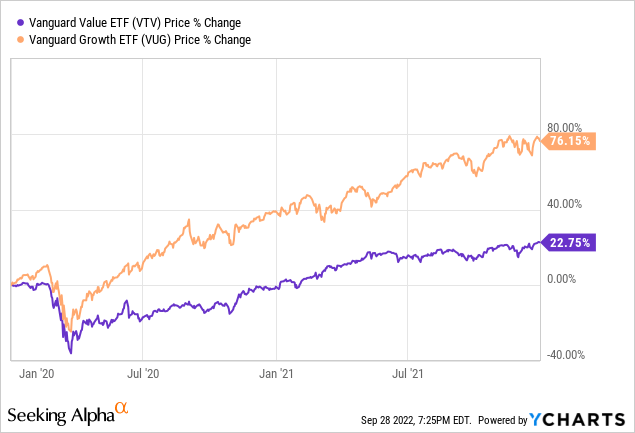
As the chart shows, growth fell about equally as hard as value. This is due in part to the fact that it had been outperforming value before the crash and was probably due for a correction in any case, but there are no asterisks needed to explain the way that VUG blasted off from the bottom. Powered by technology and new business models and fueled by exceptional liquidity and low rates it opened a huge performance gap from the March 20 low to the end of 2021. Taken in sum, the performance of value stocks and growth stocks in the three most recent recessions show that there may be no hard and fast rule as to which performs better in a down market accompanied by a recession. A deeper look might provide some factors to consider in the event we are currently in or about to enter a recession.
The Case For Value
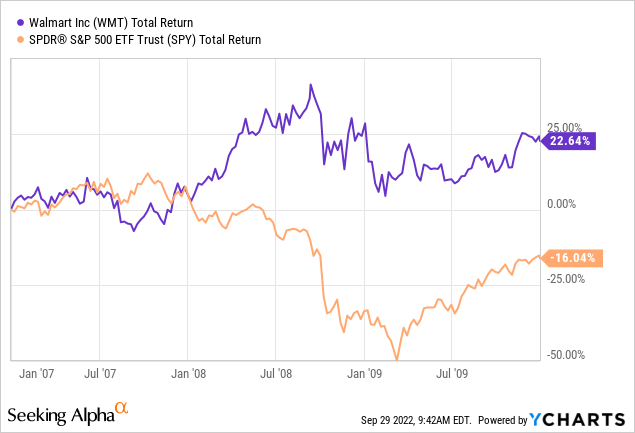
Most informed investors believe value outperforms in recessions, but it didn’t in two of the three major recessions discussed above. A fair amount depends upon what was going on before the recession, an example being the extreme dot.com bubble in the years before 2000 which made all techs and many blue chip market leaders wildly overpriced. Value generally didn’t help in the Great Recession of 2008-2009, but there’s the idiosyncratic example of Walmart (WMT) which was helped enormously as consumers traded down to their value prices. WMT was actually up about 18% for the duration of the crisis which took the market as a whole down over 50%. Here’s a picture of WMT’s outperformance:
Idiosyncratic examples aside, value stocks might perform better for a couple of reasons:
- Value stocks are cheaper more or less by definition and don’t have as far to fall.
- Many value stocks are in the four industry groups mentioned above which usually don’t see their sales and earnings fall much in “ordinary” recessions.
Here are the relative weights of industry groups in the Value Index:
- Health Care 21.35%
- Financials 19.74%
- Industrials 12.24%
- Consumer Defensive 11.48%
- Energy 8.18 %
- Technology 8.10%
- Utilities 6.28%
- Communication 3.58%
- Real Estate 3.58%
- Basic Material 2.70%
- Consumer Cyclical 2.57%
Of the four industry groups with double digit percentages three are classic defensive areas unlikely to be harmed by an ordinary recession. Industrials are somewhat more cyclical. Energy might well be defensive in a present recession because of the global shortage. Utilities, on the other hand, have only a 6.28% representation despite being very much defensive (the use of electric power will only decline slightly mainly because of diminished use in manufacturing). That’s the total value of all traded utilities, by the way. They are not included in the growth index.
These are the top ten stocks in the value index as of August 31: United Health (UNH), Berkshire Hathaway (BRK.A)(BRK.B), Johnson & Johnson (JNJ), ExxonMobil (XOM), JP Morgan (JPM), Procter & Gamble (PG), Eli Lilly (LLY), Pfizer (PFE), Coca-Cola (KO). No single stock has representation higher than 3% of the index. If you are surprised to see United Health ranked above Berkshire Hathaway, which has a significantly larger market cap, the reason is that the CRSP indexes sometimes split company caps between the growth and value indexes. Berkshire apparently has about 20% more of its market allocated to growth than United Health. In general the top ten value stocks have qualities suggesting why they might do better in the event of an ordinary recession as do the top three industry weightings. They also might serve as ideas for investors who prefer individual stocks.
At this point it might be helpful to consider how value and growth have performed going into the present moment:
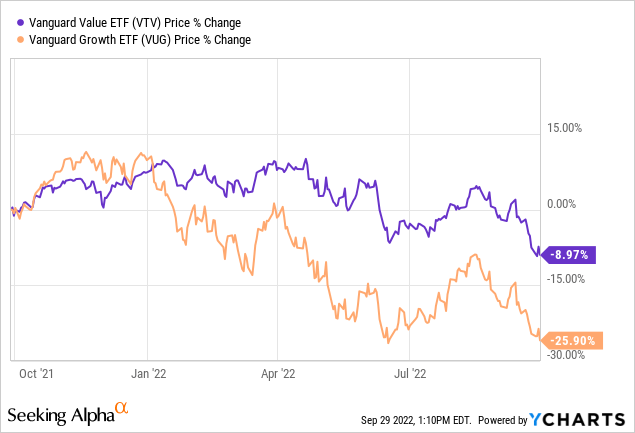
Starting in November-December of 2021 Value began to Outperform Growth. The question is whether after over a decade of Growth leadership Value began to outperform and will continue to do so going into and coming out of a recession. Or has the outperformance of Value over recent months reduced the valuation advantage for Value and put Growth in a position to resume leadership?
The Case For Growth
Growth has outperformed the market since emerging as the leader following the 2008-2009 Crash and Great Recession. Coming out of the COVID lockdown growth companies widened the gap as both new and established companies with products and services not requiring physical contact took advantage of the lockdown. A lower tier of growth stocks without present earnings (and in some cases very expensive by the measure of price to sales) led the latter stages of the rally. Yet while valuations were quite high they did not approach the levels of absurdity seen in the dot.coms in the years leading to 2000. Additionally, compared to the 2000 Bubble, many of the growth companies had real products, strong revenues, and real earnings.
Adding it all up, growth companies were expensive but in the aggregate less unrealistically priced than “growth” companies in 2000. If it turns out that we are entering a recession at the present moment, growth stock valuations will go forward with 33% cheaper valuations because of the decline for the past year (as shown in the above chart). In addition to that, investors should bear in mind that growth stocks have led coming out of the past two major downturns, and in one of the two cases (2007-2009) actually took over market leadership during and after the recession. Here are the percentages of industries which make up the growth index:
- Technology 41.36%
- Consumer Cyclical 19.08%
- Communication 12.77%
- Health Care 7.45%
- Financials 6.46%
- Industrials 4.41%
- Consumer Defensive 2.72%
- Real Estate 2.66%
- Basic Material 1.79%
- Energy 1.08%
The growth index is dominated by just three industries: technology, consumer cyclical, and communication. Together the three groups make up 73% of the index. That gives you a good idea of where growth has been in the US economy over the past 15 years. These are the top ten stocks included in the growth index.: Apple (AAPL). Microsoft (MSFT). Amazon (AMZN), Tesla (TSLA), Alphabet Class A (GOOG)(GOOGL), Alphabet Class C, Meta (META), NVIDIA (NVDA), VISA (V), The Home Depot (HD).
There are several reasons growth companies might perform better:
- Growth areas like technology and communication may be less dependent on economic strength than major value areas which make and sell things.
- Growth companies will benefit when the Fed recognizes the recession and begins to cut rates. Lower rates mean a lower discount to future earnings which are more important to growing companies.
- Growth companies are compounders. You can see this in the huge market caps achieved by the top stocks in the growth index. For the value index the top ten stocks sum to 21% of the index; for the growth index the top ten stocks sum to over 49% of the index.
- Looking ahead only a couple of years an earnings growth rate around 20% would raise earnings 44%, greatly reducing the valuations.
Should You Blend Value And Growth?
You can make a pretty good case that it doesn’t pay to turn a portfolio upside down in an effort to own things which will perform well in the course of a particular market environment. An overall portfolio should be built to work reasonably well in all economic conditions. It should contain both growth and value. The two categories have alternated as market leaders over time, with periods of leadership lasting from 7 to 10 years or so. That may be long enough for determined trend followers to overweight one side or the other. It would certainly have paid off handsomely to overweight growth from 2010 to early 2021. Hindsight, as a shrewd investor used to tell me, is always 20-20. Investors who lack functioning crystal balls do best with a portfolio that will do reasonably well in most environments with a bit of tweaking and pruning from time to time. Is there a way to capture the best of both approaches?
In the section on value I pointed out that United Health ranked above Berkshire Hathaway despite the fact that Berkshire has a market cap about $100 billion greater. The explanation is that Berkshire is primarily a value stock but also meets many of the criteria for growth. For that matter, United Health probably is similarly a value stock which also fits the growth model. In this earlier article I pointed out that United Health and Apple (the number one growth company) had statistical metrics so similar that if you removed the name and absolute amounts (Apple being much bigger) the ratios are so much alike that it would be hard to know which company was being described.
There are in fact 347 companies in the Vanguard Value ETF and 262 companies in the Growth ETF. That’s a total of 609 stocks in two indexes made up from the S&P 500. The “500” often has a few more or less than 500, but not to that degree. It shows that quite a few companies fit both sets of criteria well enough to be included at different amounts in both indexes. The CRSP indexes in fact have a detailed protocol by which this sharing in two indexes is calculated.
In the course of the more than ten years when growth led value by a large margin a number of well-established actively managed “value” funds found ways to classify growth stocks as value. I began to notice this three or four years ago and one well-known and highly successful value manager I noticed doing this is Bill Nygren of Oakmark whose explanation for including growth stocks in his Oakmark Fund and Oakmark Select Fund sounded pretty much like a combination of the six CRSP growth factors with the five CRSP value factors. In short, the companies he included, Alphabet in both funds and Meta in the Select fund, could be described as cheap in context of their growth rates. Coming at it from another angle, maturing growth stocks tend to gradually slide to lower growth rates and while their P/E ratios decline in such a way as to make them increasingly resemble value stocks. I should add that this rarely if ever works in the other direction.
A confession: although I am basically a value investor, I also bought Alphabet near the market low in March 2020 and am up about 75% at this point though down spectacularly from the December 2021 high. When I bought it, its P/E was about the same as that of Coca-Cola, which has negative top line growth and earnings manufactured by share buybacks; what if offers is a nice dividend. That’s a pure dead-in-the-water value stock. To hold Alphabet or buy it now one would have to believe that it is likely to do as well as Coca-Cola and other consumer staples. While Alphabet faces a few headwinds, I think it will likely do at least that. The easy and obvious approach for most investors is simply to own the growth and value ETFs in a proportion reflecting your view. The degree of commitment should reflect the odds as you perceive them. If your view is neutral you might buy equal amounts of VTV and VUG. For reasons I will explain below my own view is not neutral.
What Should ETF Investors Do Now?
The best-fit model for the present situation is the period before and during, the recession of 2000-2003. Growth is overpriced and value looks more or less fairly priced. The valuation of growth is much less extreme than in 2000, but it is still high enough that valuation adjustment is likely to be one of the major themes of the present bear market. One of the issues with the growth index is that its top ten stocks add up to almost 50% of the index. For several years analysts, myself among them, have mentioned frequently how large a part of all major indexes (except value indexes) has come to be driven by the rising market cap of a half dozen or so large winners. The warning was that a day might come when this process would run in reverse.
That day has finally come.. the top four stocks in the Vanguard Growth ETF – Apple, Microsoft, Alphabet, and Amazon – add up to 37% of the entire index. All of the four growth leaders except Amazon appear to be mature or maturing companies likely to have slowing growth rates and declining P/Es. Amazon may or may not experience slowing growth now or soon, but its P/E remains astronomical. It can do extremely well operationally and still see its stock price go down.
The current bear market in these VUG stocks is very much about excessive valuation which has to be worked off. Only then will there be a reduction in the risk that the top-heavy cap leaders will continue to pull the growth index down. Meanwhile no recent growth companies seem to be climbing the cap-weighted ladder as their replacements. Further down in the top ten both Nvidia and Meta are a lot cheaper than a year ago but face very major headwinds. In the first year of the 2008-2009 recession ad spending dropped double digits and in 2020 it stopped entirely. Given those facts neither Meta nor Alphabet look particularly defensive. Amazon, on the other hand, might be well positioned, like Walmart, against a downturn in consumer spending, but there’s still that very high P/E.
To me, the odds in the event that we are entering a recession tilt toward value. Valuation is an important part of the picture, and value stocks in aggregate seem fairly valued. Some areas prominent in the value index seem significantly undervalued – financials and energy in particular. While neither VUG nor VTV is ranked Buy/Hold/Sell at SA, the Value ETF comes in at #47 out of 508 Equity ETFs as against #246 out of 508 for the Growth ETF. The numbers speak for themselves, saying that the algo which ranks equity ETFs prefers value. That sort of backs into a quant preference for value over growth, which coincides with my view.
Be the first to comment