


1001Love/iStock via Getty Images
Thesis
A key service that we provide in our marketplace is two real-money portfolios with verifiable performances. For those who couldn’t wait, our current holdings in the model portfolio are provided towards the end together with its historical performance. And in our portfolios, we use the Vanguard Total Stock Market ETF (NYSEARCA:VTI) as a core holding, instead of other total market funds such as the Vanguard S&P 500 ETF (NYSEARCA:VOO).
And this choice is one of the most frequently received from our marketplace members. The question came in different ways and forms. But in essence, they all boil down to 1) what’s the difference between VTI and 2) why we use VTI instead of VOO.
And it is the goal of this article to organize our exchanges with our members in a coherent way. And you will see that our key considerations for choosing VTI are primarily twofold:
- VTI offers a broader market exposure
- And in particular, under current conditions, VTI provides exposure to the mid-cap and small-cap sectors, which are more attractively valued than the large-cap that VOO targets.
In the remainder of this article, I will elaborate on these points. But before I start, let me emphasize that in the case that you are holding VOO already and you are thinking about switching to VTI, the first thing you have to consider is tax consequences. It is true that I am optimistic that VTI would outperform VOO in the year years to come. But in the end, the outperformance will be limited. After all, these two funds are largely similar in their holdings. And that is why you will need to consider the tax consequences first and see if the potential outperformance can justify the switch.
VTI and VOO: basic information
These funds need little introduction. And I would just directly quote their fund descriptions below and point out a few highlights.
VOO invests in stocks in the S&P 500 Index, representing 500 of the largest U.S. companies. Its goal is to closely track the index’s return, which is considered a gauge of overall U.S. stock returns.
VTI seeks to track the performance of the CRSP US Total Market Index, which includes Large-, mid-, and small-cap equity diversified across growth and value styles. It employs a passively managed, index-sampling strategy. The fund remains fully invested and provides low expenses and minimized net tracking error.
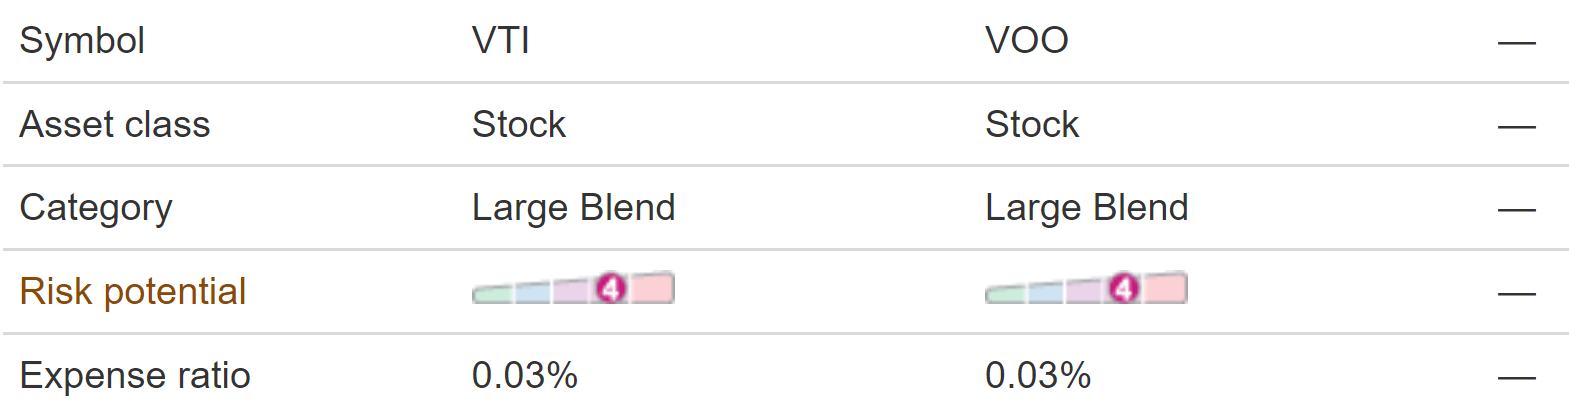
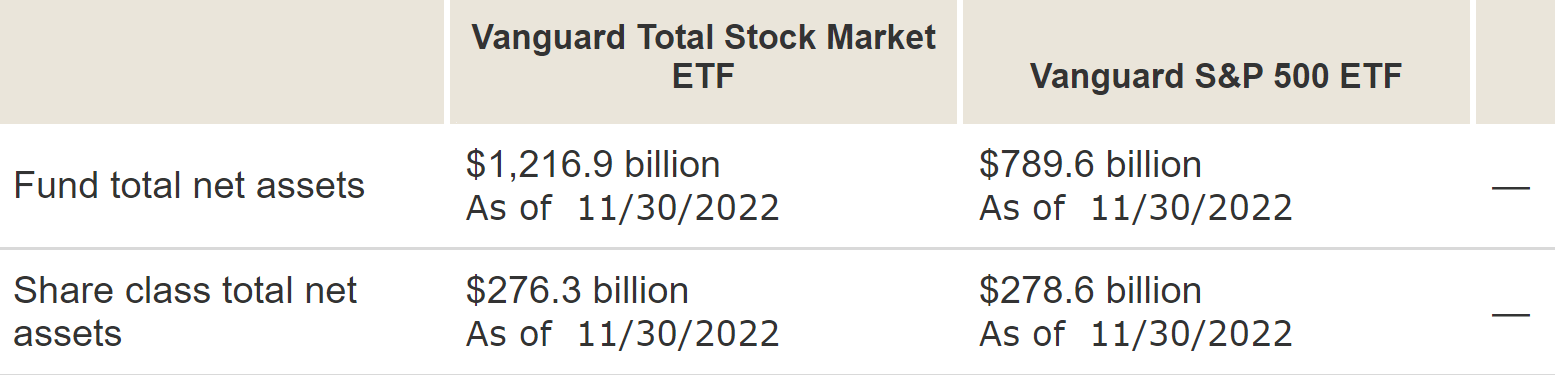
Indeed, both funds charge a rock-bottom low fee of 0.03%. And both VTI and VOO are very large funds, with $276.3 billion and $278.6 billion AUM, respectively. Although in terms of the fund’s total net assets (i.e., with the equivalent mutual fund shares included), VTI is still larger by a good bit, with more than $1.21 trillion of AUM compared to VOO’s $789 billion.
Source: Vanguard.com
Source: Vanguard.com
VTI vs. VOO: Historical performance
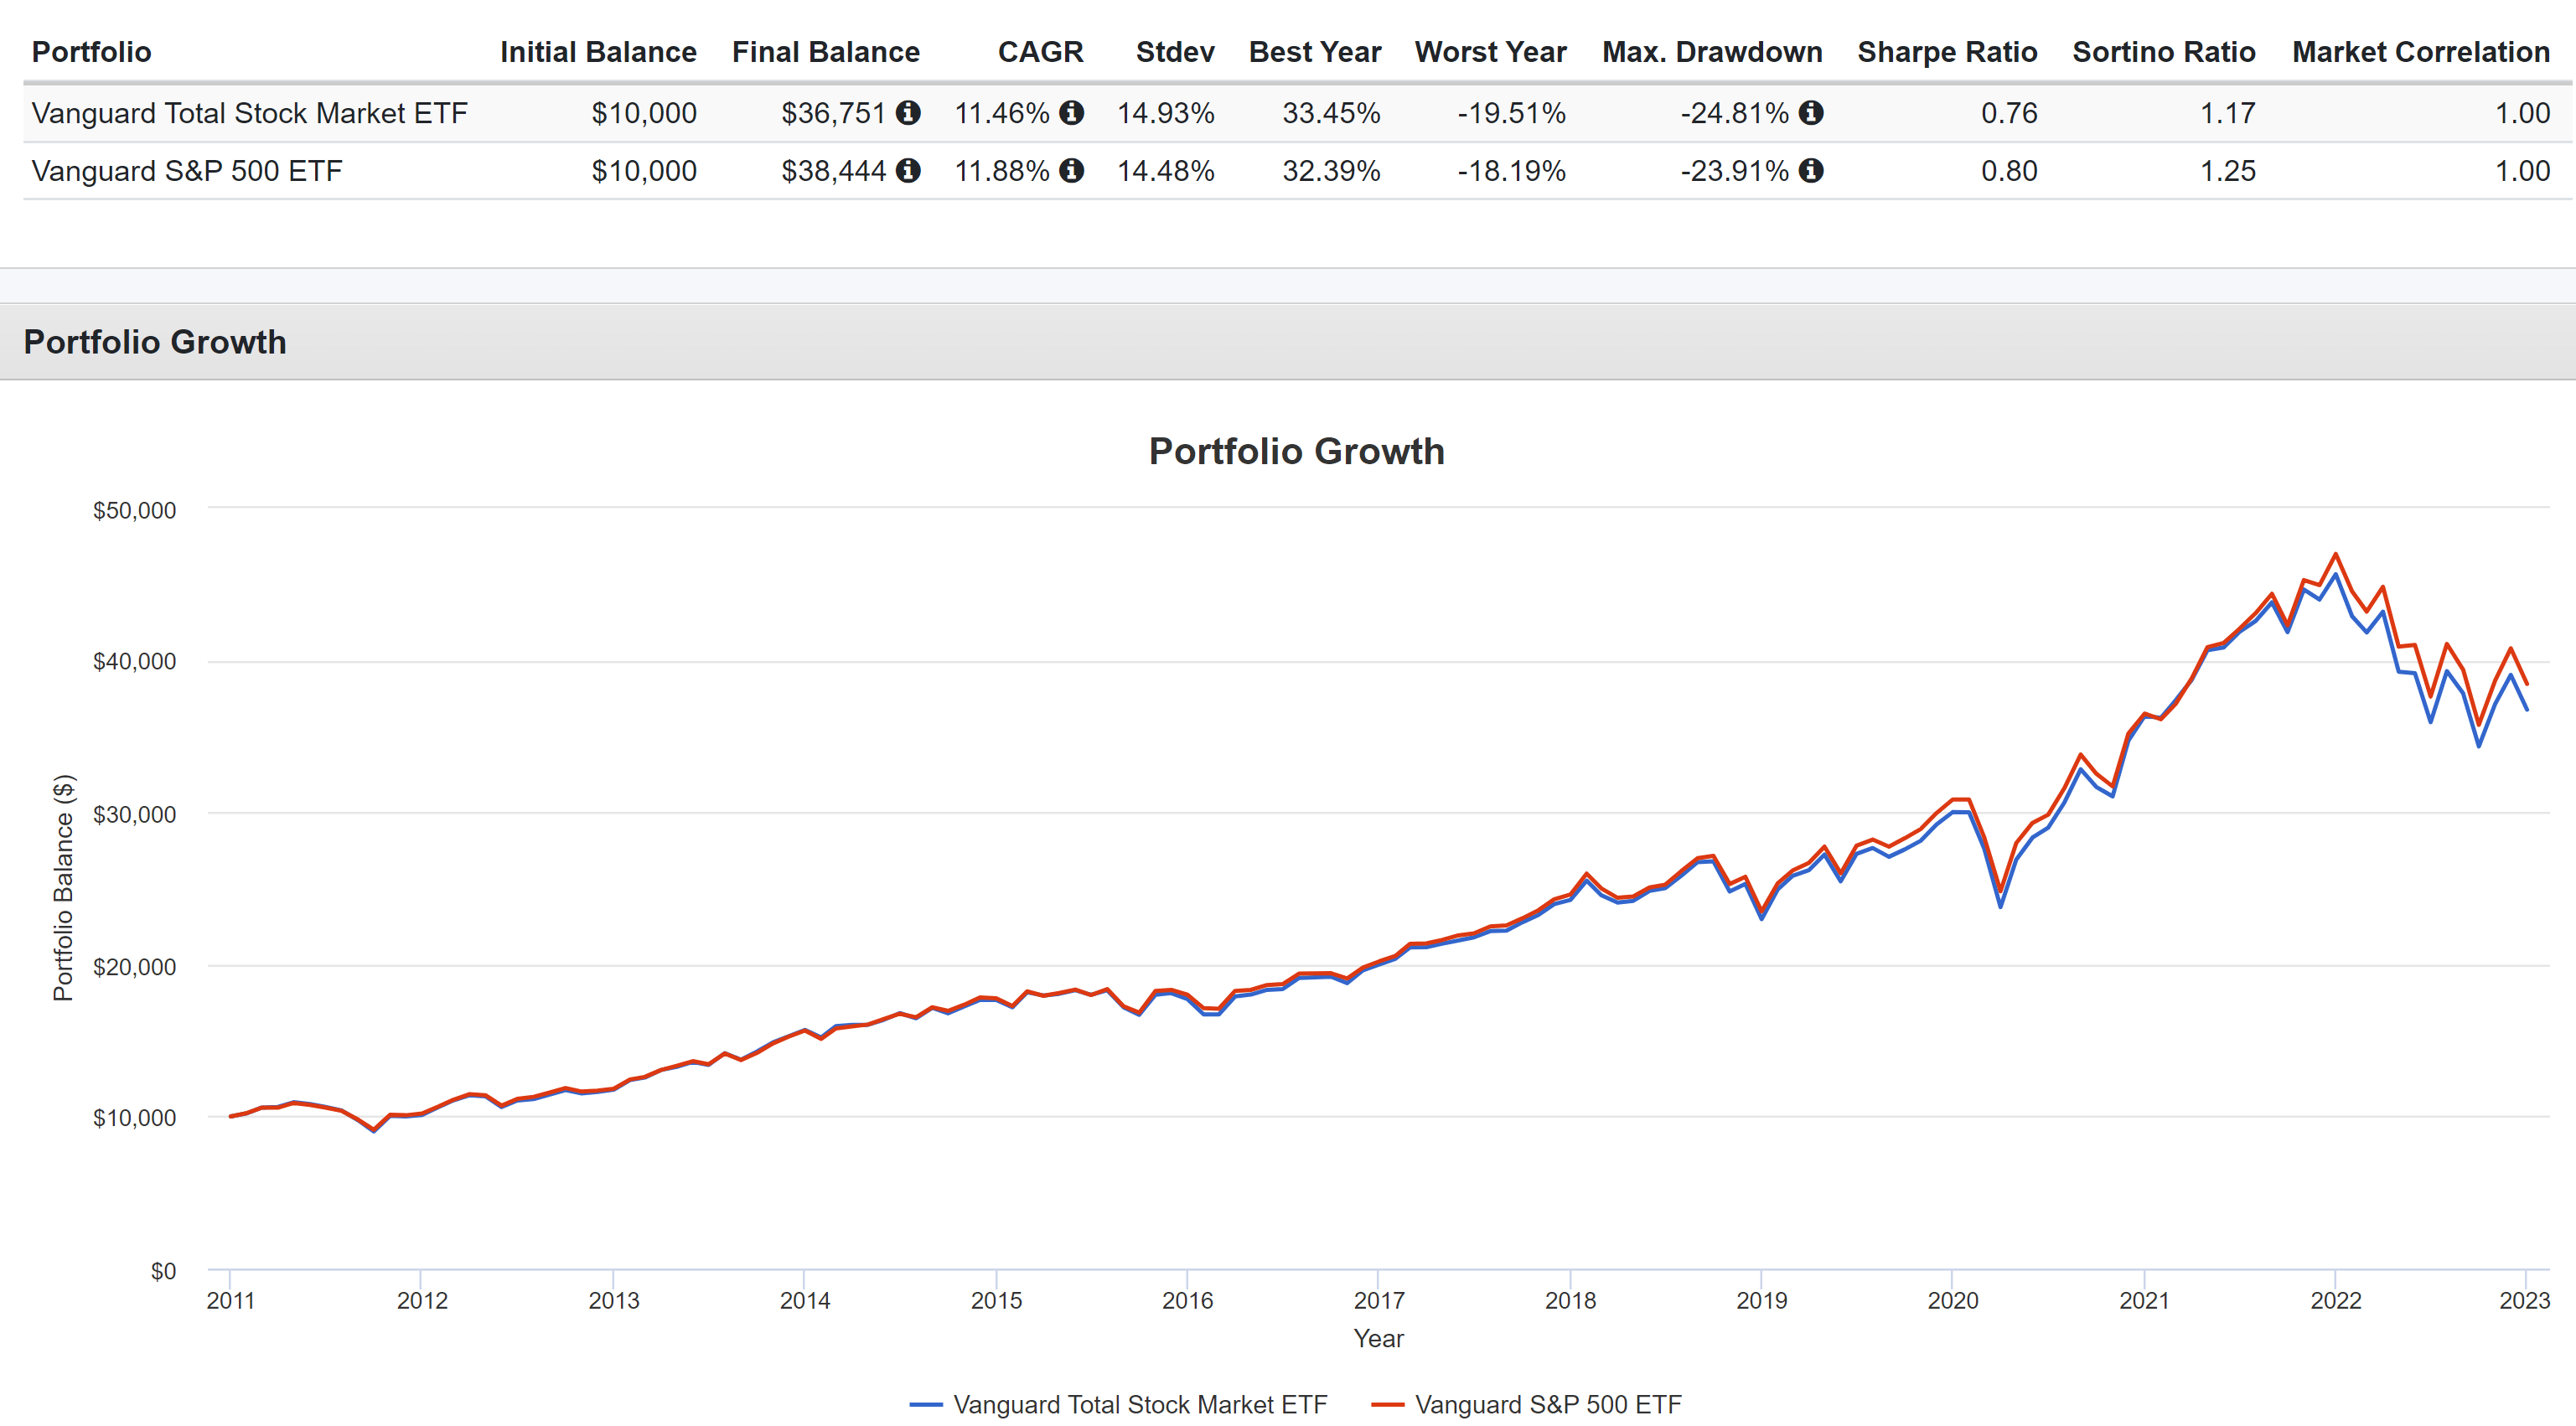
The chart below compares the historical performance of VTI and VOO since 2011. As aforementioned, in the end, these two funds are largely similar in their holdings and as a result, their performances are also very similar as seen. As to be detailed later, more than 80% of VTI’s holdings overlap with VOO (i.e., the large-cap holdings). To wit, VTI delivered an annualized return of 11.46% during this period, slightly lagging VOO’s 11.88%. And next, I will explain why I think VTI is well-poised to outperform VOO in the years to come due to the ~20% of their holdings that are different – the mid-cap and small-cap stocks.
Source: Portfolio Visualizer
Key consideration 1: VTI’s broader exposure
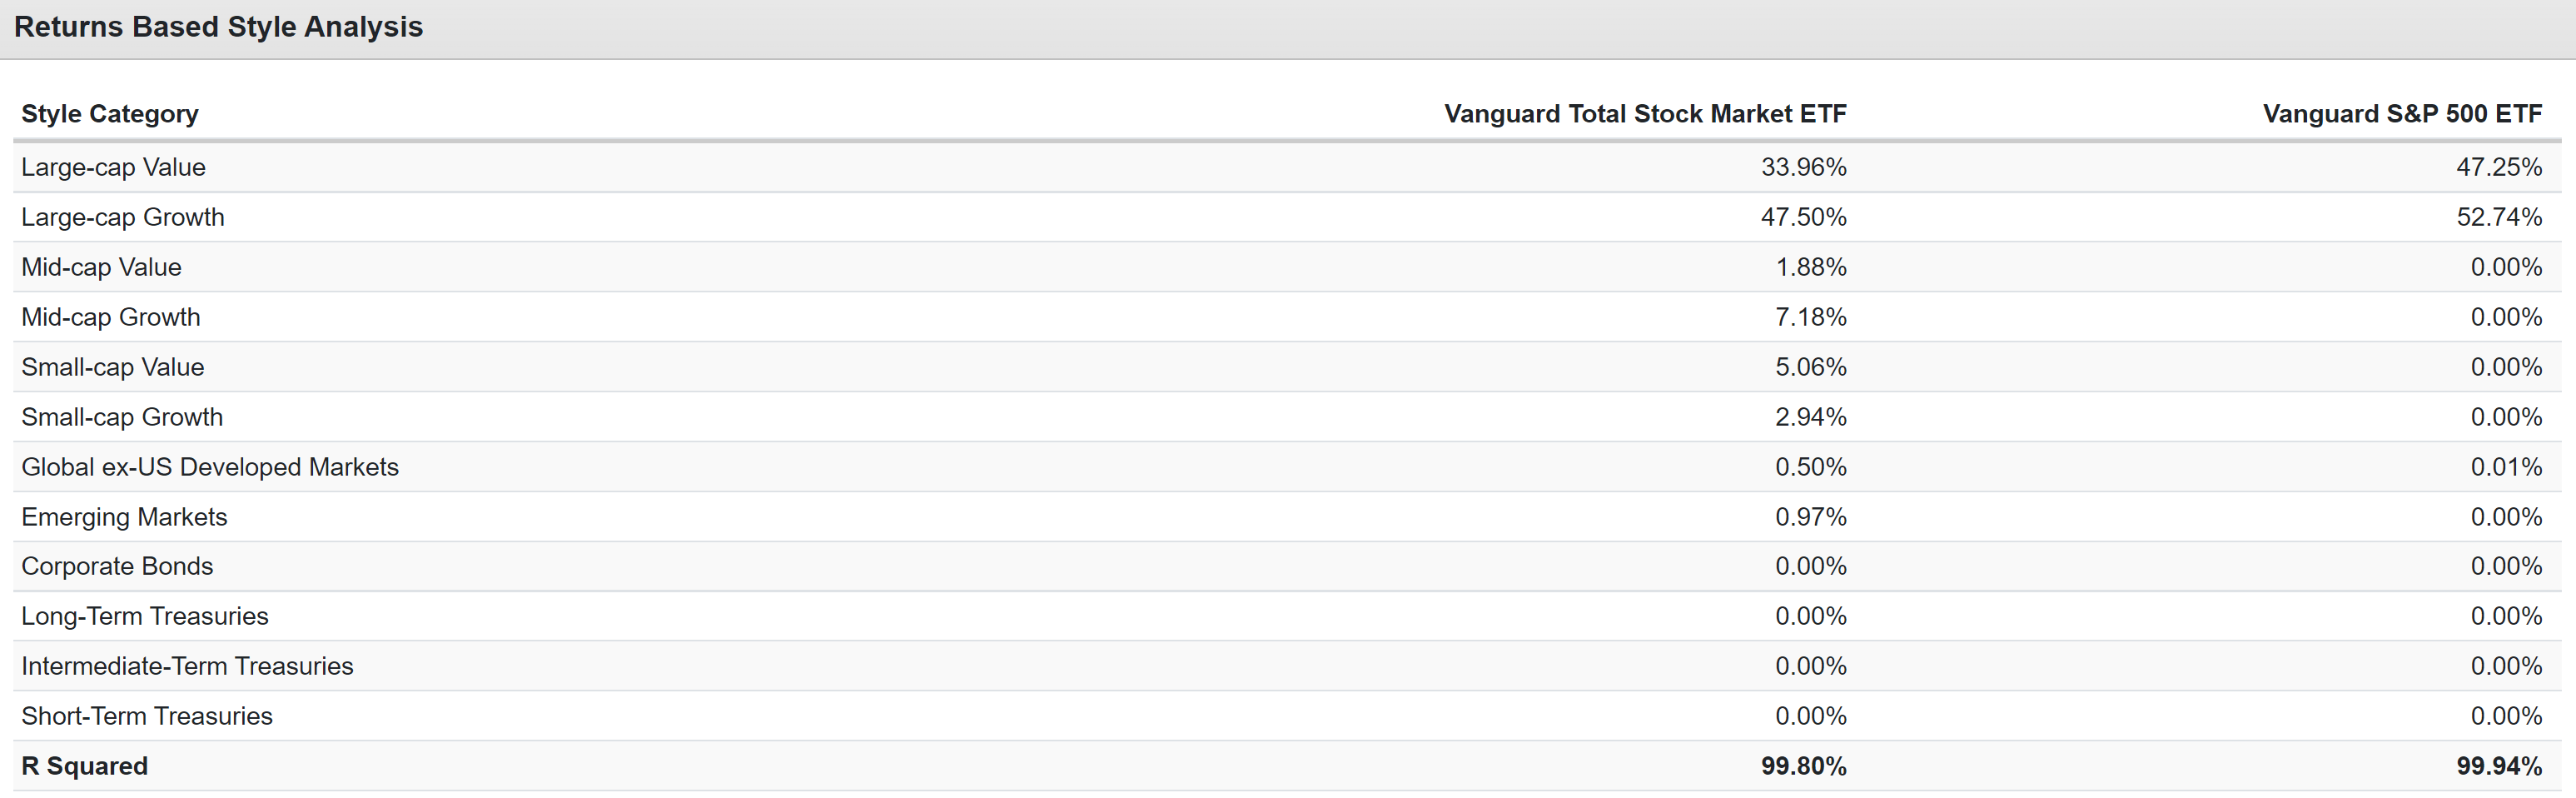
The next table below compares the market cap and style difference between VOO and VTI. As seen, VOO is exclusively exposed to large-cap stocks without a surprise. In particular, its current holdings feature an almost even split between large-cap value stocks and growth stocks (47.2% vs 52.7%, respectively). In contrast, VTI’s exposure to large-cap stocks is only about 81% (34.0% value plus 47.5% growth). And this ~80% overlap that I just mentioned earlier.
And the ~20% of VTI’s holdings that are different is the first key consideration that leads us to pick VTI. As you can browse further down the rows in the following table, the remainder ~20% of VTI’s assets are invested in Mid-cap Value stocks (1.88% ), Mid-cap Growth stocks (7.18%), Small-cap Value stocks (5.06%), and Small-cap Growth stocks (2.94%).
Next, you will see that these mid-cap and small-cap stocks are much more attractively valued under current conditions.
Source: Portfolio Visualizer
Key consideration 2: valuations for mid and small caps are too attractive
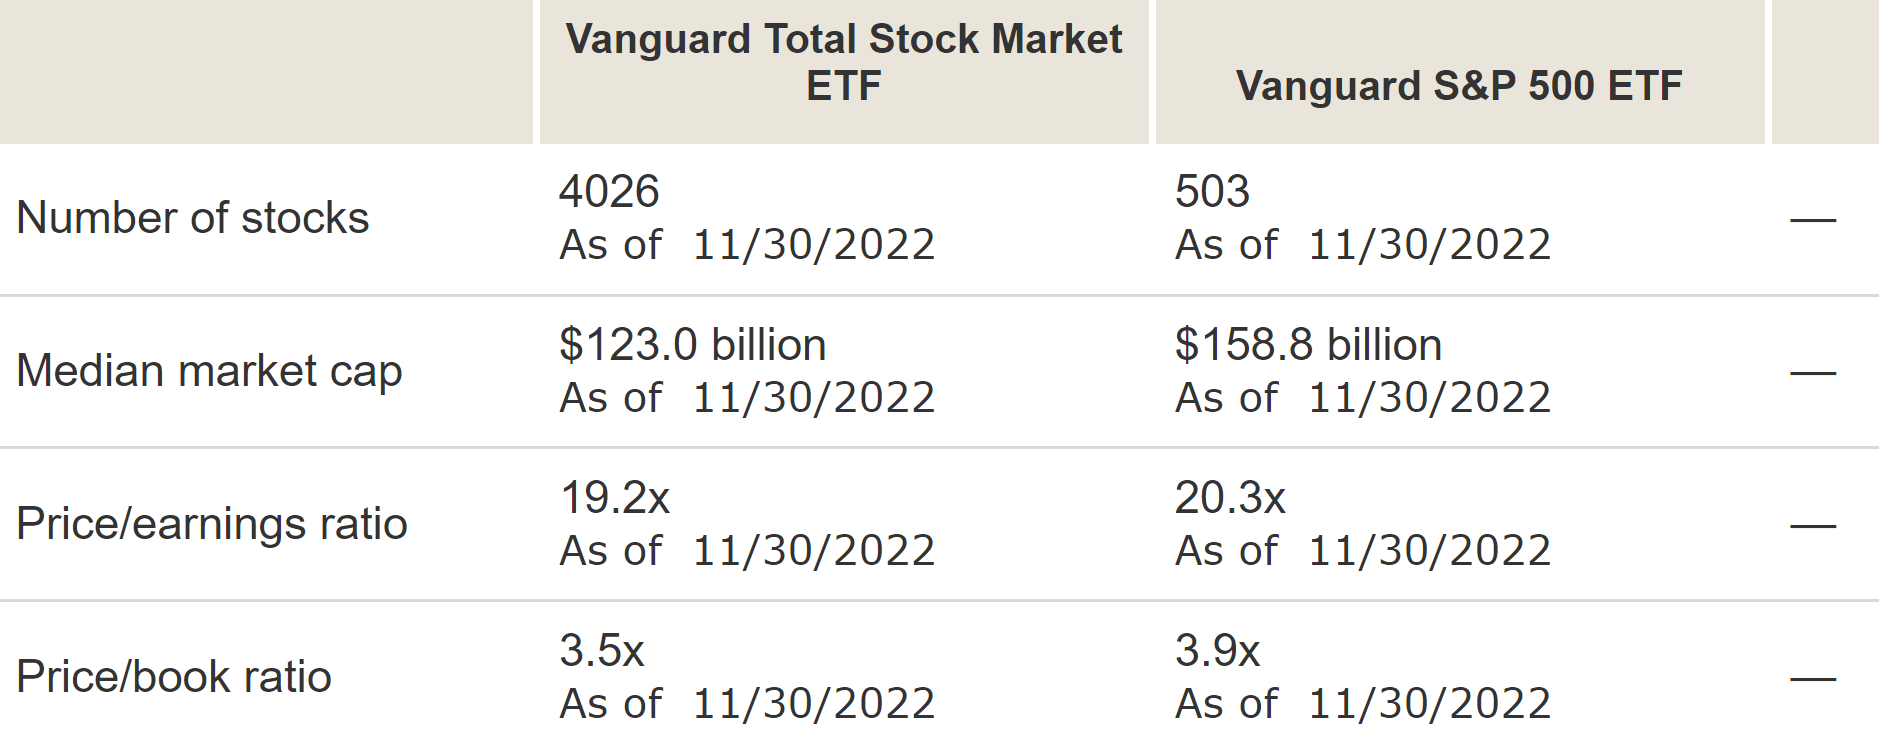
At a global level, VTI is more attractively valued than VOO as you can see from the next table. Specifically, VTI’s P/E ratio is 19.2x, about 5% below VOO’s 20.3x. And in terms of price to book value ratio, the discount is even larger. VTI’s 3.5x P/BV ratio is more than 10% discounted from VOO’s 3.9x.
Source: Vanguard.com
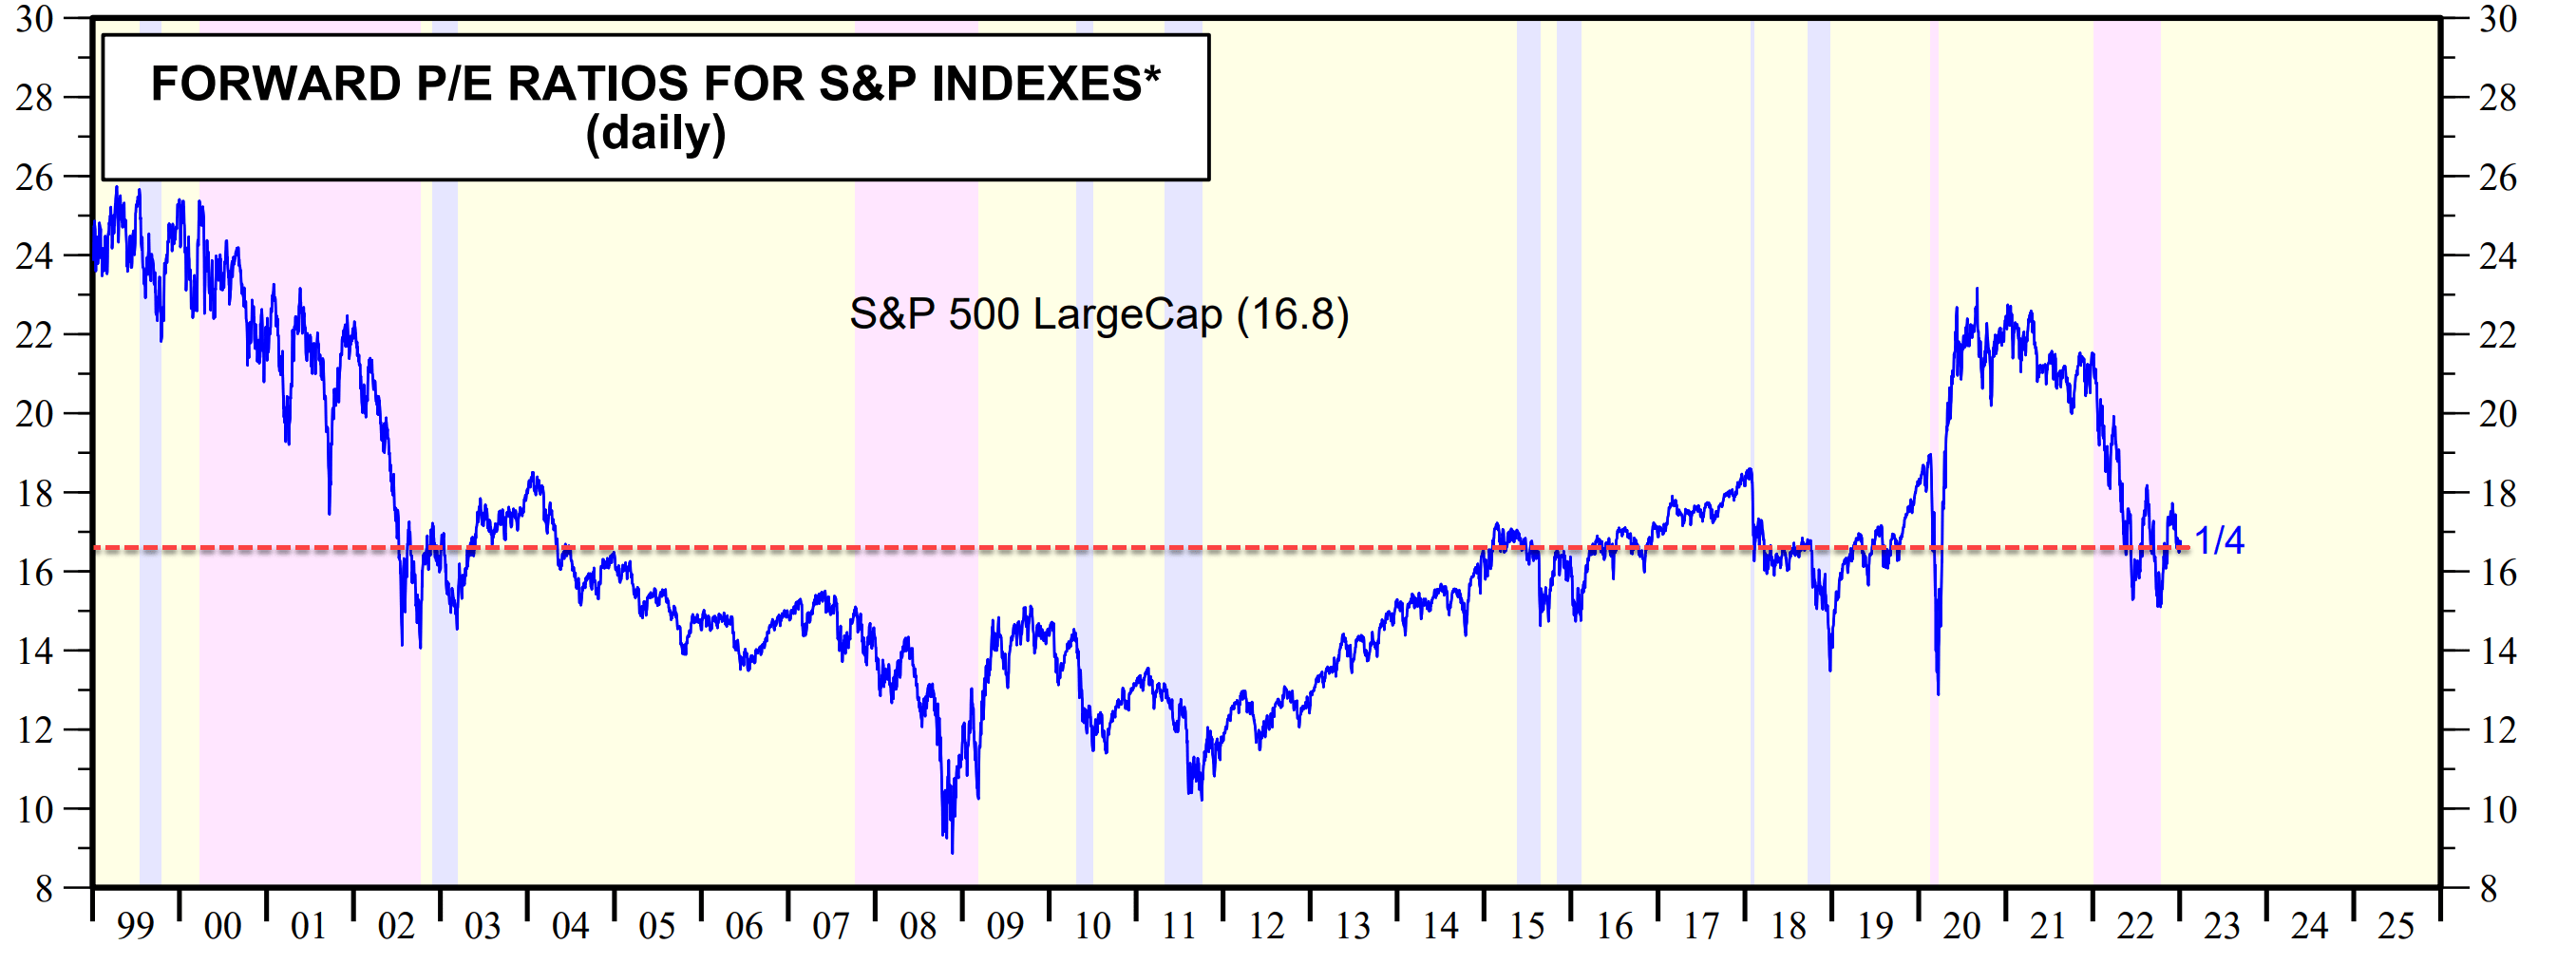
The valuation discount is more attractive once we look at a detailed level. All market sectors suffered sizable corrections in 2022. However, the corrections are unevenly distributed among large-, mid-, and small-cap sectors as you can see from the next three charts. To wit, the FW P/E of the S&P 500 large caps currently sits at 16.8x after a correction from the peak level of almost 25x a year ago as seen in the first chart.
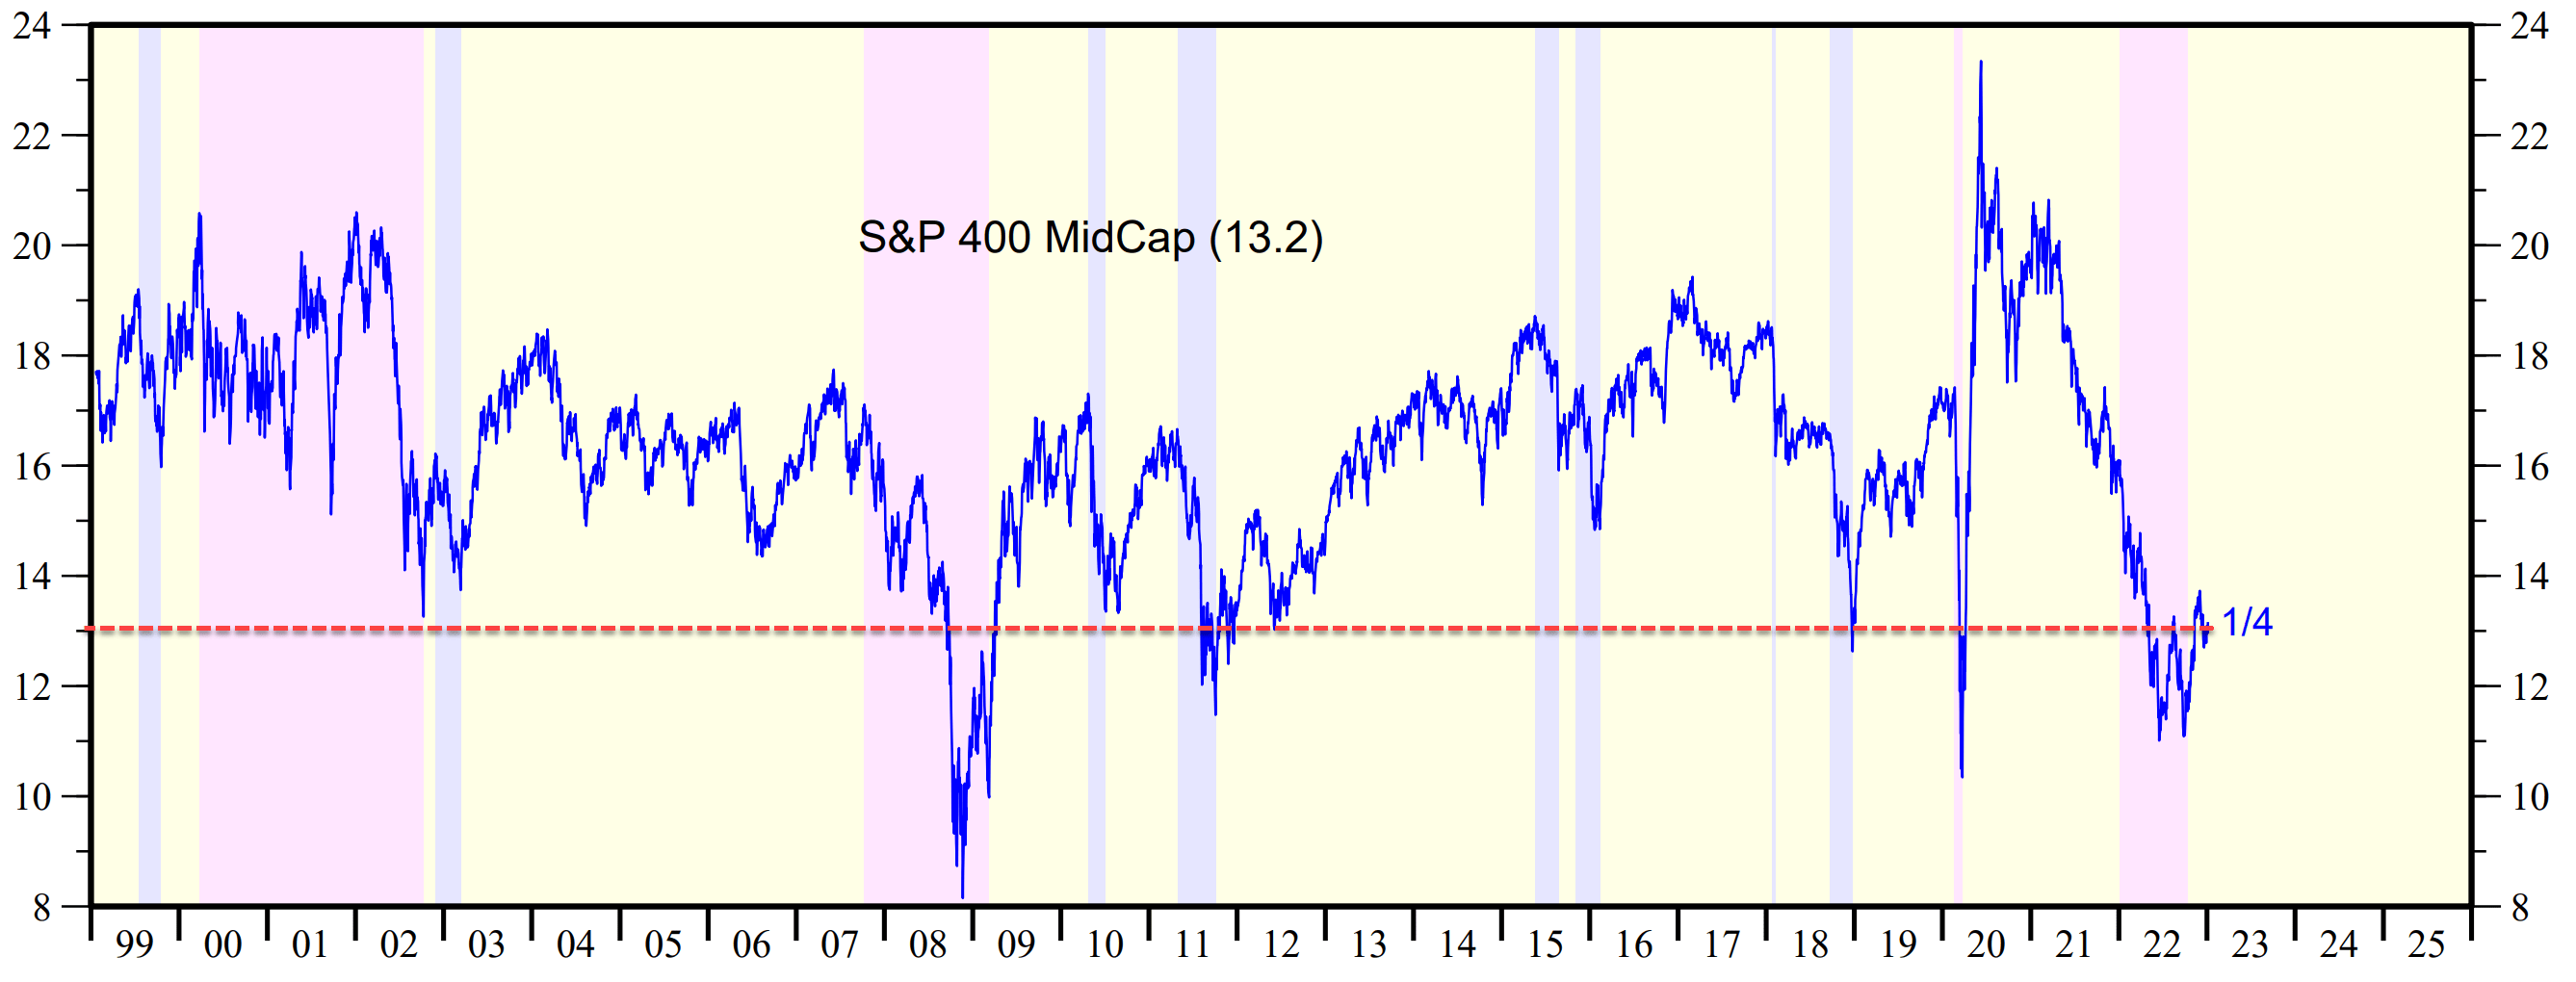
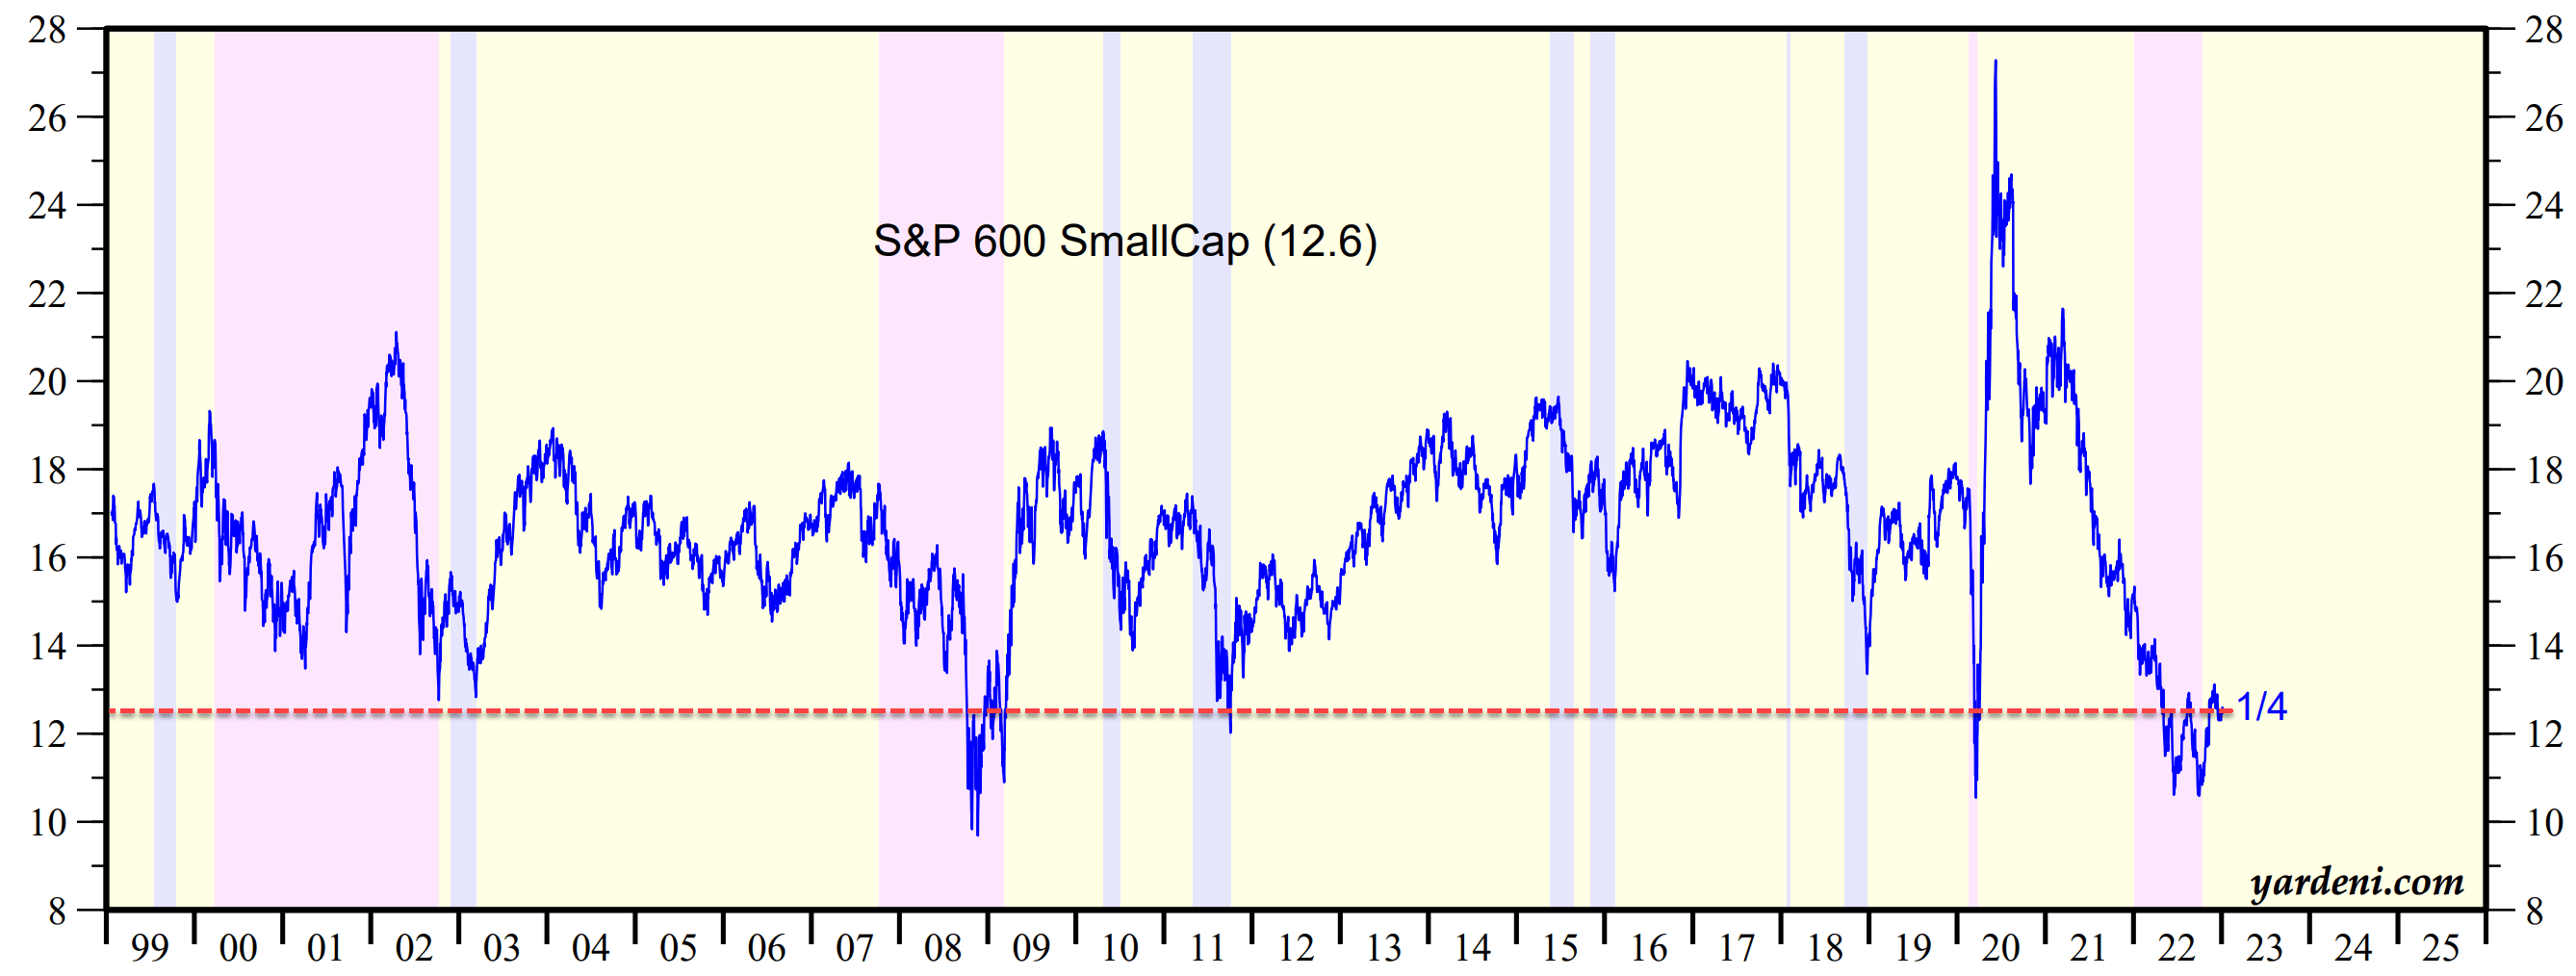
The second chart shows that for mid-cap stocks, their valuation currently stands at 13.2x FW P/E. Compared to the 16.8x FW P/E for large caps, it is a sizable 22% valuation discount. Furthermore, a 13.2x FW P/E close to the secular bottom valuation has occurred only four times since 1999. The picture for the small caps is similar as shown in the third chart. The FW P/E of small caps currently hovers around 12.6x, an even larger discount of 25% compared to the 16.8x FW P/E of large caps. And again, it is close to the secular bottom valuation that has only occurred a few times since 1999.
I view these current valuation levels (especially the even more compressed level in 2022) as excellent entry points to the mid and small-cap sectors. That is why we have been using VTI recently instead of VOO, as detailed in our current holdings in the next section.
Source: www.yardeni.com
Source: www.yardeni.com
Source: www.yardeni.com
Final thoughts and risks
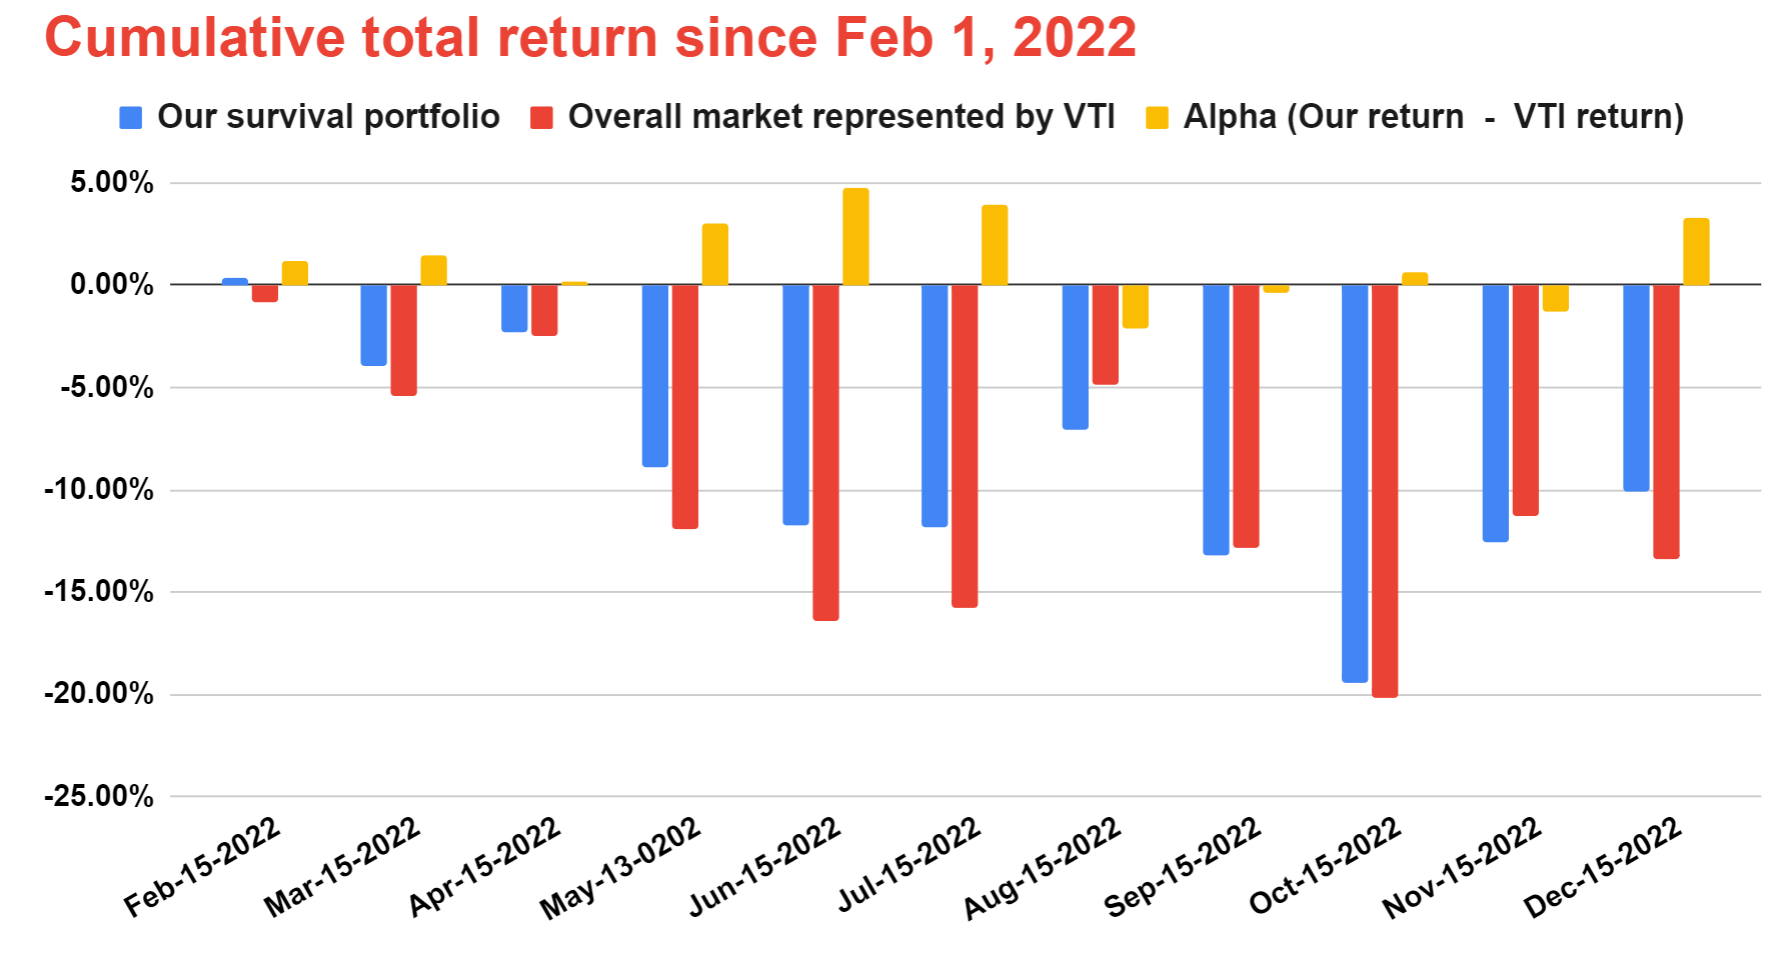
A core strategy we use (and always tell others to use too) is to maintain two separate accounts in a so-called barbell model. Use one account for short-term survival and the other for long-term aggressive growth (and the links will direct you to our blog articles with more details on the barbell method). We use VTI as a core holding in both our accounts, and the current holdings in our survival account are shown below followed by its performance since Feb 2022. We have been applying this strategy for more than a decade ourselves. Here we are only posting the performance since February 2022 because that’s when we launched our marketplace service and we wanted to provide performance data that our readers can easily verify for themselves. As seen, with only a dozen holdings, our survival portfolio did what it is supposed to do and weathered an extremely turbulent 2022 quite well. We maintain this account on a monthly basis in the mid of each month. As of our last maintenance in mid-Dec of 2022, this account was leading the overall market by a small margin of 3.1%.

Source: Author based on Seeking Alpha data
Source: Author based on Seeking Alpha data
To conclude, overall-market funds such as VTI and VOO are largely interchangeable for most purposes. After all, more than 80% of their holding overlap. However, under current conditions, we favor VTI better. VTI offers broader exposure to mid-cap and small-cap stocks, and their valuation is at a much more attractive level compared to large-caps in our view.
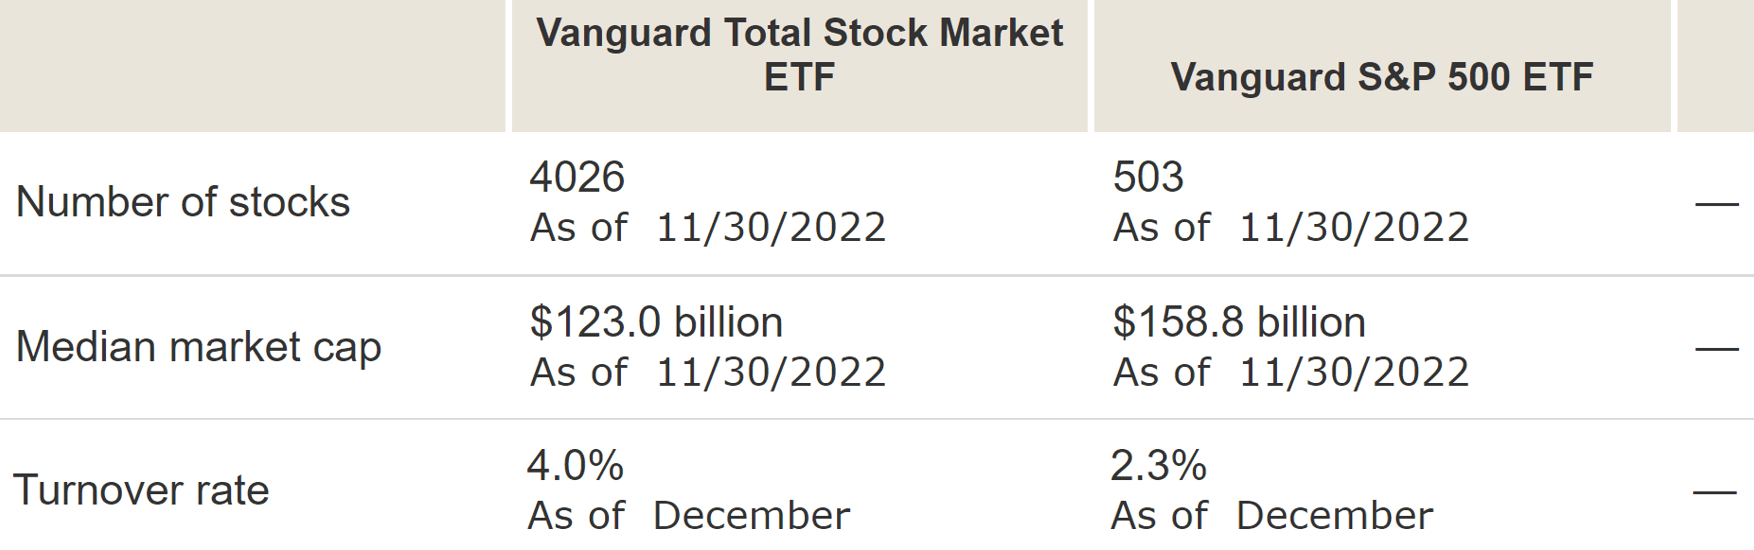
But again, in case you are holding VOO (or other large-cap ETFs) and are considering switching to VTI, the first thing you have to consider is tax consequences. And there may be a few less important (much less important in our view) considerations against the switch. VTI is more volatile (slightly more) than VOO due to the mid-and small-cap holdings if you recall from the results provided in earlier charts. And VTI also has a slightly higher turnover rate (4%) compared to VOO (2.3%), which again leads us back to tax considerations. Although both 4% and 2.3% are very low turnover rates to start with.
Source: Vanguard.com
Be the first to comment