

Rawf8
This dividend ETF article series aims at evaluating products regarding the relative past performance of their strategies and quality metrics of their current portfolios. As holdings and weights change over time, I post updated reviews when necessary.
VSDA strategy and portfolio
The VictoryShares Dividend Accelerator ETF (NASDAQ:VSDA) has been tracking the Nasdaq Victory Dividend Accelerator Index since 04/18/2017. It has 75 holdings, a 12-month distribution yield of 1.71% and a total expense ratios of 0.35%.
As described by Victory Capital,
“The Index screens companies in the Parent Index using a number of proprietary fundamental factors that have been identified by a quantitative multi-factor selection process to identify dividend paying companies with a higher probability of future dividend growth. Within this smaller set of companies, the Index weights the constituent securities using a methodology designed to maximize dividend growth, measured at a portfolio level, within established portfolio constraints (such as maximum weightings of index constituents and sectors). The Index is reconstituted every April and rebalanced quarterly.”
VSDA is exclusively invested in U.S. companies, 57.8% in large companies, 36.6% in mid-caps and 5.6% in small caps. The top 10 holdings, listed below, weigh 27.7% of asset value. The heaviest holding is under 4%, so risk related to individual stocks are moderate
|
Ticker |
Name |
Weight% |
EPS growth %TTM |
P/E TTM |
P/E fwd |
Yield% |
|
3M Co. |
3.59 |
-29.65 |
21.29 |
14.65 |
3.91 |
|
|
Lincoln Electric Holdings Inc. |
3.34 |
24.58 |
24.22 |
18.02 |
1.52 |
|
|
Apple Inc. |
3.17 |
18.52 |
28.44 |
28.19 |
0.53 |
|
|
Aon plc |
3.03 |
-23.51 |
43.26 |
22.86 |
0.74 |
|
|
Cisco Systems Inc. |
2.58 |
18.23 |
16.36 |
13.91 |
3.26 |
|
|
Elevance Health Inc. |
2.55 |
46.52 |
19.71 |
17.06 |
1.04 |
|
|
Consolidated Edison Inc. |
2.49 |
38.47 |
21.72 |
21.97 |
3.19 |
|
|
Donaldson Co., Inc. |
2.45 |
20.43 |
22.69 |
21.14 |
1.62 |
|
|
Emerson Electric Co. |
2.31 |
35.11 |
16.87 |
17.70 |
2.31 |
|
|
W.W. Grainger Inc. |
2.15 |
55.62 |
22.75 |
20.77 |
1.19 |
The heaviest sector is industrials (29.2%), followed by consumer staples (17.8%), technology (14.8%) and healthcare (11.4%). Other sectors are below 9%. Compared to the S&P 500 index (SPY), VSDA overweights industrials, consumer staples and materials. It significantly underweights technology, consumer discretionary, communication, energy and totally ignores real estate.
VSDA sectors (Chart: author – data: Fidelity)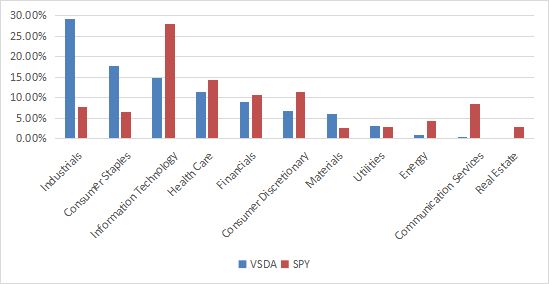
Performance
The next table compares VSDA since April 2017 with SPY and several dividend growth ETFs:
|
Total Return |
Annual Return |
Drawdown |
Sharpe ratio |
Volatility |
|
|
95.23% |
13.44% |
-29.17% |
0.81 |
14.87% |
|
|
96.75% |
13.60% |
-32.05% |
0.74 |
16.47% |
|
|
91.02% |
12.97% |
-29.58% |
0.79 |
14.41% |
|
|
92.16% |
13.10% |
-32.75% |
0.77 |
15.24% |
|
|
94.59% |
13.37% |
-30.13% |
0.8 |
14.96% |
|
|
85.70% |
12.37% |
-39.56% |
0.59 |
20.22% |
|
|
84.54% |
12.24% |
-32.87% |
0.72 |
15.26% |
Data calculated with Portfolio123
VSDA is the second best performer of the list after SPY by a short margin, almost on par with DGRW. All dividend growth funds listed here beat SPY in risk-adjusted performance (Sharpe ratio), except RDVY and NOBL.
VSDA has confirmed its leadership in 2022 to date:
VSDA vs. competitors (Portfolio123)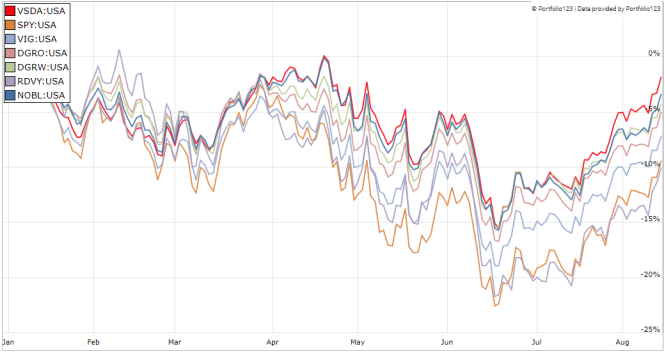
Comparing VSDA with a reference strategy based on dividend and quality
In previous articles, I have shown how three factors may help cut the risk in a dividend portfolio: Return on Assets, Piotroski F-score, and Altman Z-score.
The next table compares VSDA since inception with a subset of the S&P 500: stocks with a dividend yield above the average of their respective indexes, an above-average ROA, a good Altman Z-score and a good Piotroski F-score. It is rebalanced quarterly to make it comparable with VSDA index.
|
Total Return |
Annual.Return |
Drawdown |
Sharpe ratio |
Volatility |
|
|
VSDA |
95.23% |
13.44% |
-29.17% |
0.81 |
14.87% |
|
Dividend quality subset |
92.78% |
13.17% |
-34.26% |
0.71 |
17.41% |
Past performance is not a guarantee of future returns. Data Source: Portfolio123
VSDA beats the S&P 500 dividend and quality subset by a short margin (27 bps annualized), which is a good point for the fund. My core portfolio holds 14 stocks selected in this subset (more info at the end of this post).
VSDA Value and Quality
VSDA is significantly cheaper than SPY regarding Price/Earnings and Price/Sales ratios (see next table). It is a bit more expensive in Price/Book and Price/Cash Flow.
|
VSDA |
SPY |
|
|
P/E TTM |
17.79 |
20.15 |
|
Price/Book |
4.33 |
3.85 |
|
Price/Sales |
1.83 |
2.55 |
|
Price/Cash Flow |
16.41 |
15.85 |
Data: Fidelity
VSDA has only one risky stock regarding my metrics. In my ETF reviews, risky stocks are companies with at least 2 red flags among: bad Piotroski score, negative ROA, unsustainable payout ratio, bad or dubious Altman Z-score, excluding financials and real estate where these metrics are less relevant. Here, the risky stock is Stanley Black & Decker (SWK) and it weighs only 0.8% of asset value, which is negligible.
According to my calculation of the weighted average metrics reported in the next table, VSDA quality is superior to the benchmark. The return on assets is especially good.
|
VSDA |
SPY |
|
|
Altman Z-score |
4.87 |
3.48 |
|
Piotroski F-score |
6.05 |
5.99 |
|
ROA% TTM |
11.64 |
7.39 |
Takeaway
VSDA is a dividend growth fund holding shares of 75 companies, mostly large and mid-caps. It is heavy in industrials, with 29% of asset value in this sector. VSDA is more attractive than SPY regarding valuation and quality metrics. It is almost on par with the benchmark in total return since inception, and beats some of the most popular dividend growth ETFs. It shows a relatively low risk measured in drawdown and volatility. VSDA has a good rating at Morningstar: four stars on a maximum of five. A minor inconvenience is liquidity: low trading volumes require to use limit orders and excludes VSDA from short-term trading instruments. For transparency, a dividend-oriented part of my equity investments is split between a passive ETF allocation (VSDA is not part of it) and my actively managed Stability portfolio (14 stocks), disclosed and updated in Quantitative Risk & Value.
Be the first to comment