

kanawatvector
Dear Partners,
In Q2 2022, the Voss Value Fund, LP and the Voss Value Offshore Fund, Ltd., returned -10.3% and -10.4% to investors net of fees and expenses, respectively, compared to –17.2% total return for the Russell 2000, -15.3% total return for the Russell 2000 Value, and -16.1% total return for the S&P 500.
As of June 30th, 2022, the Fund’s total gross exposure stood at 139.2% and the net long exposure was 80.6%. Our top 10 longs had a weight of 73.9%, and our top 10 shorts had a weight of -27.4%.
Long/short strategy[1] assets under management stood at approximately $270.3 million and Firm assets stood at approximately $334.3 million as of June 30th, 2022.
Voss Value Master Fund Complex
|
NET MONTHLY PERFORMANCE | 2022 |
|||||
|
PERIOD |
Voss Value Fund, LP |
Voss Value Offshore Fund, Ltd. |
Russell 2000 TR |
Russell 2000 Value TR |
S&P 500 TR |
|
JANUARY |
-9.9% |
-9.9% |
-9.6% |
-5.8% |
-5.2% |
|
FEBRUARY |
4.4% |
4.3% |
1.1% |
1.7% |
-3.0% |
|
MARCH |
0.5% |
0.5% |
1.2% |
2.0% |
3.7% |
|
1st QUARTER |
-5.5% |
-5.5% |
-7.5% |
-2.4% |
-4.6% |
|
APRIL |
-9.4% |
-9.4% |
-9.9% |
-7.8% |
-8.7% |
|
MAY |
9.7% |
9.7% |
0.2% |
1.9% |
0.2% |
|
JUNE |
-9.8% |
-9.8% |
-8.2% |
-9.9% |
-8.3% |
|
2nd QUARTER |
-10.3% |
-10.4% |
-17.2% |
-15.3% |
-16.1% |
|
JULY |
|||||
|
AUGUST |
|||||
|
SEPTEMBER |
|||||
|
3rd QUARTER |
0.0% |
0.0% |
0.0% |
0.0% |
0.0% |
|
OCTOBER |
|||||
|
NOVEMBER |
|||||
|
DECEMBER |
|||||
|
4th QUARTER |
0.0% |
0.0% |
0.0% |
0.0% |
|
|
YEAR TO DATE |
-15.2% |
-15.3% |
-23.4% |
-17.3% |
-20.0% |
The table below shows the Voss Value feeder fund returns compared to some of the relevant indices:
|
Net Return Comparison as of June 30th, 2022 |
||||||||
|
1 Month |
3 Month |
YTD |
1-Year |
Compound Annual Growth Rate |
||||
|
3-Year |
5-Year |
10-Year |
ITD(1) |
|||||
|
Voss Value Fund, LP |
-9.8% |
-10.3% |
-15.2% |
-14.2% |
13.8% |
15.7% |
17.0% |
17.0% |
|
Voss Value Offshore Fund, Ltd. |
-9.8% |
-10.4% |
-15.3% |
-14.6% |
– |
– |
– |
15.6% |
|
S&P 500 |
-8.3% |
-16.1% |
-20.0% |
-10.6% |
10.6% |
11.3% |
13.0% |
14.1% |
|
Russell 2000 |
-8.2% |
-17.2% |
-23.4% |
-25.2% |
4.2% |
5.2% |
9.4% |
11.0% |
|
Russell 2000 Value |
-9.9% |
-15.3% |
-17.3% |
-17.0% |
2.0% |
2.4% |
7.7% |
9.5% |
|
Russell 2000 Growth |
-5.4% |
-18.5% |
-28.8% |
-32.8% |
-3.2% |
1.9% |
7.8% |
9.5% |
|
HFRX Equity Hedge Index |
-2.0% |
-4.4% |
-4.7% |
-0.9% |
5.6% |
3.7% |
3.6% |
3.3% |
| (1) Inception to Date measures the time period from Voss Value Fund, LP’s inception date of October 1st, 2011, and from Voss Value Offshore Fund, Ltd’s inception date of January 1st, 2020. |
It is hard to give an adequately descriptive account of how chaotic the market has felt this year. Seldom has the world witnessed such a confluence of disasters (mostly caused by relentless government meddling) all at once. Negative headlines and societal problems have engulfed us like a swarm of bees. No single metaphorical bee is overly frightful by itself – one sting here or there is just a minor nuisance, really.
However, taken together they understandably form an overwhelming buzz of angst that underlies the market’s severely depressed psyche, leading to the worst sentiment in history by a variety of measures.1 We’ve heard pundits make comparisons between the current period and the worst parts of the 1920s, 1930s, 1960s, 1970s, 1980s, and 2000s… once even by the same person, in the same breath.2
Fortunately, as shown below, confidence surveys are not predictive of the market’s forward returns and in previous “vibes recessions,”3 freefalling sentiment did not foretell plunging personal consumption expenditures.
Sources: University of Michigan: Consumer Sentiment Index (CSI), Bloomberg, Bureau of Economic Analysis 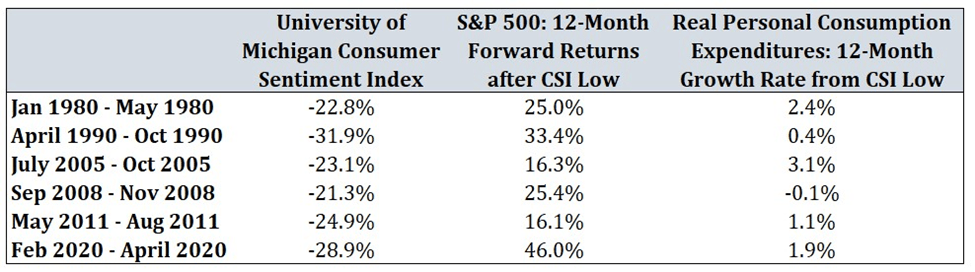
The Wilshire 5000 has returned -22% over the last 6 months, its 11th worst rolling 6-month performance ever.4 By comparison, from October 2008 to March 2009, the Wilshire 5000 was -31.3% (and subsequently returned +36% over the next 6 months and +52% over the next twelve months).5 At that time, some market participants were worried about the total collapse of the banking system.
Now, the banking/corporate/consumer leverage picture couldn’t be more different, in our opinion. We believe the most catastrophic scenarios being bandied about will not develop and play out despite being priced in some pockets of the market.
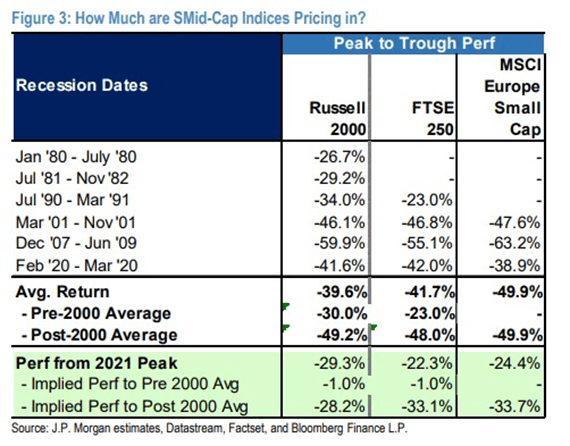
Judging from history, we think the ~30% correction experienced thus far in small cap equities already discounts a mild recession.6 In other words, we can have an economic slowdown and stocks are likely to rally on bad news because it will have been priced in long ago.
Voss’s long portfolio (as of mid-July) trades at a weighted average FCF yield of 19.0%7, its highest ever (despite only ~1% energy exposure). To us, this signals that our investments are likely pricing in nasty negative earnings revisions despite—in some cases—our expectations that earnings estimates will rise materially in the coming quarters. Case in point: Extreme Networks (EXTR).
Extreme Networks, Inc. (EXTR) Update
EXTR is now the Voss Value Fund’s third largest position at 10% of the portfolio (behind GFF and SWIR). EXTR is a leader in wireless and wired networking equipment (switches, access points, routers), particularly in large scale, complex wi-fi deployments such as hospitals and sprawling university campuses. The Fund has owned EXTR since the middle of 2020 and have previously shared our research on it publicly (see the Voss Q3 2020 Quarterly Letter).
At the start of 2020, the company had a >3.0x net leverage ratio and new product orders briefly collapsed around the Covid-related shutdowns. Fast forward to today and leverage is under 1.0x and the shares are even cheaper at 7.5x our next twelve months free cash flow estimate (as of the middle of July), despite their product order backlog being well over 10x what is historically normal. In other words, right as its valuation hits a historic low on a free cash flow basis, we believe the company’s visibility has never been higher.
As EXTR’s backlog is realized over the next ~10 quarters, combined with its burgeoning software platform that is just now hitting significant scale (generating >$100 million in recurring revenue while growing 40% year-over-year), we believe the company will generate $750 million in free cash flow over the next three years, which compares favorably to a current market cap of just $1.2 billion and an enterprise value of $1.4 billion.
In our view, consensus estimates are far too low for each of the next three years. Even as we heavily discount management’s long-term guidance and assume a slower fiscal 2024 from a bookings (signed contracts) perspective, we get the following profile:
|
$ in Millions |
FY 2022 |
FY 2023 |
FY 2024 |
FY 2025 |
FY 23-25 Cum |
|
Headline FCF |
$105.0 |
$186.30 |
$269.6 |
$307.7 |
$763.6 |
|
SBC Dilution Cost |
$47.50 |
$50.0 |
$52.5 |
$150.0 |
|
| FCF Build |
$138.80 |
$219.6 |
$255.2 |
$613.6 |
|
|
Enterprise Value (End of FY) |
$1,914.40 |
$1,775.70 |
$1,556.1 |
$1,300.9 |
|
|
EV/FCF Multiple at $13/share |
9.5x |
5.8x |
4.2x |
With the stock’s valuation and risk/reward profile arguably much more attractive now than at the time of our first purchases when the stock was $4, why does the opportunity exist? First, to state the obvious, almost all small cap tech stocks have been brutally bludgeoned—dragged down by the non-profitable tech stock bubble bursting.8 Furthermore, from our vantage point the market is suffering from a combination of short-termism and lack of faith in management’s detailed outlook that was presented recently at their analyst day on June 2nd.
If the management team is even near the ballpark of executing on their 3-year vision, the stock will be trading at 4x FCF given the enormous amounts of cash we expect to accrue on the balance sheet between now and FY 2025 (ended June 2025).
From discussions with resellers/channel partners and competitors, to attending their user conference and speaking with customers, converging lines of evidence from multiple independent sources support the plausibility that EXTR is taking market share in real-time from Cisco (CSCO) and is poised to show robust growth— even through a hypothetical industry downturn that exceeds the magnitude of 2009’s.
EXTR’s hardware order backlog is typically $20 – $40 million in any given quarter comprised solely of orders that came in near the end of the quarter as they normally ship every order they get immediately. Today that backlog stands at $513 million, and their lead times are the lowest in the industry (certainly ahead of Cisco, who is prioritizing their largest customers). The vast majority of the orders are wanted “as soon as possible.”9
Additionally, it appears management has enough visibility in the sales pipeline and order trends to publicly state they believe the backlog will continue to grow through Fiscal Year 2023:
“Next year, we talked about adding – growing the top line because of releasing supply chain. But we’ll still be constrained. So, we’ll add another – we expect maybe $150 million, call it in backlog.” -CEO Ed Meyercord, Needham Tech and Media, May 19th, 2022
If that does indeed come to fruition, we estimate the Product backlog would be around $600 million a year from now when their Fiscal 2023 ends. A key to remember is that these are non-cancellable orders.
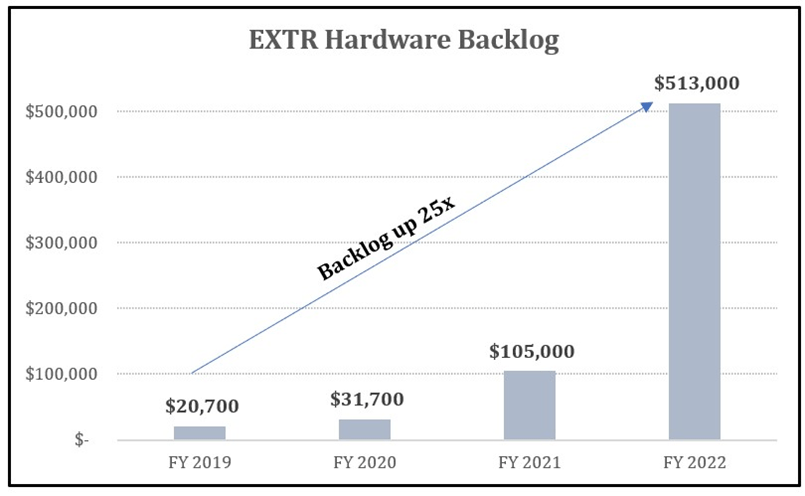
The backlog going from $105 million to $513 million in FY 2022 means that over the last 12 months EXTR has temporarily foregone over $400 million of high incremental margin revenue that they would have recognized if they weren’t supply constrained. There is also significant service and software revenue tied to this hardware backlog, as customers will sign software deals once the hardware ships. Thus, we estimate these forthcoming hardware sales will provide an additional $75 million in recurring software and services revenue.
By our calculations, if backlog had remained static over the last four quarters, revenue growth would have been > 45% over the past year, rather than the 10% they reported. SaaS subscription revenue, already impressive at $100 million ARR and growing at 40%, would be closer to $150 million. While we don’t expect 45% growth to be sustainable, in our view the company is being valued as a 10% (or lower) grower rather than the market share taker in a positively trending industry with secular growth tailwinds.
The company should also have some additional hardware revenue buffers in FY2024 and 2025 after they work through the current backlog, as they have two major projects with Verizon (VZ) and Ericsson (ERIC) that could generate an incremental $75-$100 million in revenue a year for several years in a row. And although we are not currently modeling it, we also expect them to continue to take market share from Cisco.
This is important because each 1% market share gain is quite impactful to Extreme, i.e., ~$200 million in incremental revenues, and ~$75 million in annual FCF. With our channel checks indicating that Cisco has “all but abandoned” the middle market, we think EXTR has a timely window of opportunity to take more market share.
ExtremeCloud IQ
The second major driver that is increasing visibility is the emergent scaling of the ExtremeCloud IQ platform. Back in 2020, while the company was growing their cloud bookings at a strong pace, it was off a low (and undisclosed) base. The company was moving a lot of their customer base, particularly their wireless equipment base, to subscription contracts.
Now, even as the company has passed $100 million in ARR for their Cloud Management software, there are several credible growth drivers that we believe make management’s seemingly aggressive forecast (+40% ARR CAGR 2022-2025) realistic and maybe even conservative. Here are the main drivers as we see them:
1.Backlog: As mentioned, there is significant Cloud IQ revenue coming from the giant hardware backlog, likely in the range of $50 million of subscription revenue just in the current backlog (in addition to another ~$25 million of annual maintenance revenue).10
2.Renewals: The most common duration of a subscription contract is three years. Of note, customers were put on “teaser” rates initially, with the expectation that pricing would rise at the time of renewal. The company is just now beginning to enter a period of large potential renewals (really ramping in 3-4 quarters from now as we lap three years for customers who signed in 2020) and expects 90%+ gross customer retention, with net revenue retention moving towards 100%. Given the large discount given initially and the hassle of a “rip and replace,” we think this 100% bar seems attainable and likely conservative.
3.Copilot/Digital Twin: The company has also been beta testing the “next generation” of features that automates the network in the form of new modules called Copilot and Digital Twin. Copilot adds significant additional features that allows for network automation, while Digital Twin is a cloud-oriented solution that allows for more robust, virtualized testing infrastructure. In addition to getting higher base prices on their renewals, EXTR’s sales force will be attempting to upsell these new modules, which carry 50-60% ARPU increases.11
4.SD-WAN: The company has fully integrated and launched their SD-WAN (software defined wide area network) product into the market that they acquired last year (Ipanema). SD-WAN, when deployed, will carry a very significant uplift to ARPU. It’s our understanding that to hit their growth targets, they need only penetrate about 2% of their 50,000 customers over three years, and only are targeting 250 SD-WAN customers in 2023. This would represent ~20% of their total estimated ARR growth over the next few years.
All four of these drivers seem to be quite significant and it appears reasonable to us that ARR could move from ~$105 million at the end of June 2022 to $250 million by 2025 (matching the midpoint of the 40% CAGR management is guiding to). However, for now we are modeling 34% cloud revenue growth as we are taking what we believe to be a conservative approach on renewals until we see more evidence of solid sales execution.
We would also note in our view that most of the cannibalization in moving some of their software revenue to ExtremeCloud IQ has already occurred. Their software license/maintenance was around $40 million a year and it has now dropped to under $12 million a year, so one will soon see a positive inflection in total Recurring Revenue dollars and thus the stock will likely screen better and potentially begin to attract more growth focused software investors.
Management has said that expedited shipping and elevated freight rates have knocked down product gross margins by an incredible 700-900 bps12, and that as freight rates return to earth, they will start to reap the benefits of their significant SKU count reduction and product consolidation onto their Universal Hardware platform. However, for the sake of conservatism, we assume hardware gross margins do not rise above 60% (vs management’s guidance of 64%) as it is possible, they have to give back some of their recent price hikes as industry supply constraints ease.
EXTR shares look very attractive on a relative value basis versus its larger networking equipment peers, as well as on an absolute basis at 9x our NTM FCF estimates (our FCF estimate is ~50% above the consensus estimate), even after the stock’s recent run from $8.50 to ~$13. At 8x our Bear case FCF estimate, the stock has downside to only ~$9 (hence our significant upsizing of the position recently <$9), and at 15x our bull case 2025 FCF estimate, our price target moves up to ~$40.
We take comfort in the fact that in 2008, EXTR’s product revenue grew and in 2009 it declined by only 9.5%.13 Given their product order backlog is currently ~25x the size it was at the end of 2019, we are comfortable that EXTR can grow even through an economic depression. The risks for Extreme mostly revolve around timing and management credibility on forecasts. At times they have been overly optimistic, particularly around forecasts from acquisitions, as well as recently around gross margins.
However, if management loses additional credibility and the stock gets stuck in a penalty box, we believe there would be strategic suitors who would be interested in acquiring the company for its customer base and industry-leading cloud technology, along with significant sales and marketing and R&D synergies. Valued at an enterprise value of just 2x gross profit and 9x FCF, the risk feels highly asymmetric to the upside.
Conclusion
Each bull and bear market will present our team with new challenges, but behind all the whacky twists and turns, certain invariant patterns will remain. Some of those include the fact that market participants routinely anchor to and panic over irrelevant data, fail to frame information with the proper scale and context, and the vast majority of participants will continue to buy and sell stocks purely for non-fundamental reasons. We try to cut through the Gordian Knot and infinite macro noise by focusing on bottom-up valuation, and more specifically, recent and relevant transaction comps for industries we are invested in.
Week-by-week, month-by-month, we are aiming to cultivate wisdom, minimize dogma, exercise valuation discipline, and reduce the chance that what we’re modeling in is being driven by self-deception. There is no doubt the market will continue to find novel ways to disrupt our collective equilibrium, but we will be mentally ready and flexible enough to accommodate and capitalize on a wide range of plausible outcomes.
Sincerely,
Voss Team
Appendix:
|
[1] Includes the Voss Value Master Fund and SMA 1: University of Michigan Consumer Sentiment survey in June hit an all-time low reading. 2: Travis heard this argument on a macro focused Twitter Spaces hosted by @notabigdeal111 in June. 3: “The Vibes Recession” – article by Politico 6/10/2022 4: Source: Bloomberg and Bespoke Investment Group. January 3rd, 2022 – July 1st, 2022. 5: Bloomberg 6: Source: JP Morgan Research 7: Source: Voss investment team estimates, includes a combination of Price/2023 Free Cash Flow Estimates and Price/Next Twelve Months Free Cash Flow estimates, company-by-company. 8: Average small cap tech stock down by >50% from peak as of mid-July. Source: Factset. 9: Disclosure from EXTR’s analyst day presentation. 10: Voss estimates 11: Source: Discussions with Extreme employees 12: Source: EXTR CFO during Analyst Day remarks and various public calls. 13: Source: Extreme’s SEC filings |
Common Terms
|
CAGR – Compound Annual Growth Rate |
GDP – Gross Domestic Product |
|
DCF – Discounted Cash Flow |
IRR – Internal Rate of Return |
|
EBITDA – Earnings Before Interest, Taxes, Depreciation & Amortization |
LTM – Last Twelve Months |
|
EPS – Earnings per Share |
NTM – Next Twelve Months |
|
EV – Enterprise Value |
P/E – Price to Earnings |
|
FCF – Free Cash Flow |
YTD – Year to Date |
Editor’s Note: The summary bullets for this article were chosen by Seeking Alpha editors.
Be the first to comment