

Shahid Jamil
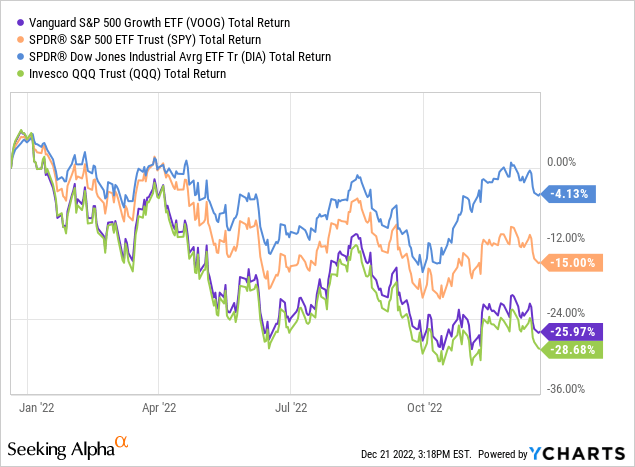
The big high-tech technology stocks have gotten absolutely hammered by the 2022 bear-market. That being the case, the Vanguard S&P 500 Growth ETF (NYSEARCA:VOOG) has gotten creamed as well and has significantly underperformed the broad (DIA) and (SPY) market averages and has barely beaten the returns of the battered (QQQ) Nasdaq-100 (see below). However, as will be discussed below, the earnings of the leading companies in the VOOG ETF have not fallen off a cliff. They continue to have large cash positions and they continue to generate strong free cash flow. That being the case, perhaps the big decline in VOOG this year might be an opportunistic entry point for those investors that might find themselves underweight the sector. Let’s take a look.
Top-10 Holdings
The top-10 holdings in the VOOG ETF are shown below and were taken directly from the Vanguard VOOG ETF webpage – where you can get more detailed information on the fund. The top-10 holdings equate to a moderately diversified 49.2% of the entire 242 company portfolio:
Vanguard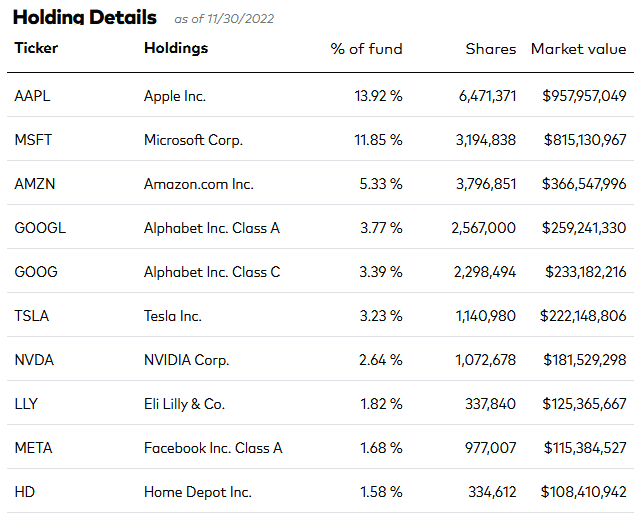
My first observation is that, VOOG’s top-4 holdings are the same as held by the Vanguard S&P 500 ETF (VOO), but VOOG’s allocation is roughly 2x higher. For instance, the VOO ETF has a 6.47% weight in Apple (AAPL) and a 5.5% allocation to Microsoft (MSFT).
The second observation is that this fund has nearly 26% allocated to Apple and Microsoft alone. That being the case, an investor that already has a full-weight position in those two stocks may want to look for a growth ETF that will offer him or her better diversification.
Meantime, the #1 holding is Apple with a 12.9% weight. AAPL is down 20% this year. Despite supply-chain challenges in China, and a likely large-scale re-shoring effort away from China (can you say margin compression?), Apple posted solid Q4 earnings in October. Highlights included:
- A quarterly record in EPS and revenue.
- Active installed base of devices reaches all-time high for all major product categories.
- Q4 revenue of $90.1 billion was +8% yoy, and quarterly EPS was $1.29, +4% yoy.
After buying back $29 billion in shares during the quarter, Apple still ended Q4 with $58.2 billion in cash and marketable securities.
Microsoft is down 25% this year despite posting relatively strong Q1 FY23 earnings back in October. Highlights of the report included:
- Revenue of $50.1 billion was +11% yoy (+16% in constant currency)
- Operating income of $21.5 billion was +6% (up 15% in constant currency)
- Net income of $17.6 billion was -14% (down 8% in constant currency)
- Diluted EPS was $2.35, -13% (down 7% in constant currency)
Microsoft Cloud was a bright spot as revenue of $25.7 billion was up 24% yoy (up 31% in constant currency). Free cash flow of $16.9 billion was actually down 10% yoy, but as mentioned on the Q1 conference call, that was mostly due to a tax-related event.
Microsoft currently trades with a P/E = 26.4x and pays a $2.72/share annual dividend for a yield of 1.12%.
If we count both classes of Google stock (GOOG)(GOOGL), it is the #3 holding in the VOOG ETF with a 6.1% aggregate weight. Google posted a relatively solid Q3 earnings report in October, but growth clearly slowed. I say ‘relatively solid” because despite the consensus opinion that Google hired more people than it should have (and I agree), the company still generated $16.1 billion in free cash flow during the quarter. Many companies would like to generate that much FCF in an entire year, let alone one quarter. So, despite the general narrative out there, my Seeking Alpha article pointing out that Q3 Results: Google Generated $7.3 Billion More FCF Than Chevron was quite popular because that obviously surprised a goodly number of investors who are not familiar with Google’s free-cash-flow profile.
As I reported in that article, Google Cloud continued to post strong momentum with revenue of $6.9 billion (up 37.6% yoy) while on the Q3 conference call we learned that GC expanded relationships with Toyota, Prudential, Coinbase and AppLovin.
GOOG ended Q3 with $116.26 billion of cash & cash equivalents, or an estimated $8.88/share in cash.
Tesla (TSLA) has been a complete disaster this year, both from a stock-performance standpoint (down 65%) and from a CEO performance perspective. Arguably, Musk’s handling of the Twitter acquisition has been “poor”, to put it mildly. Opening the platform back up to Trump, QAnon members, and anti-vaxers – all of which were suspended in the past for either outright false or dangerous posts – while at the same time suspending journalists at CNN, the NY Times, and the Washington Post did little to convince investors (and, more importantly, Tesla car buyers …) that Musk’s acquisition had anything to do with “free speech”. After all, the only “sin” the journalists made was, apparently, having the unmitigated audacity to simply factually report on the actions Musk was taking at Twitter. The stock, meantime, is trading with a forward P/E = 33.2x, the lowest I can ever remember seeing it.
Nvidia (NVDA) is the #6 holding with a 2.6% weight. Nvidia’s Gaming Segment has been hit-hard this year (Q3 Gaming revenue was -50%+ yoy). But its Automotive and Data Center businesses are still growing. Nvidia also continues to build on its leading AI operations and recently released a new solution in its “Jetson” robotics ecosystem – a segment that holds excellent long-term potential:
Nvidia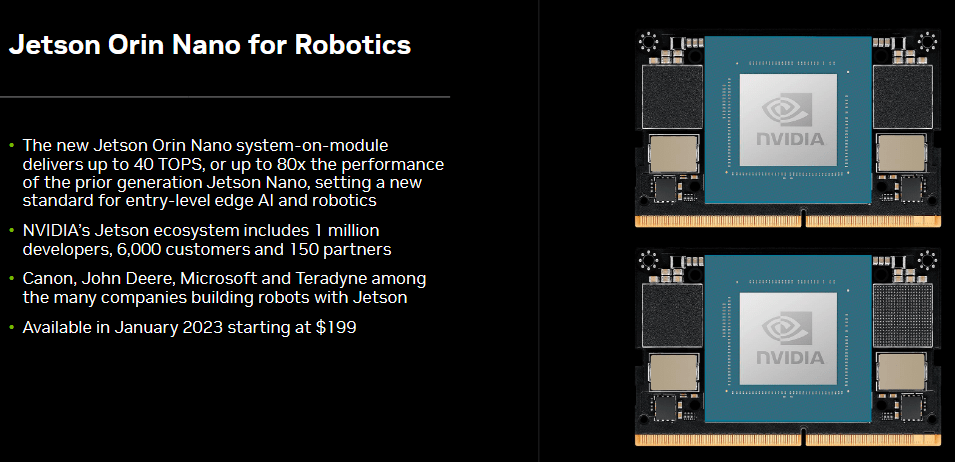
As the slide show, NVIDIA’s Jetson ecosystem now has 1 million developers, 6,000 customers and 150 partners – including Canon (CAJ), John Deere (DE), Microsoft and Teradyne (TER) – all of which are building robots with Jetson.
Eli Lilly (LLY), Facebook (META) and Home Depot (HD) round-out the top-10 holdings.
As for the VOOG portfolio as a whole, the graphic below compares some valuation metrics with that of the S&P500 as represented by the VOO ETF:
Vanguard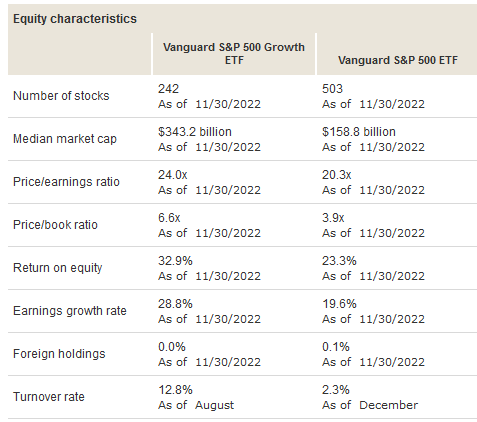
As can be seen in the graphic, from a P/E ratio standpoint, the VOOG ETF trades with a ~20% valuation premium as compared to the S&P500. For that richer valuation, investors get roughly 50% higher ROE and EPS growth.
Risks
The big high-tech companies that dominate the VOOG ETF are certainly not immune to the effects of the macro-environment: high inflation, higher interest rates, and the relative unknowns brought about by China’s attempt to reopen post Covid-19 and Russia’s horrible war-on-Ukraine can lead to a slowdown in the global economy and could lead to a global recession – perhaps even a severe one.
Also, these companies all have large overseas operations and sales. That being the case – and as pointed out in the Microsoft earnings discussed earlier – they are facing big foreign currency headwinds due to the strong U.S. dollar as a result of the Federal Reserve’s interest rate increases. However, note that the U.S. dollar may have already peaked in September, in which case a falling U.S. dollar would turn out to be a positive catalyst for these stocks:
Market Watch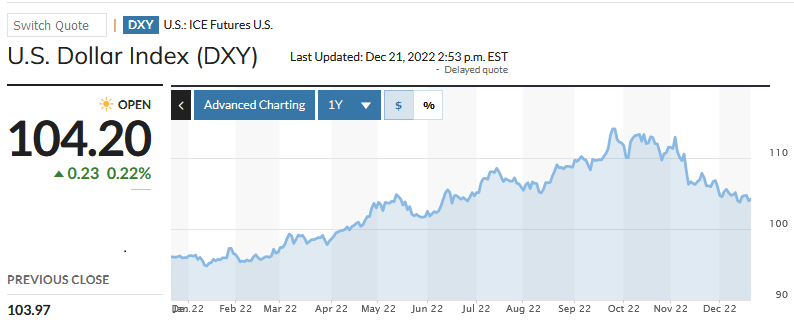
Summary & Conclusion
The VOOG ETF has been mauled by the 2022 bear-market and is down 25.8% over the past year. However, despite that hit, note that VOOG still has an average 10-year annual total return of 14.3%. That being the case, investors who are under-weight “big-tech” may want to consider allocating some cash to the sector. However, given current market volatility, and – in my opinion – the chances for a significant correction early next year, I would advise investors to average-in over time in order to reduce the risks of a big one-time purchase when a better entry point could well be in the offing.
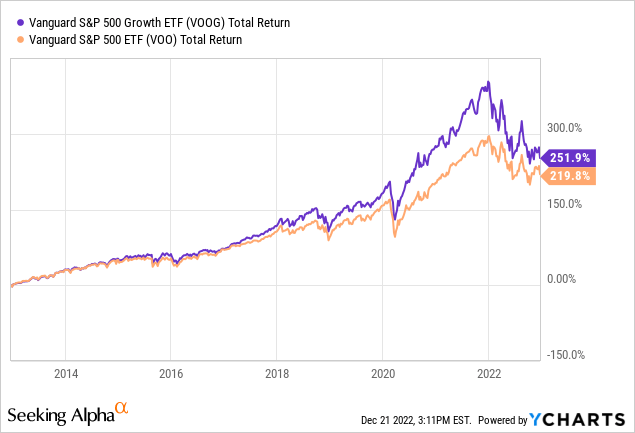
I will end with a 10-year total returns comparison of VOOG versus the VOO S&P 500 ETF, and note that while the VOO ETF has an expense fee of only 0.03% (7 basis points lower than the VOOG ETF), VOOG has outperformed VOO by 30%+ over the past decade:
Editor’s Note: This article discusses one or more securities that do not trade on a major U.S. exchange. Please be aware of the risks associated with these stocks.
Be the first to comment