

asbe/iStock via Getty Images
Overall gains for investors from the first 7 weeks of VBR picks have been good to acceptable, in my opinion. However, the recent split trend of outperformance vs. the S&P 500 index (equally weighting VBR choices from Friday closing values), with lagging performance vs. the closer-peer Russell 2000 index is continuing. I am a little frustrated that follow-through buying has been lacking in many of the 30 names in total selected since June 25th. My goal is regular “outperformance” of both major index creations, blue chips, and small caps.
One argument for the absence of extra buying may in fact be this: the sharp +15% U.S. equity market rise off its worst level in June (+20% for the Russell 2000) represents something of a bear market rally. Like I have mentioned in previous Seeking Alpha articles beginning in May, major bottoms in the stock market are typically “led” higher by gold prices and more often than not stronger performance by bank and financial sectors (a function of changed liquidity forces, especially after a panic or crisis). However, this has clearly not been the case in July-August.
Either the advance is a very atypical rise in stock quotes or just a rapid bounce and knee-jerk reaction to overly bearish trading setups in June (with high cash levels and short covering supporting the move). I am torn, kind of 50/50, on the macroeconomic environment backdrop. [Please take my market cynicism with a grain of salt and decide on your own what weightings to have in personal portfolio designs.] In the end, a relatively neutral outlook for U.S. equities generally over the next 6-12 months means stock picking is an endeavor of greater-than-usual importance moving forward.
I do expect some sort of retest of the summer market lows in coming months, at a minimum. I would interject much of the upside in price I expected between late May and early 2023 has already played out. I now suggest readers tread lightly in stocks for weightings, owning higher-than-normal cash levels (money market instruments should improve into the 2% to 3% area soon for yield as the Fed raises base bank-lending rates).
The Fed is promising to slow the economy meaningfully into Christmas with further rate hikes. In a Catch-22 fashion, the July-August Wall Street rebound may actually encourage additional rates hikes and perhaps at greater amounts, 0.75% instead of 0.5% at the September meeting for example. The Fed’s tightening actions to fight inflation, including the ability to flood the Treasury bond market with supply from $9 trillion in owned QE assets, are bad news for the economy and corporate profits.
On a positive note, I am happy to announce the Volume Reversal Report has found some big winners. Two that stand out are Broadwind (BWEN) and ShockWave (SWAV). Over a matter of weeks, both have risen nearly +45% after reaching VBR buy status. BWEN should be a real winner as more wind power is constructed in America with the global warming action, pollution-reducing incentives of the Inflation Reduction Act. ShockWave’s medical devices are selling faster than expected, with Q2 revenue numbers up +116% vs. 2021’s same quarter and +20% above Wall Street estimates. EPS was almost TRIPLE estimates, with a record of beating optimistic analyst projections by a wide margin for 4 straight quarters.
StockCharts.com, Author Reference Point, BWEN 1-Year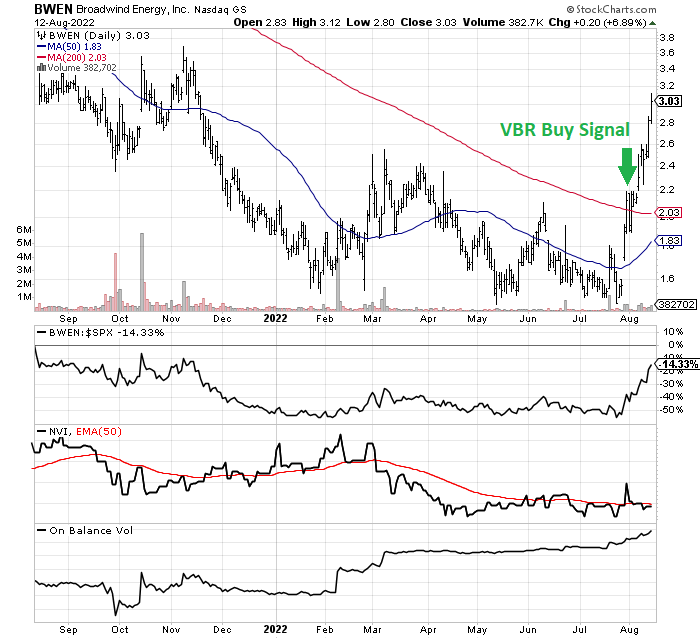
StockCharts.com, Author Reference Point, SWAV 1-Year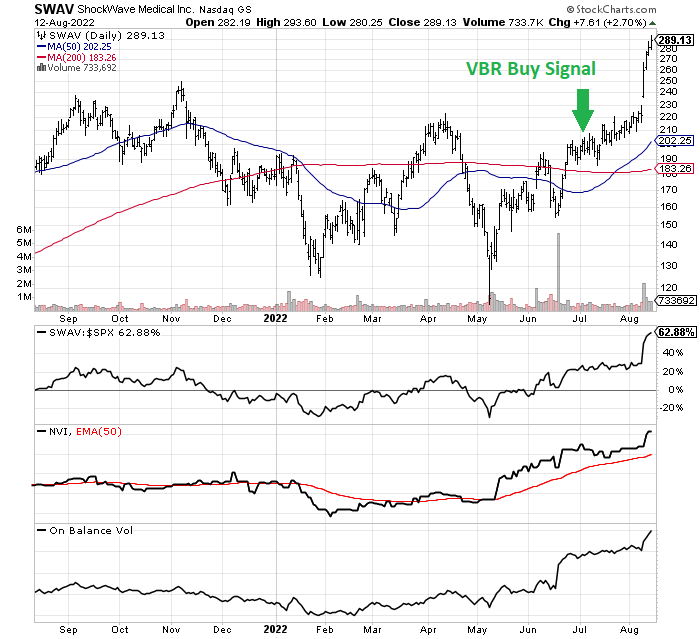
The past five weeks of price results for VBR selections are drawn below, which I am thinking will be the new rolling process going forward. My statistical research points to the first 6 to 8-weeks after each buy signal as providing the best chance at market outperformance. Repeating earlier analysis, the initial article picks from June 25th have turned out to be the weakest relative group so far (not pictured). I may update the performance of previous lists at a later date, for a longer-term perspective on success rates.
YCharts, VBR Picks from August 5th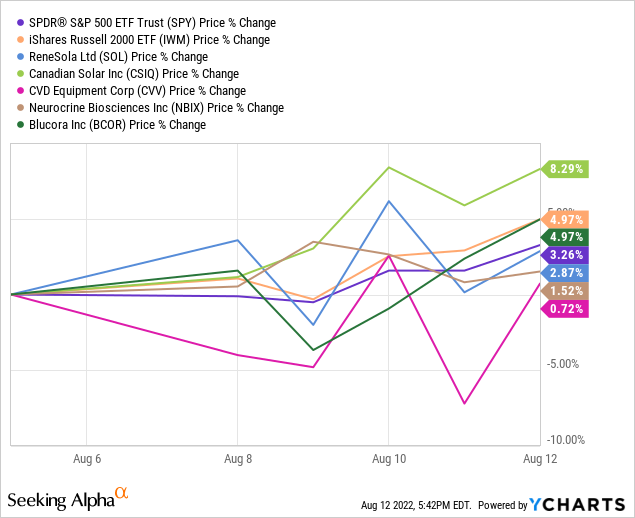
YCharts, VBR Picks from July 29th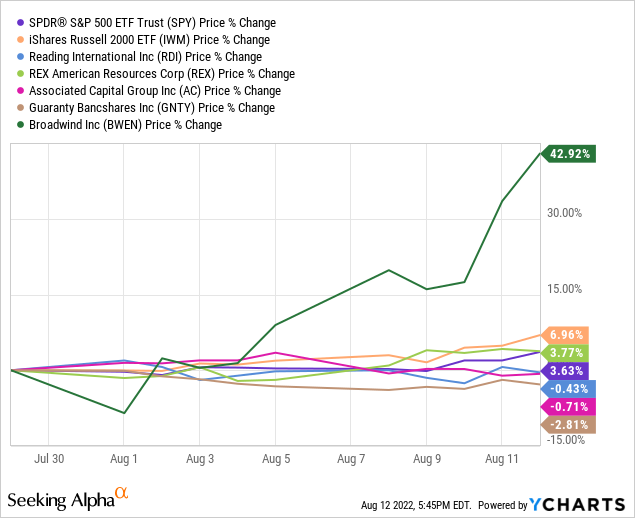
YCharts, VBR Picks from July 22nd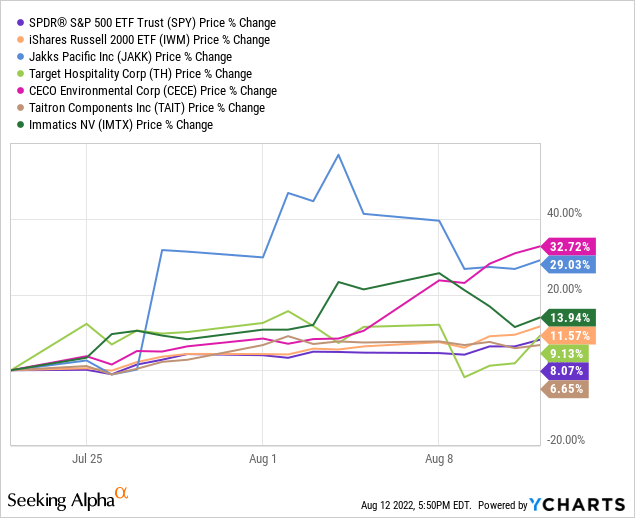
YCharts, VBR Picks from July 15th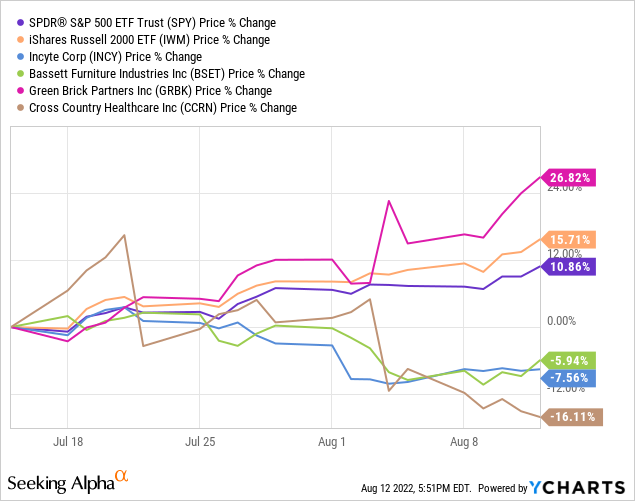
YCharts, VBR Picks from July 8th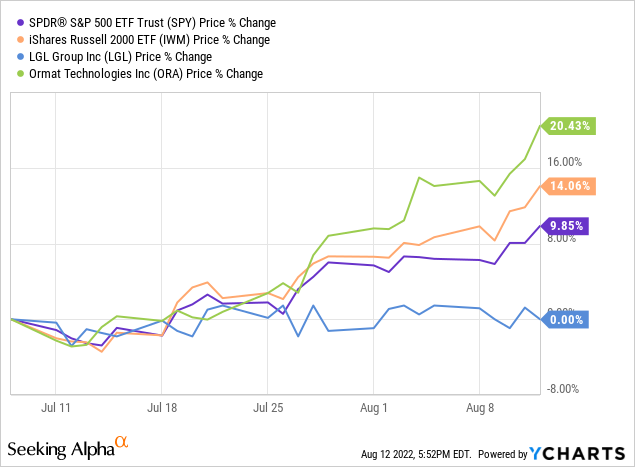
New VBR Buy Signals
Preformed Line Products
A stock with plenty of upside potential is Preformed Line Products (NASDAQ:PLPC), based in Ohio. In a rare setup, the business may begin a long-term growth expansion backed by TWO U.S. government spending packages passed by Democrats and the President in the middle of 2022. Both the added federal money for infrastructure upgrade programs, and the climate-change fighting program pushing for final passage in the days ahead, could propel growth for the company and shareholders into high gear. Preformed Line manufactures and sells items used by electric utilities, clean energy producers, telephone service providers, and cable operators.
Company Website
Without doubt, government-financed upgrades in the electrical power transmission networks of America will be necessary to accommodate rapid electric vehicle [EV] adoption. Transitioning from gas-powered cars and trucks to ones requiring large new electricity demand should drive company sales for many years.
An excellent bullish article was just written by Jeremy Blum here, and is worth your reading time. He is one of the top small cap writers on Seeking Alpha, with an enviable track record of big winners for investors, according to TipRanks. It would be interesting if the VBR quant-sorting formulas corroborate his strong buy enthusiasm for Preformed Line Products.
Doing a little bit of research, Preformed Line Products is incredibly cheap, using assumptions of flat operating results. Below is a 10-year graph of price to trailing earnings, sales, and book value. All three calculations are near decade lows. In addition, enterprise value (stock capitalization + debt outstanding – cash) to EBITDA is trading at a bargain multiple of 5.4x, far lower than the S&P 500 average close to 15x. I figure the stock quote is a good 40% discount to its 10-year average financial ratio setup!
YCharts, PLPC Basic Valuation Ratios, 10 Years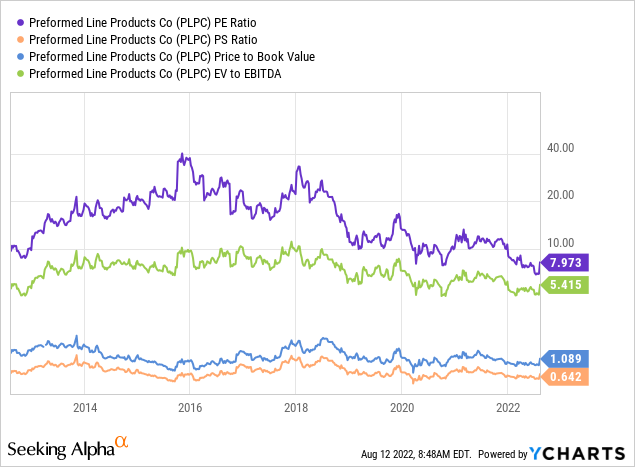
The balance sheet is liquid and ready to fund growth with $307 million in current assets like cash, receivables, and inventory vs. $204 million in total liabilities. Trading at 1.4x tangible book value, I find it hard to model a circumstance that will put price below $60 a share, absent an all-out stock market crash on Wall Street.
The best news is the company’s operations are already growing quickly, moving into a potential 5 to 10-year boom in U.S. electricity grid upgrades. Q2 2022 numbers included record quarterly sales and profits. Revenue grew +23% YoY and EPS was up +54%. It’s quite amazing Wall Streeters have not figured out the exceptional buy proposition offered by Preformed Line. Projecting a price of $150 per share in 12-18 months, or $200 in 18-24 months is not difficult from $76 today. Of course, the execution of management’s production ramp to meet growing orders and bookings will be key for the stock’s valuation and eventual price.
The share quote has been galloping higher following its August 4th earnings release. Investors have also been digesting the surprise climate-change bill and its super-positive repercussions for PLPC, given its minor $360 million market capitalization. The stock quote has risen 6 of the last 7 trading days on high volume, launching out of a low-volatility base pattern during all of 2022. On Balance Volume has been incredibly bullish since March, drawn on the chart below.
StockCharts.com, 1-Year PLPC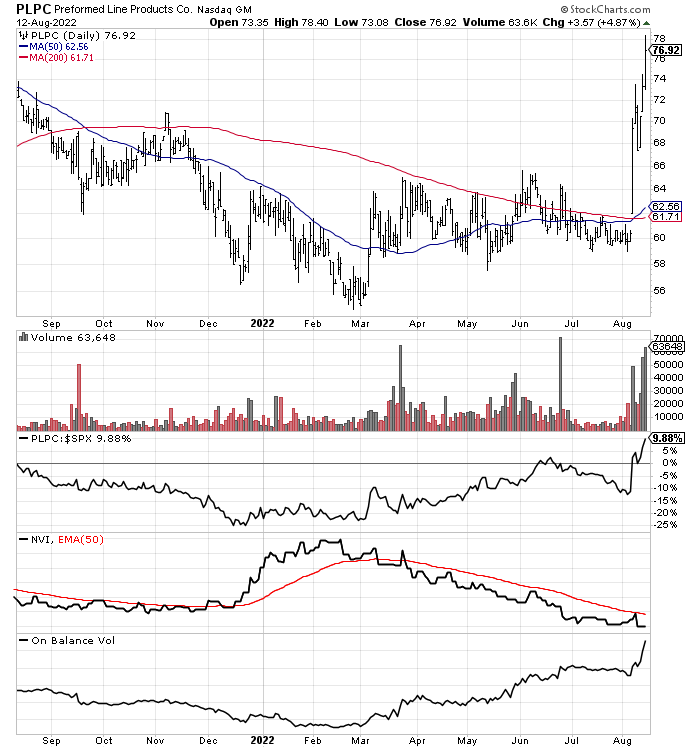
Thermon Group Holdings
An expanding-growth industrial products maker is Thermon Group (THR), focused on keeping things heated and warm under all types of weather and operating conditions. Air heaters, boilers and calorifiers, controlling and monitoring solutions, heat tracing systems, tank heating systems, thermostats, tubing bundles, heating blankets, and system accessories are proprietary offerings.
In terms of a gee-whiz stat, THR has closed higher 20 of the last 21 trading days, by my count. This run marks one of the top daily winning streaks I have seen in 2022. Negative Volume Index and On Balance Volume trends have been terrific since early July.
The good news is underlying company growth and financials may support a much greater percentage price gain into 2023. Current assets on the balance sheet match total liabilities, meaning rising sales and earnings should flow directly to shareholder value. The stock traded for $27 in early 2020 on lower sales and income per share vs. what’s projected for 2023.
StockCharts.com, 1-Year THR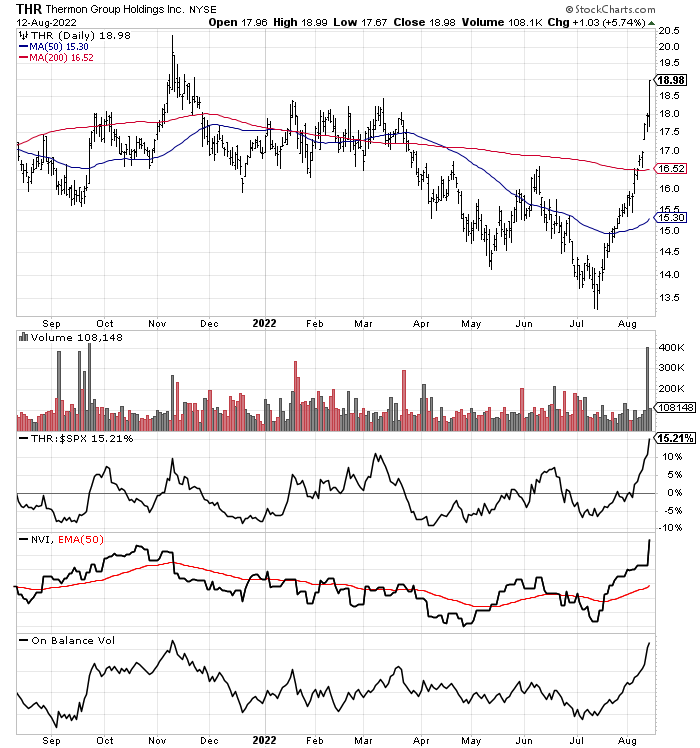
Wilhelmina International
One of the top fashion model, entertainment and athlete management agencies in America, Wilhelmina (WHLM) is something of a reopening play from COVID-19 lockdowns, especially in New York City. The company is small, but trades near tangible book value. Current assets are slightly greater than total liabilities. Consequently, as long as profits and cash flow continue to roll in the door, limited downside risk appears to be part of the investment equation. Below is a graph of current 10-year lows in price to trailing cash flow and EV to EBITDA ratios. If business improves into 2024, a double in the share price cannot be ruled out over the next 12-18 months.
YCharts, WHLM Basic Valuation Ratios, 10 Years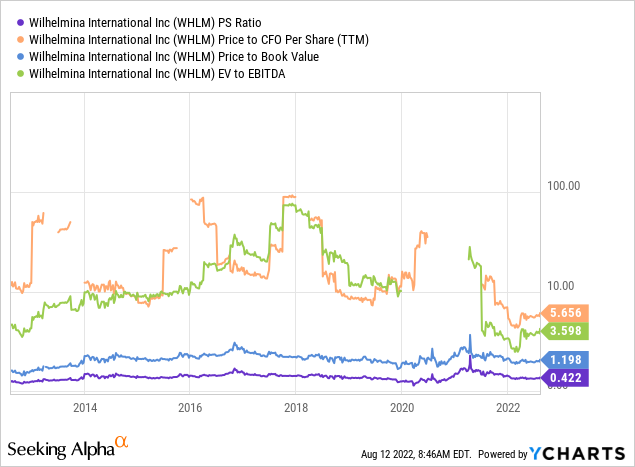
On the 12-month chart below, a high-volume breakout occurred on Thursday. Friday’s retreat brought price back to its 200-day moving average. On Balance Volume has been exceptional the past year and could be signaling a coiled spring is set to release, pushing price into a strong uptrend.
StockCharts.com, 1-Year WHLM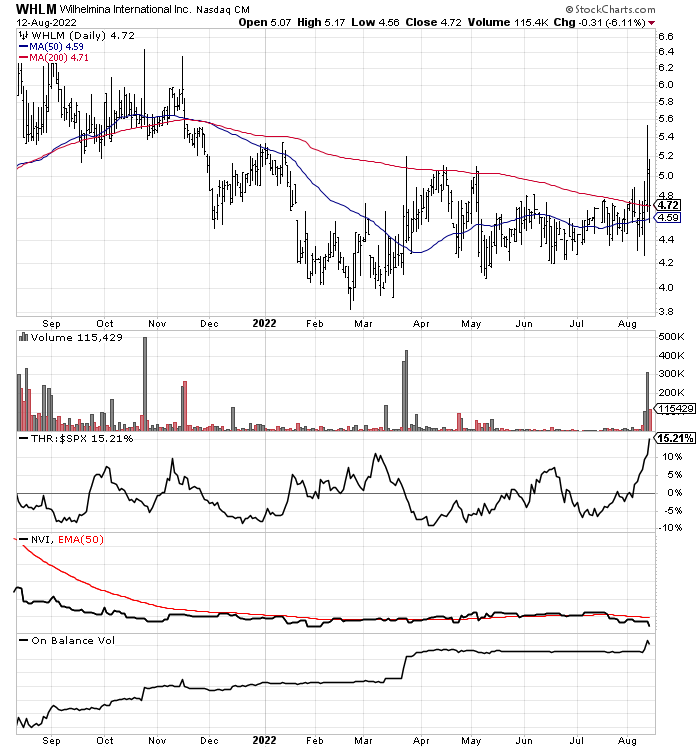
Imperial Brands PLC
Based in the U.K. and operating since 1906, Imperial Brands PLC (OTCQX:IMBBY) has experienced its strongest volume buying streak in August since July of 2021. Not a wild price swing pick, Imperial Brands acts more like a bond paying 8% annualized dividend yields today, backed by tobacco product sales in Europe. While I do not expect a big bump in price, the stock is trading at 8x trailing EPS and 5.5x free cash flow around $23 per share. Debt/leverage are declining and investors may be willing to overlook cancer-causing products, in search of better defensive plays on rising inflation rates or consumer brand-focused war hedges on the Eastern European mess (Russia/Ukraine).
In the end, assuming a major recession hits the world from rising interest rates, receiving the dividend plus minor price appreciation in the stock could deliver a solid total return of 15% to 20% over the next 12 months. Such an investment gain may prove well above the future S&P 500 equivalent return for conservative, income-oriented brokerage accounts. (The chart below includes Imperial’s high dividend payout as a price adjustment.)
StockCharts.com, 1-Year IMBBY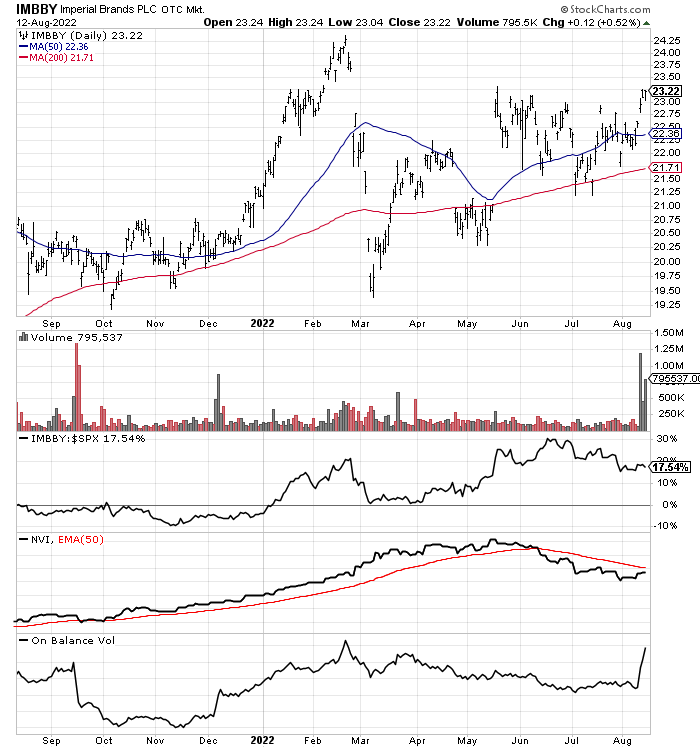
Final Thoughts
If you are new to the Volume Breakout Report, please read my past efforts to get a better explanation of what I am trying to accomplish. Here is a link to the July 9th update for starters, reviewing strategies for investing in a diversified list of VBR picks. Higher-than-normal volume on price gains is an important part of my daily computer search. I utilize as many as 15 indicators of technical trading momentum in my proprietary formulas, scored against thousands of equities, to find the best opportunities.
I suggest readers take the time to do further research into any of the VBR selections that appeal to you, a function of your risk appetite or sector exposure needs in portfolio construction. Please understand small-cap picks should be a limited portion of portfolio design. Holding a diversified number of stocks (at least 20-30) is the prudent risk-adjusted way to play them. Volatile price swings are part of the investing process for smaller companies on Wall Street. Please consider using preset stop-loss sell orders to reduce downside potential in individual names. Depending on your risk tolerance, 10% to 30% stop levels are recommended.
Thanks for reading. Please consider this article a first step in your due diligence process. Consulting with a registered and experienced investment advisor is recommended before making any trade.
Be the first to comment