

PM Images
The Vanguard Dividend Appreciation ETF (NYSEARCA:VIG) is currently the largest US-listed ETF with the word “dividend” in its name. As its name implies, VIG focuses more on dividend growth than on high dividend yield, which is why its current dividend yield of only 1.8% may seem low for investors focused on dividends. I believe that this short-coming is mostly due how VIG weights its stock positions, which like many other Vanguard funds, allocates significantly more to larger-cap companies (which tend to be higher yielding) than to smaller-cap companies that may have similar dividend growth prospects. In this article, I wanted to take a brief look at VIG and its holdings, and then focus on its 10 highest yielding (not most heavily weighted) non-financial stock holdings, and explain why I’d prefer to own those 10 stocks than VIG.
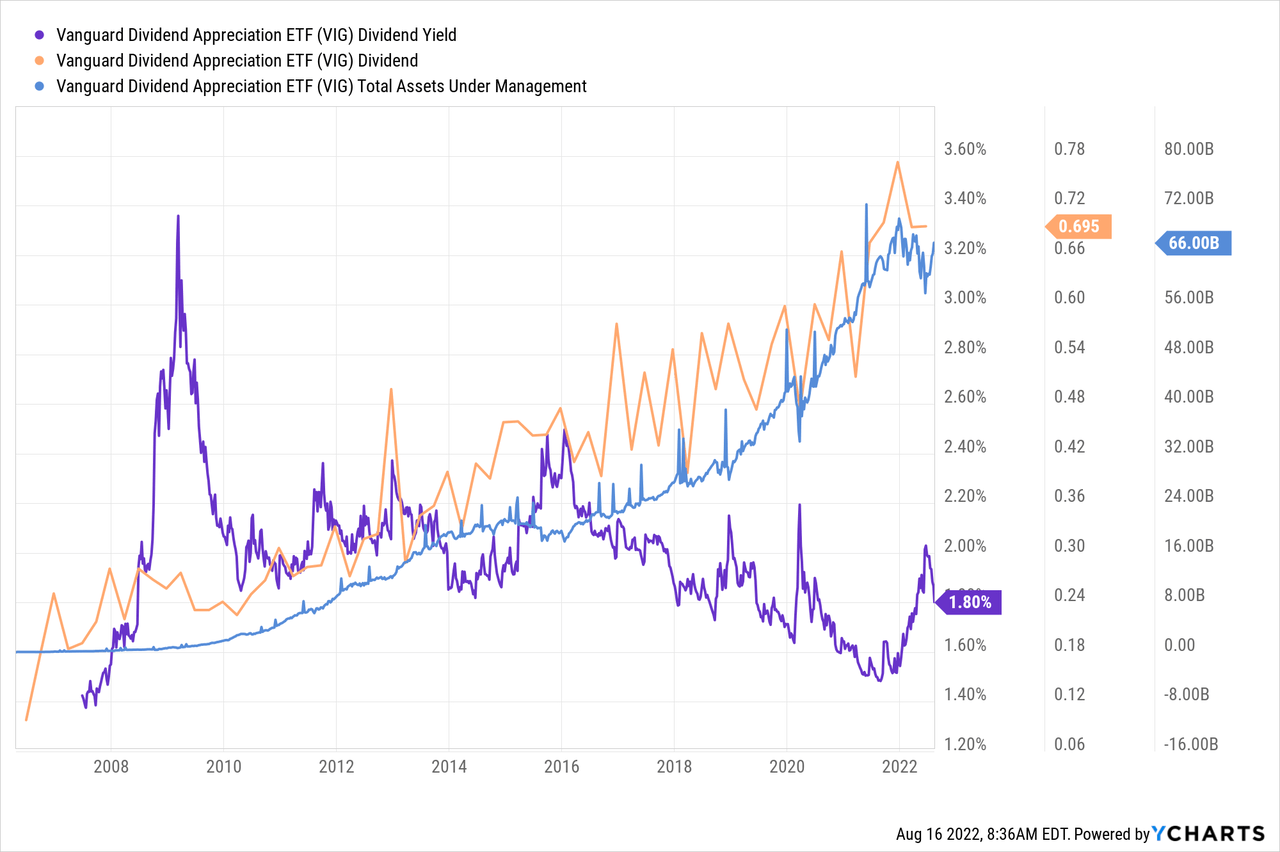
First, I wanted to support the above statistics on VIG’s dividend yield, dividend growth, and asset growth with the below chart of those three metrics, going back to the fund’s launch in 2006. Overall, this fund so far seems to have done a very good job of capturing dividend growth, and building up an asset portfolio worth $66 billion in the process, though as we’ve seen the very low yields in late 2007 and late 2021 might have been seen as a signal that prices were due for a pull back. My simple rule on dividend investments is to simply buy more when yields are high (as I recommended in March 2020), and take profits as yields fall.
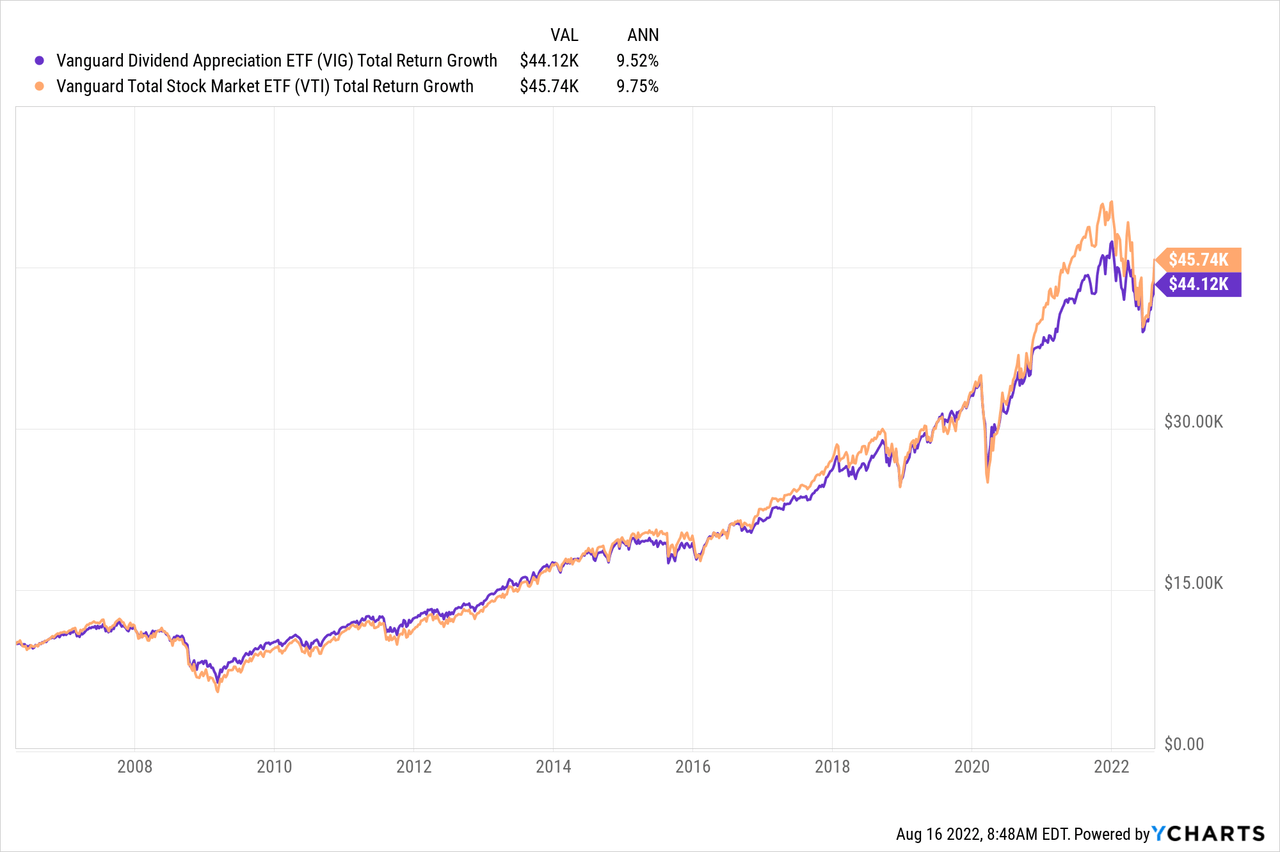
That said, since the fund launched in 2006, its absolute rate of return has averaged an impressive 9.5% per year, though as the below chart shows, this only came with minimally less market volatility than the Vanguard Total Stock Market ETF (VTI) and a slightly lower rate of return over that time.
Looking at VIG’s top holdings, it seems obvious why VIG’s returns tracked those of VTI’s so closely, and also why VIG is so low yielding: its top holdings are many of the largest holdings in VTI, and many of those highly weighted mega-cap names tend be low yielding. The highest yielding of these top 10 names is JPMorgan Chase & Co (JPM), which is one of the few bank stocks I own, since in general I find bank stocks have a relatively high risk of steep dividend cuts. For that reason, I’m also not too excited about VIG allocating almost 20% to financials, and imagine VIG’s yield would be even lower without those financials.
Seeking Alpha
Looking into VIG’s holdings, I was especially surprised to see the pattern in the below scatterplot: that there seemed to be no relationship between having a lower yield and a stronger history of dividend growth. In theory, we would expect stronger dividend growers to trade at lower yields, and weaker dividend growers to trade at higher yields. Although these dividend growth rates are backward-looking, there seem to be many names yielding over 3% with strong 10+ year dividend growth rates warranting a closer look.
Koyfin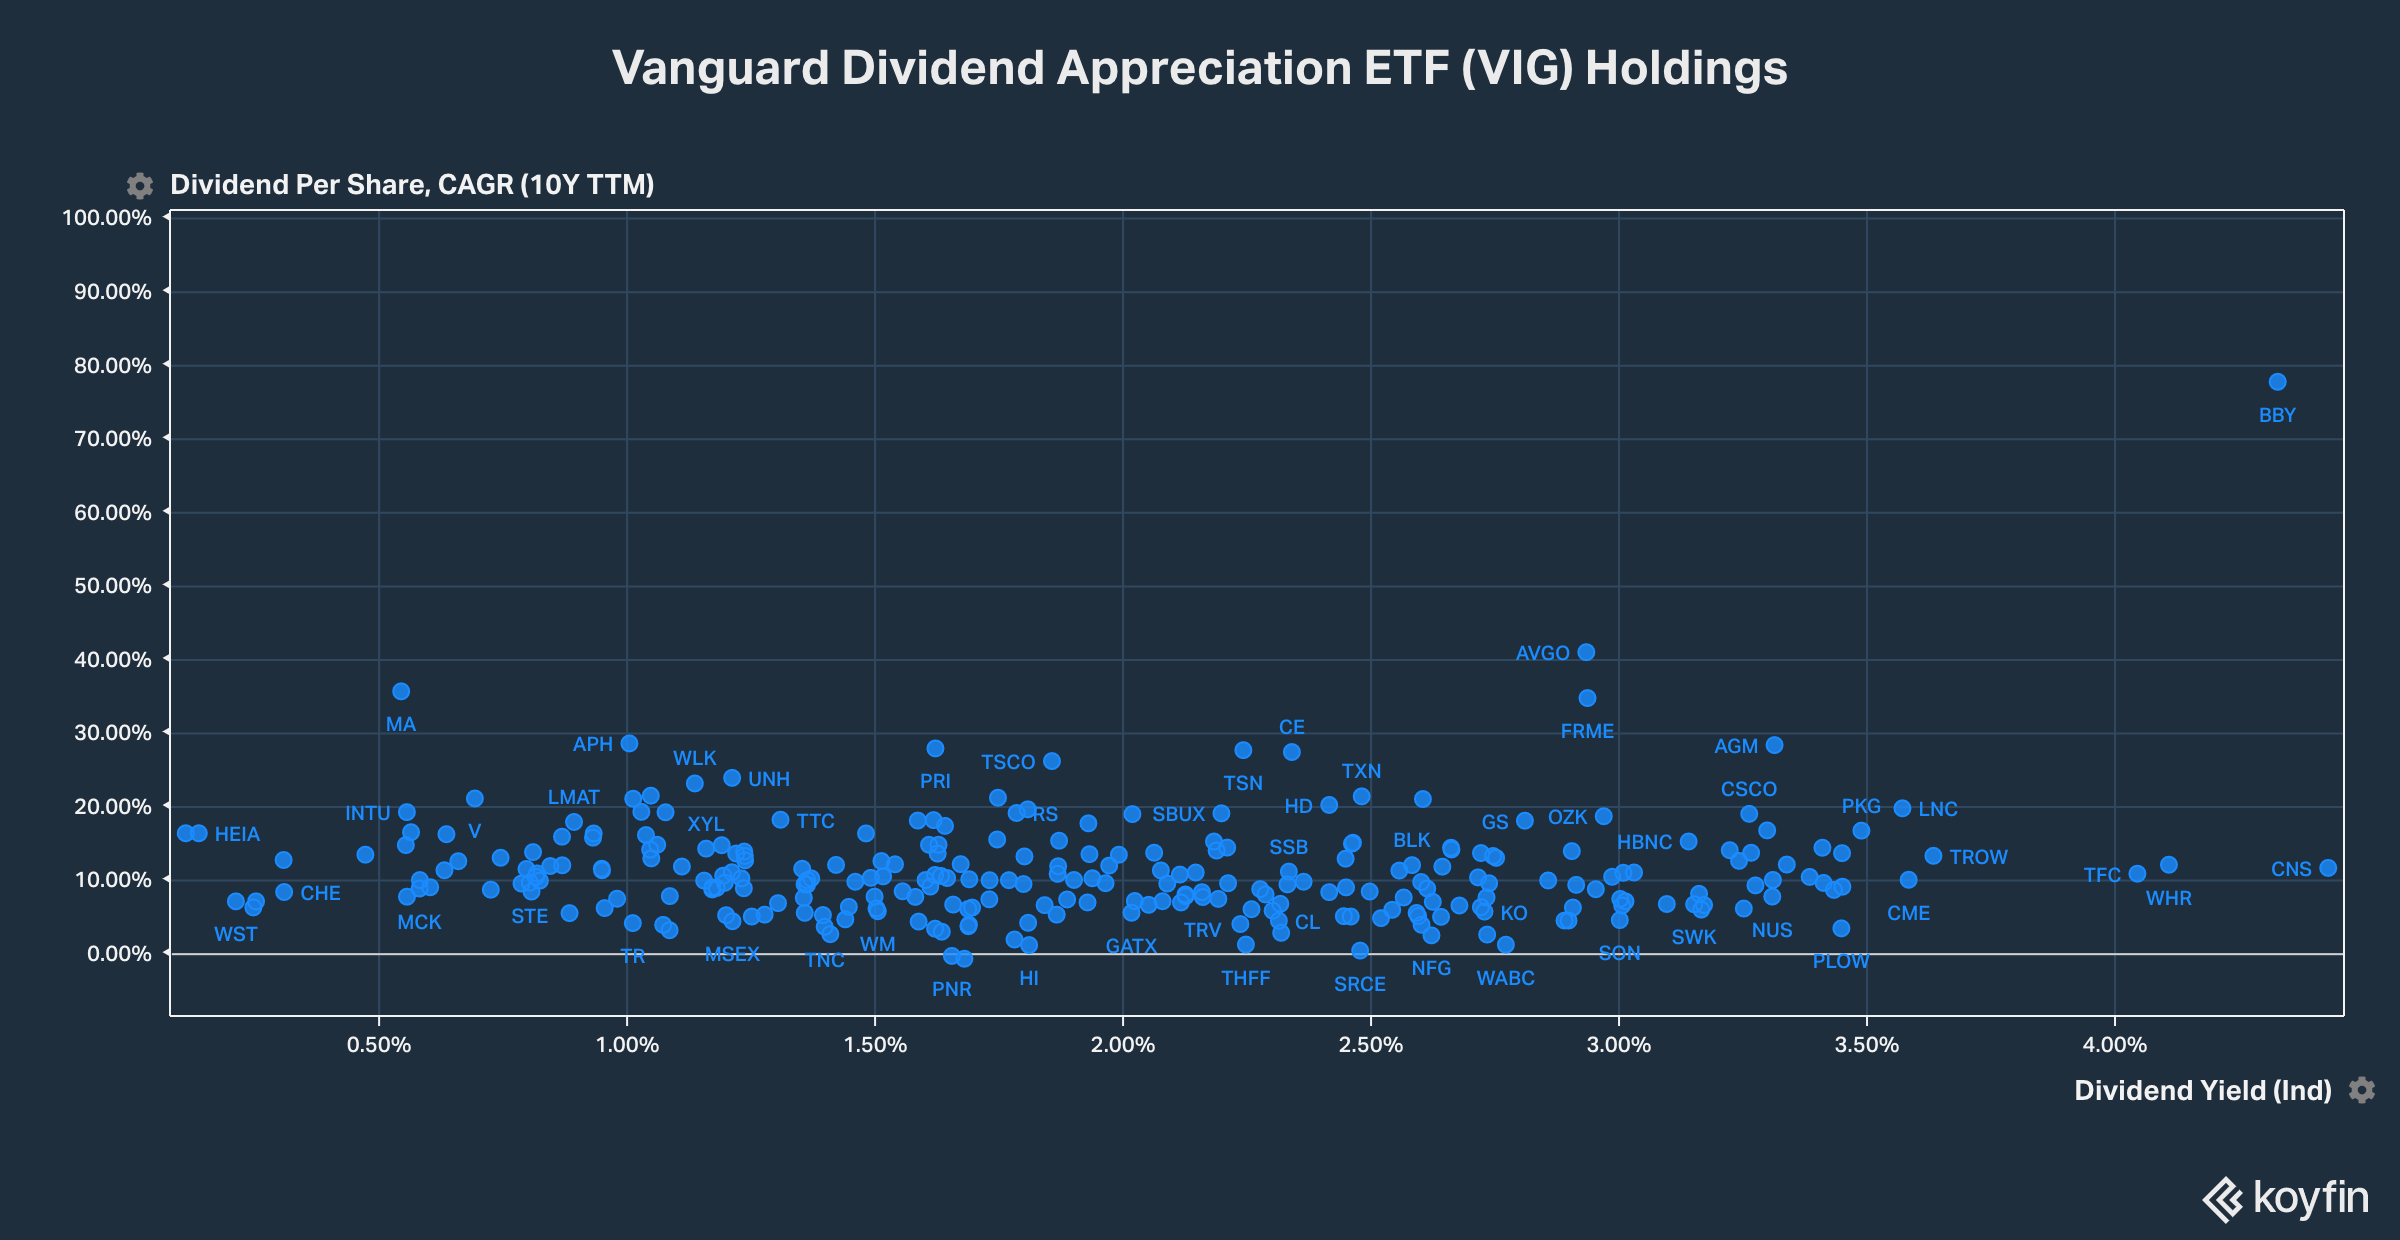
For the rest of this article, I will run through the 10 highest yielding of those names, excluding financials, to consider how a portfolio of those 10 names would compare to just buying VIG. For each stock, I will only do a very brief review with a chart of its dividend growth and yield, since I believe the portfolio view of these 10 is more valuable than a deep analysis of each at this point. I also title each section with the weight of that stock in VIG.
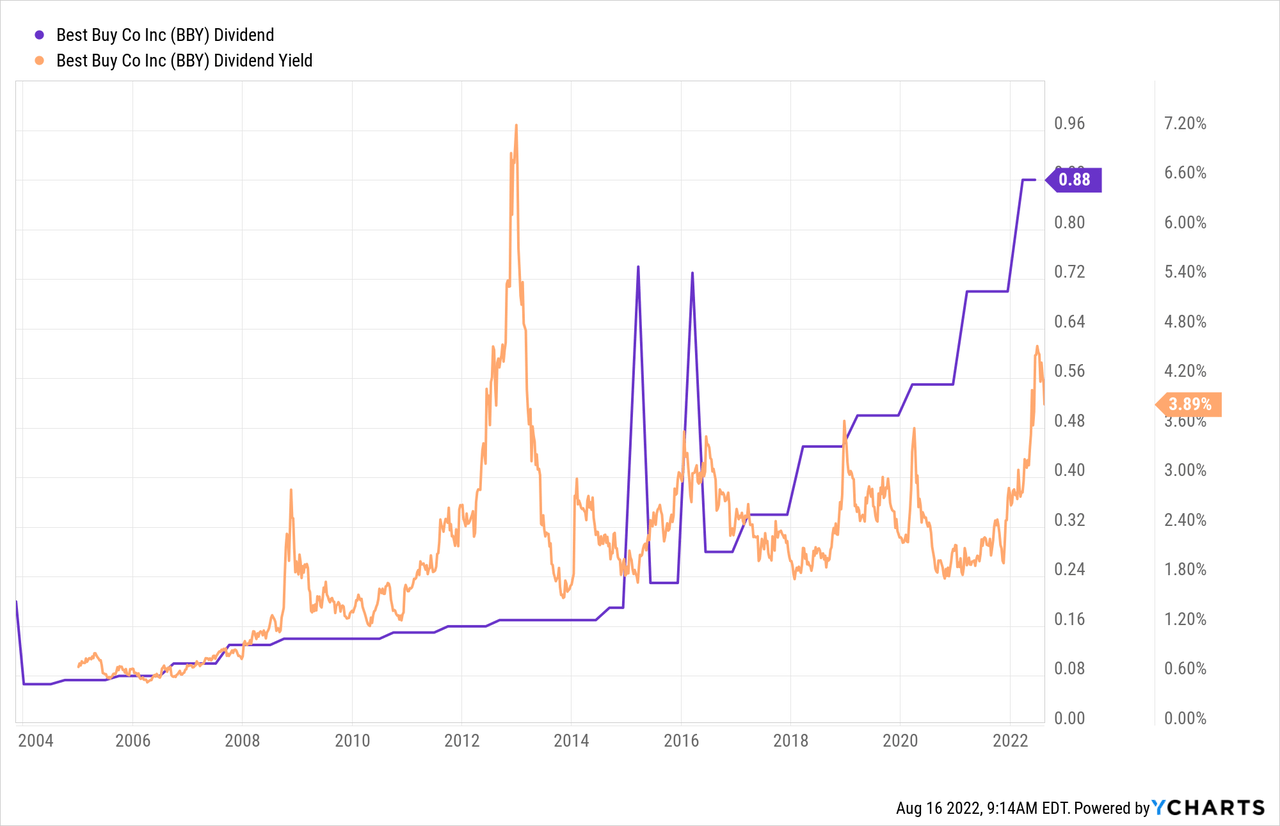
Stock #1: Best Buy, 0.13% of VIG
Retailer Best Buy Co., Inc. (BBY) is the outlier in the above chart, with an unsustainably high 10 year CAGR of dividend growth rate of over 70% per year. It now trades at its highest yield since 2013, which makes me want to learn more about why investors seemed more afraid of this name at the beginning and end of this most recent “retail apocalypse” decade than in the years between.
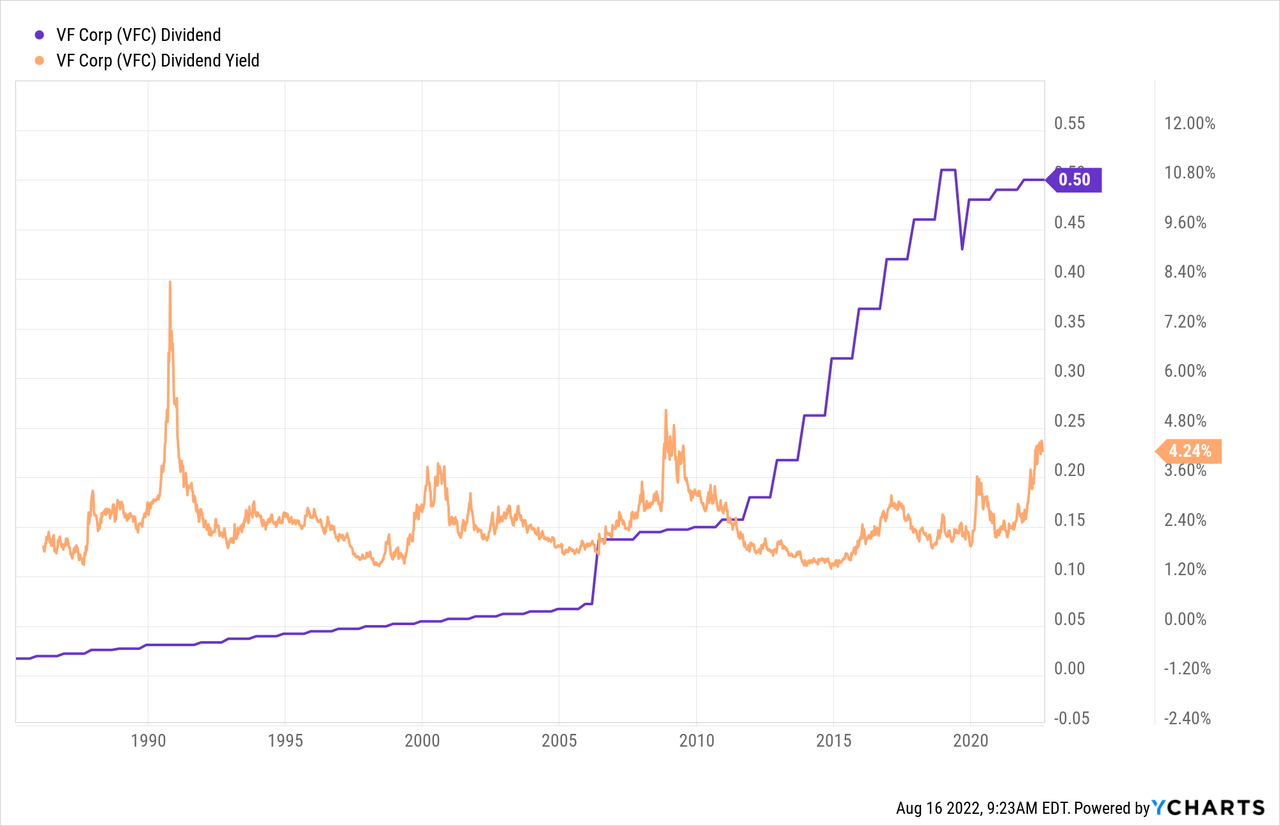
Stock #2: VF Corp, 0.12% of VIG
Clothing company V.F. Corporation (VFC) has a Seeking Alpha Dividend Consistency grade of “A+” as of this writing, and now trades at a >4% yield last seen in the 2008-2009 financial crisis. I would think that a portfolio of clothing brands that could be sold as well online as in stores would be less risky than a higher fixed-cost retailer like BBY, or at least think VFC provides some diversification against BBY’s “retail apocalypse” risk.
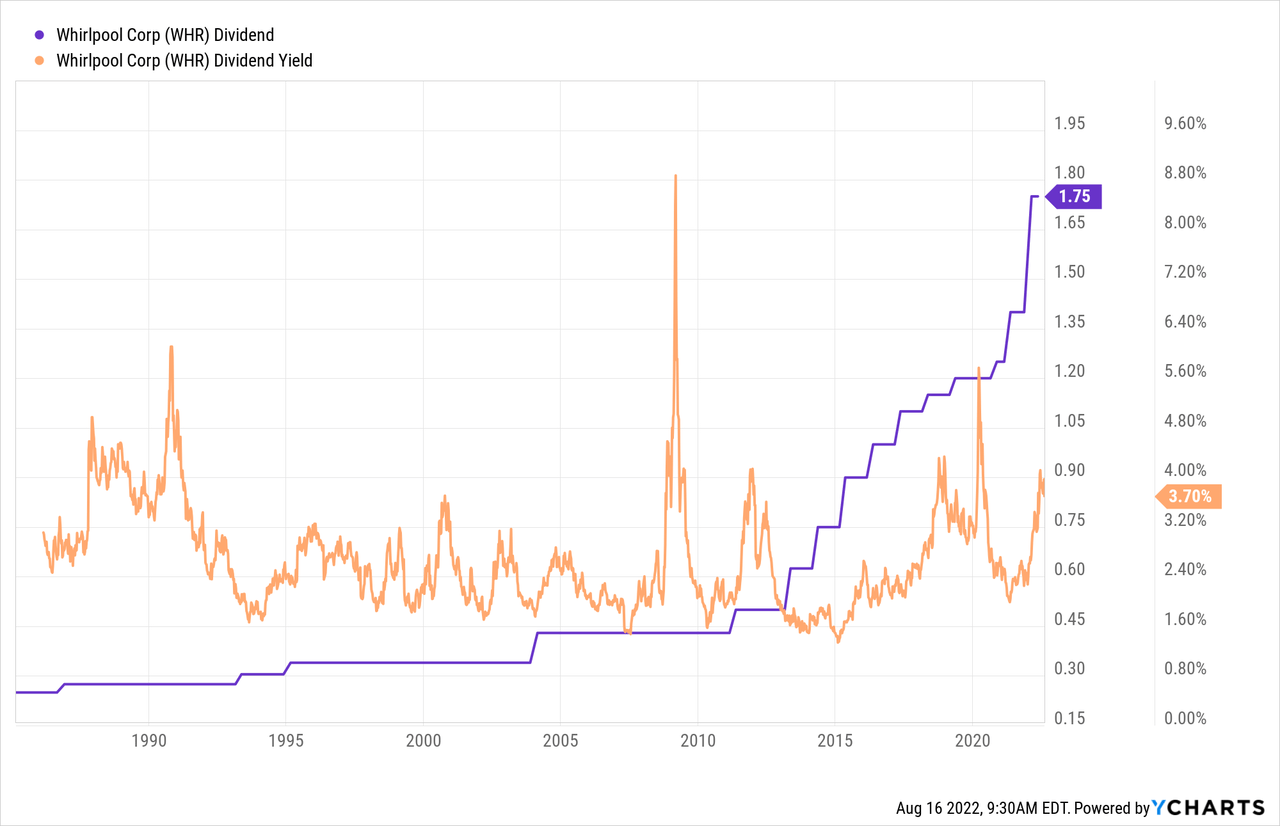
Stock #3: Whirlpool, 0.08% of VIG
Home appliance maker Whirlpool (WHR) has popped up on many of my stock screens over the past year, not least because it has very aggressively raised its quarterly dividend from $1.20 to $1.40 to $1.75 in 2020, 2021, and 2022. Members of Big Picture Growth & Income know I have a larger position in the even higher yielding Swedish appliance maker AB Electrolux (OTCPK:ELUXY), in part because I’m more familiar with the latter’s strong brand in Europe, but I also own WHR and would buy more at a >3.5% yield.
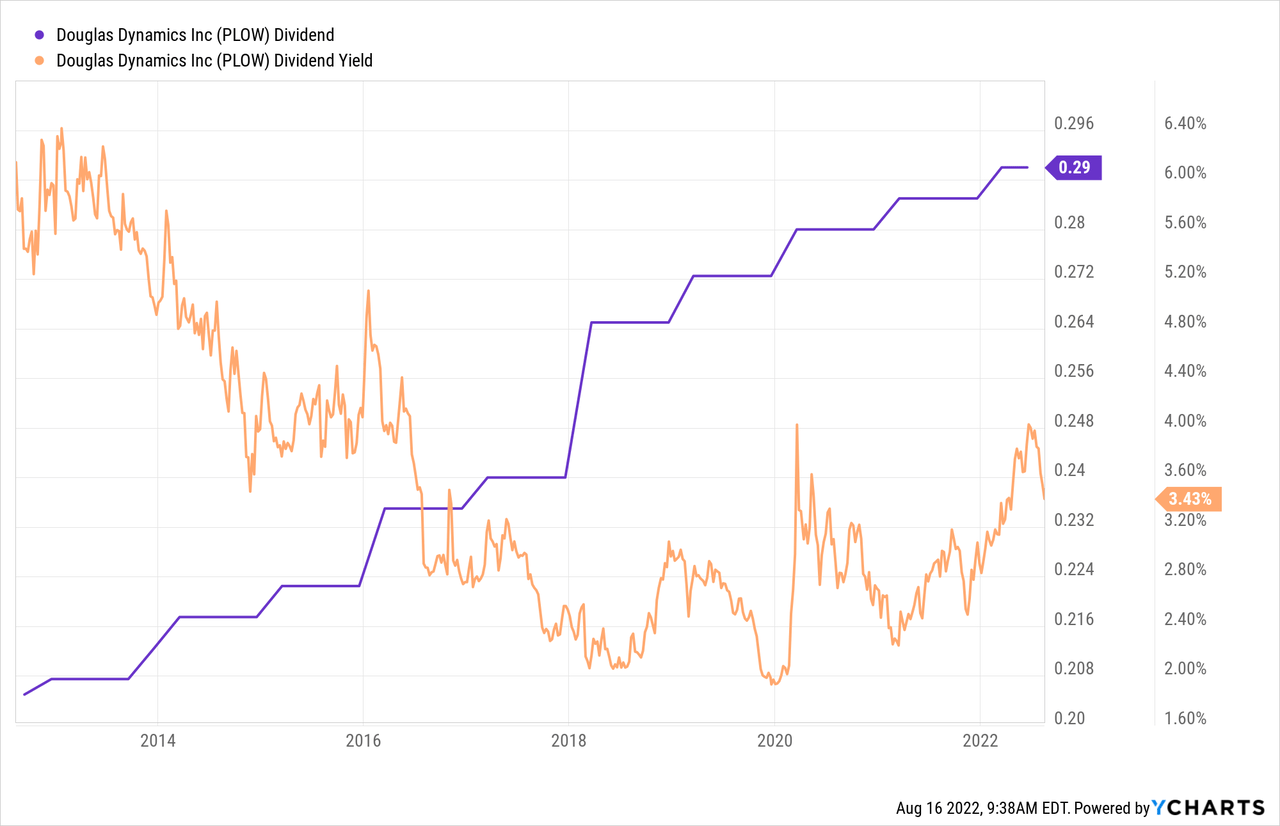
Stock #4: Douglas Dynamics, <0.01% of VIG
Douglas Dynamics (PLOW) is a stock I somehow never heard of before researching this article, even though I lived in Milwaukee for three years in the 1990s. This company has a market cap of $770 million, and so VIG has less than 0.01% of its assets in this company, but I think many dividend investors might be comfortable allocating 1% or more just on the chart below. PLOW makes truck attachments, and has been growing revenues steadily with relatively little debt, so I would add this microcap to a list of stocks worthy of a deeper look.
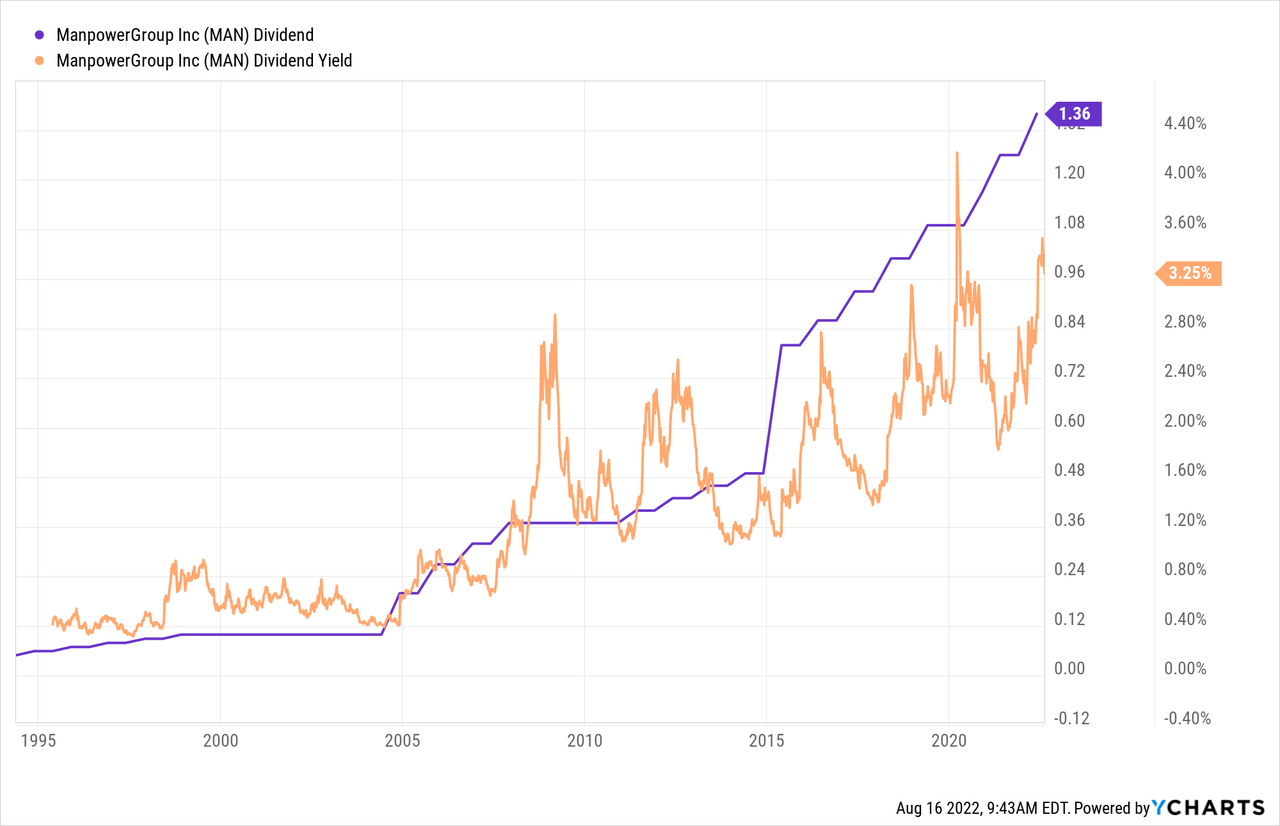
Stock #5: ManpowerGroup Inc., 0.03% of VIG
ManpowerGroup Inc. (MAN) is a name I’ve heard of, despite its relatively low weight in VIG, mostly because it is often named as an example of how American work culture has changed from the Silent Generation through Gen Z. While I am not an human resources expert, I know enough about the process of recruiting, hiring, and benefits management to expect that MAN’s business will probably not be so easily disrupted by sites like UpWork.com anytime soon, and this seems to show in MAN’s dividend growth. MAN currently trades at an almost all-time high yield (higher only during the March 2020 COVID crash), and we’d have to know more whether that higher yield is justified.
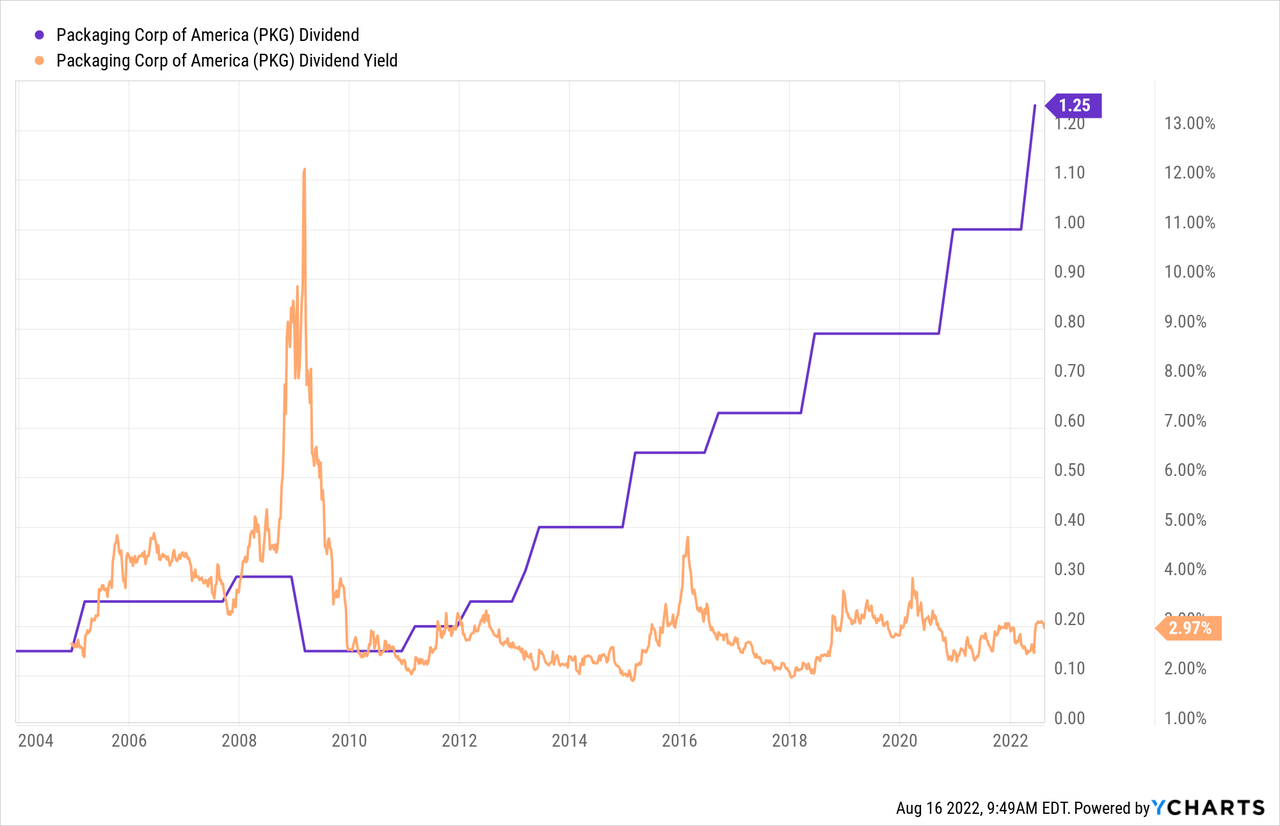
Stock #6: Packaging Corp of America, 0.11% of VIG
Packaging Corp. of America (PKG) popped up on my scatterplot above with a higher yield (3.49%) than in the chart below (2.97%), but the yield and growth are high enough to consider a weight much higher than 0.11% in a portfolio to replace VIG. The business of making cardboard boxes seems boring and safe enough if bought at a reasonable price, though of course it does seem commoditized, and I might worry that the recent growth seen with the post-COVID spike in demand for cardboard boxes is not sustainable.
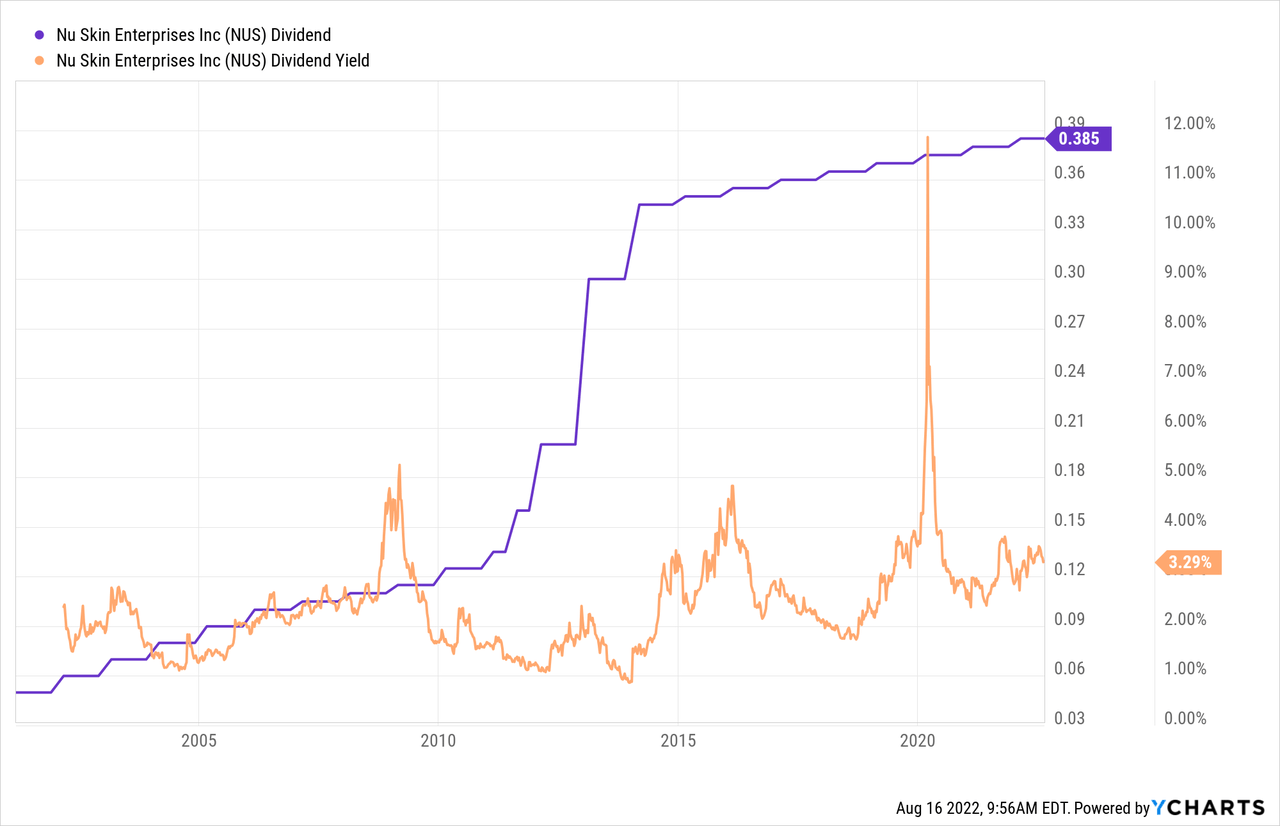
Stock #7: Nu Skin, 0.02% of VIG
The 7th highest yielding non-financial name in VIG is a stock whose business model I am not the only one critical of: Nu Skin Enterprises (NUS). NUS is a multi-level marketing (MLM) organisation, similar to Herbalife, which billionaire investor Bill Ackman lost almost $1 billion shorting, calling Herbalife’s MLM model a crooked pyramid scheme. I don’t know enough to accuse NUS of the same, and I definitely wouldn’t short it. If I did want a financial reason to excuse myself from buying NUS based off today’s screen, I’d point out that it is in what I call the “dubious club” of stocks that now only raise their quarterly dividend by one penny or less per year.
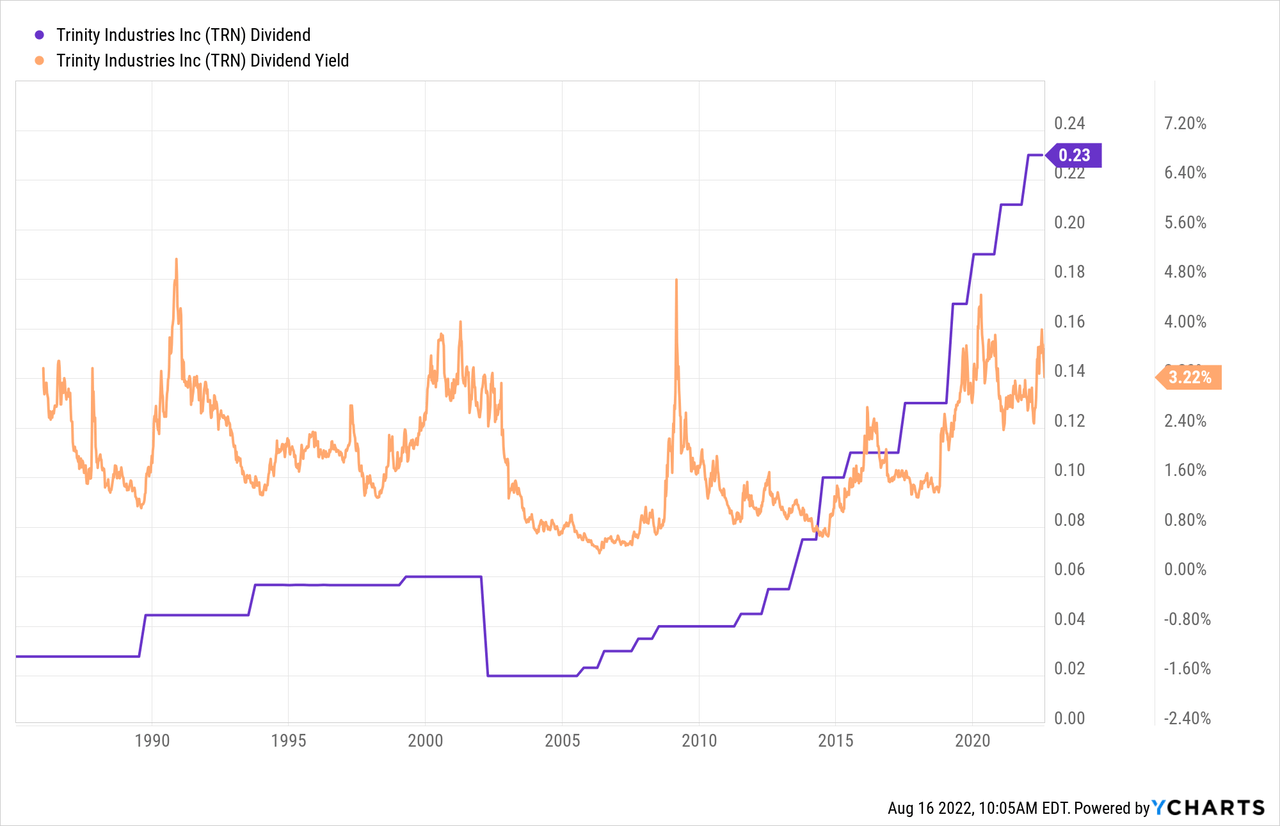
Stock #8: Trinity Industries, 0.01% of VIG
Eighth on today’s list is rail car lease operator Trinity Industries (TRN). Ordinarily, I would consider leasing businesses to be financials, and so would have not included it in this list, but for now, I will keep it as I’m not the one making sector and industry classifications. The financial nature of leasing worries me with TRN’s current levels of debt, and makes me wonder if that is why we saw a 50% dividend cut in the early 2000s, but for now, this seems like an acceptable dividend grower with an attractive yield.
[object HTMLElement]
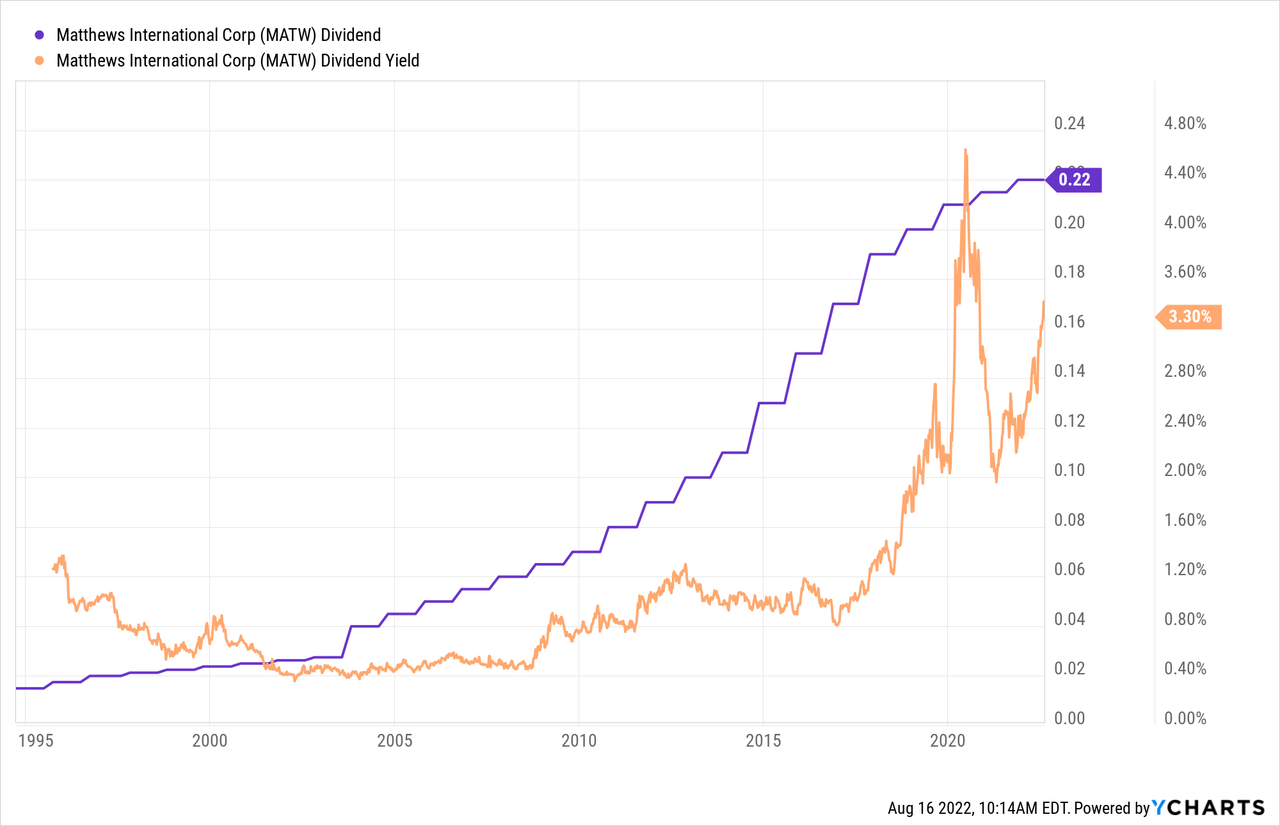
Stock #9: Matthews International, <0.01% of VIG
Matthews International (MATW) has interesting portfolio of businesses ranging from manufacturing and marketing to cemetery products. It’s probably very easy to argue that this $820 million micro-cap is quite well diversified away from the risks affecting the eight other names reviewed so far.
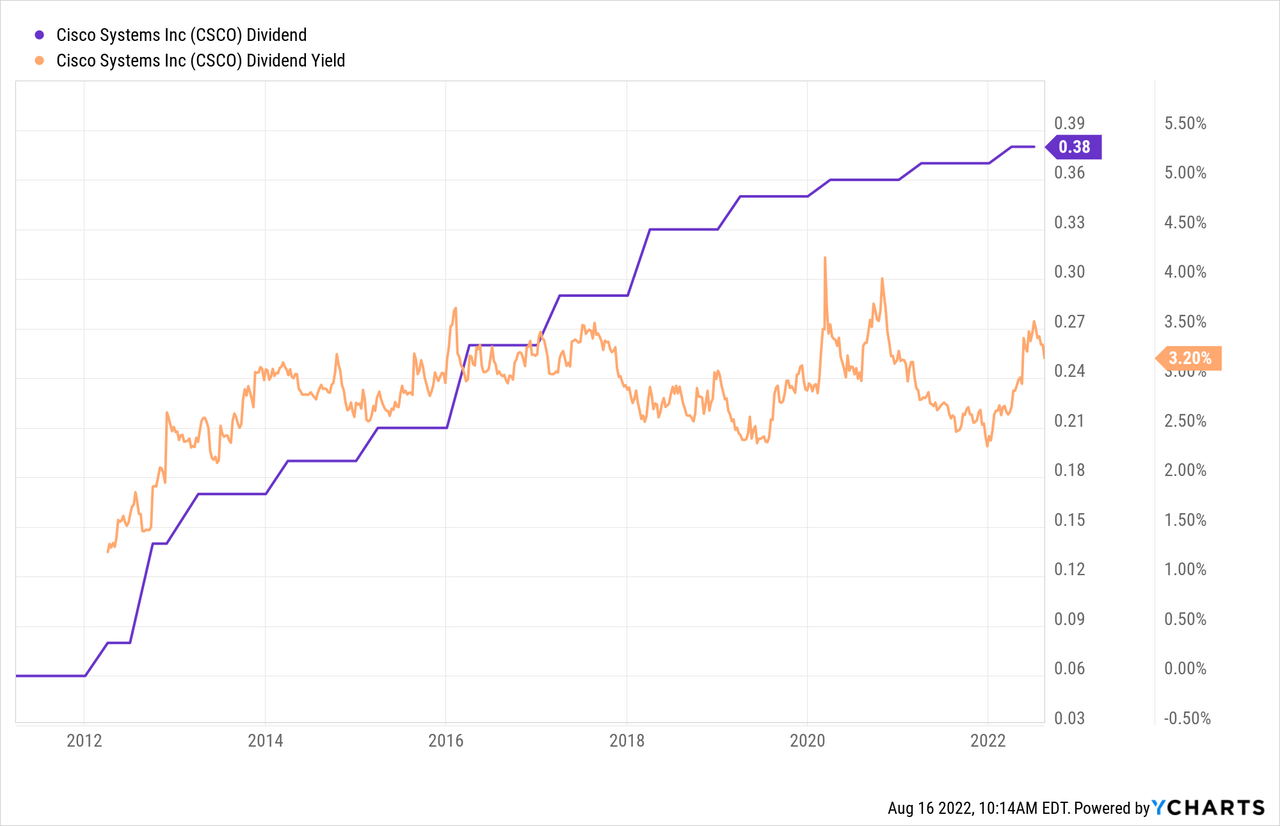
Stock #10: Cisco Systems, 1.54% of VIG
Finally, I find it a good finale to see that the 10th highest yielding non-financial holding of VIG just happens to be the most likely name most readers of this article will have already heard about: computer networking giant Cisco Systems Inc (CSCO). CSCO is not only the only one of the top 10 yielders to make up over 1.5% of VIG, it is the only one making up over 0.15% of VIG, so CSCO’s contribution to VIG is more than the other nine combined. At this point, I don’t think I need to say anything about what CSCO does, but rather point out why CSCO’s weight is a great example of why I prefer to own stocks directly rather than through funds like VIG: an equally weighted portfolio of the above 9 stocks very clearly (at least to me) provides a better diversified balance of dividend growth and risk than putting all of the same amount in CSCO.
Conclusion
This portfolio of 10 of VIG’s highest yielding non-financial holdings took me only a few minutes to put together, has almost double VIG’s dividend yield if equal weighted, and in some ways looks like a better balanced portfolio than VIG. Together, these 10 names make up only around 2% of VIG, and 3/4 of that 2% is in CSCO, which as mentioned, seems riskier to me than equal weighting.
| HOLDINGS | TICKER | % OF VTI | SECTOR | Div Yield |
| Best Buy Co. Inc. | BBY | 0.13% | Computer & Electronics Retail | 3.9 |
| VF Corp. | VFC | 0.12% | Apparel, Accessories & Luxury Goods | 4.2 |
| Whirlpool Corp. | WHR | 0.08% | Household Appliances | 3.7 |
| Douglas Dynamics Inc. | PLOW | <0.01% | Construction Machinery & Heavy Trucks | 3.4 |
| ManpowerGroup Inc. | MAN | 0.03% | Human Resource & Employment Services | 3.3 |
| Packaging Corp. of America | PKG | 0.11% | Paper Packaging | 3.0 |
| Nu Skin Enterprises Inc. | NUS | 0.02% | Personal Products | 3.3 |
| Trinity Industries Inc. | TRN | 0.01% | Construction Machinery & Heavy Trucks | 3.2 |
| Matthews International Corp. | MATW | <0.01% | Diversified Support Services | 3.3 |
| Cisco Systems Inc./Delaware | CSCO | 1.54% | Communications Equipment | 3.2 |
Source: Vanguard, YCharts
Now that many US brokers offer commission-free trading, I see little advantage to buying your dividend growth stocks in a single bundle like VIG, and rather see greater advantages in holding fewer names directly, where you can more closely watch which ones are raising and which are cutting their dividends. Being able to filter down to the higher yielding names, as done above, is a further plus. And, of course, how far you want to go depends on how many more minutes than the few I spent you want to invest in constructing your dividend portfolio.
Be the first to comment