

Edwin Tan /E+ via Getty Images
Vermilion Energy (VET) is primed for a huge 2022. Partially in thanks to their recent acquisition in the Corrib gas project. The company is going to set a revenue record in 2022, the only question the remains is how big of a record will it be. Vermilion is working hard at deleveraging the balance sheet and is going to start paying out a dividend once again in April of this year. That dividend will continue to grow as FFO does over the next few years. If you are looking for a horse in this energy boom, Vermilion is a great choice as it makes its way to $20.
What’s Driving The Company?
In short, it’s cash flow. I’ll touch on the FFO aspect when I talk about the dividend below, so let’s look at what is bringing in the cash. To start, we can thank commodity prices. For every $1 increase in oil that we see, Vermilion takes home an extra $16 million in FFO. For every $1/mmbtu in EU natural gas the company sees a $39 million change in FFO. There’s a lot of risk there, but when you are as bullish on commodities as a lot of these companies are, it’s hard to not follow suit. Looking below, we can see the breakdown in exposure and where the money is actually coming from.
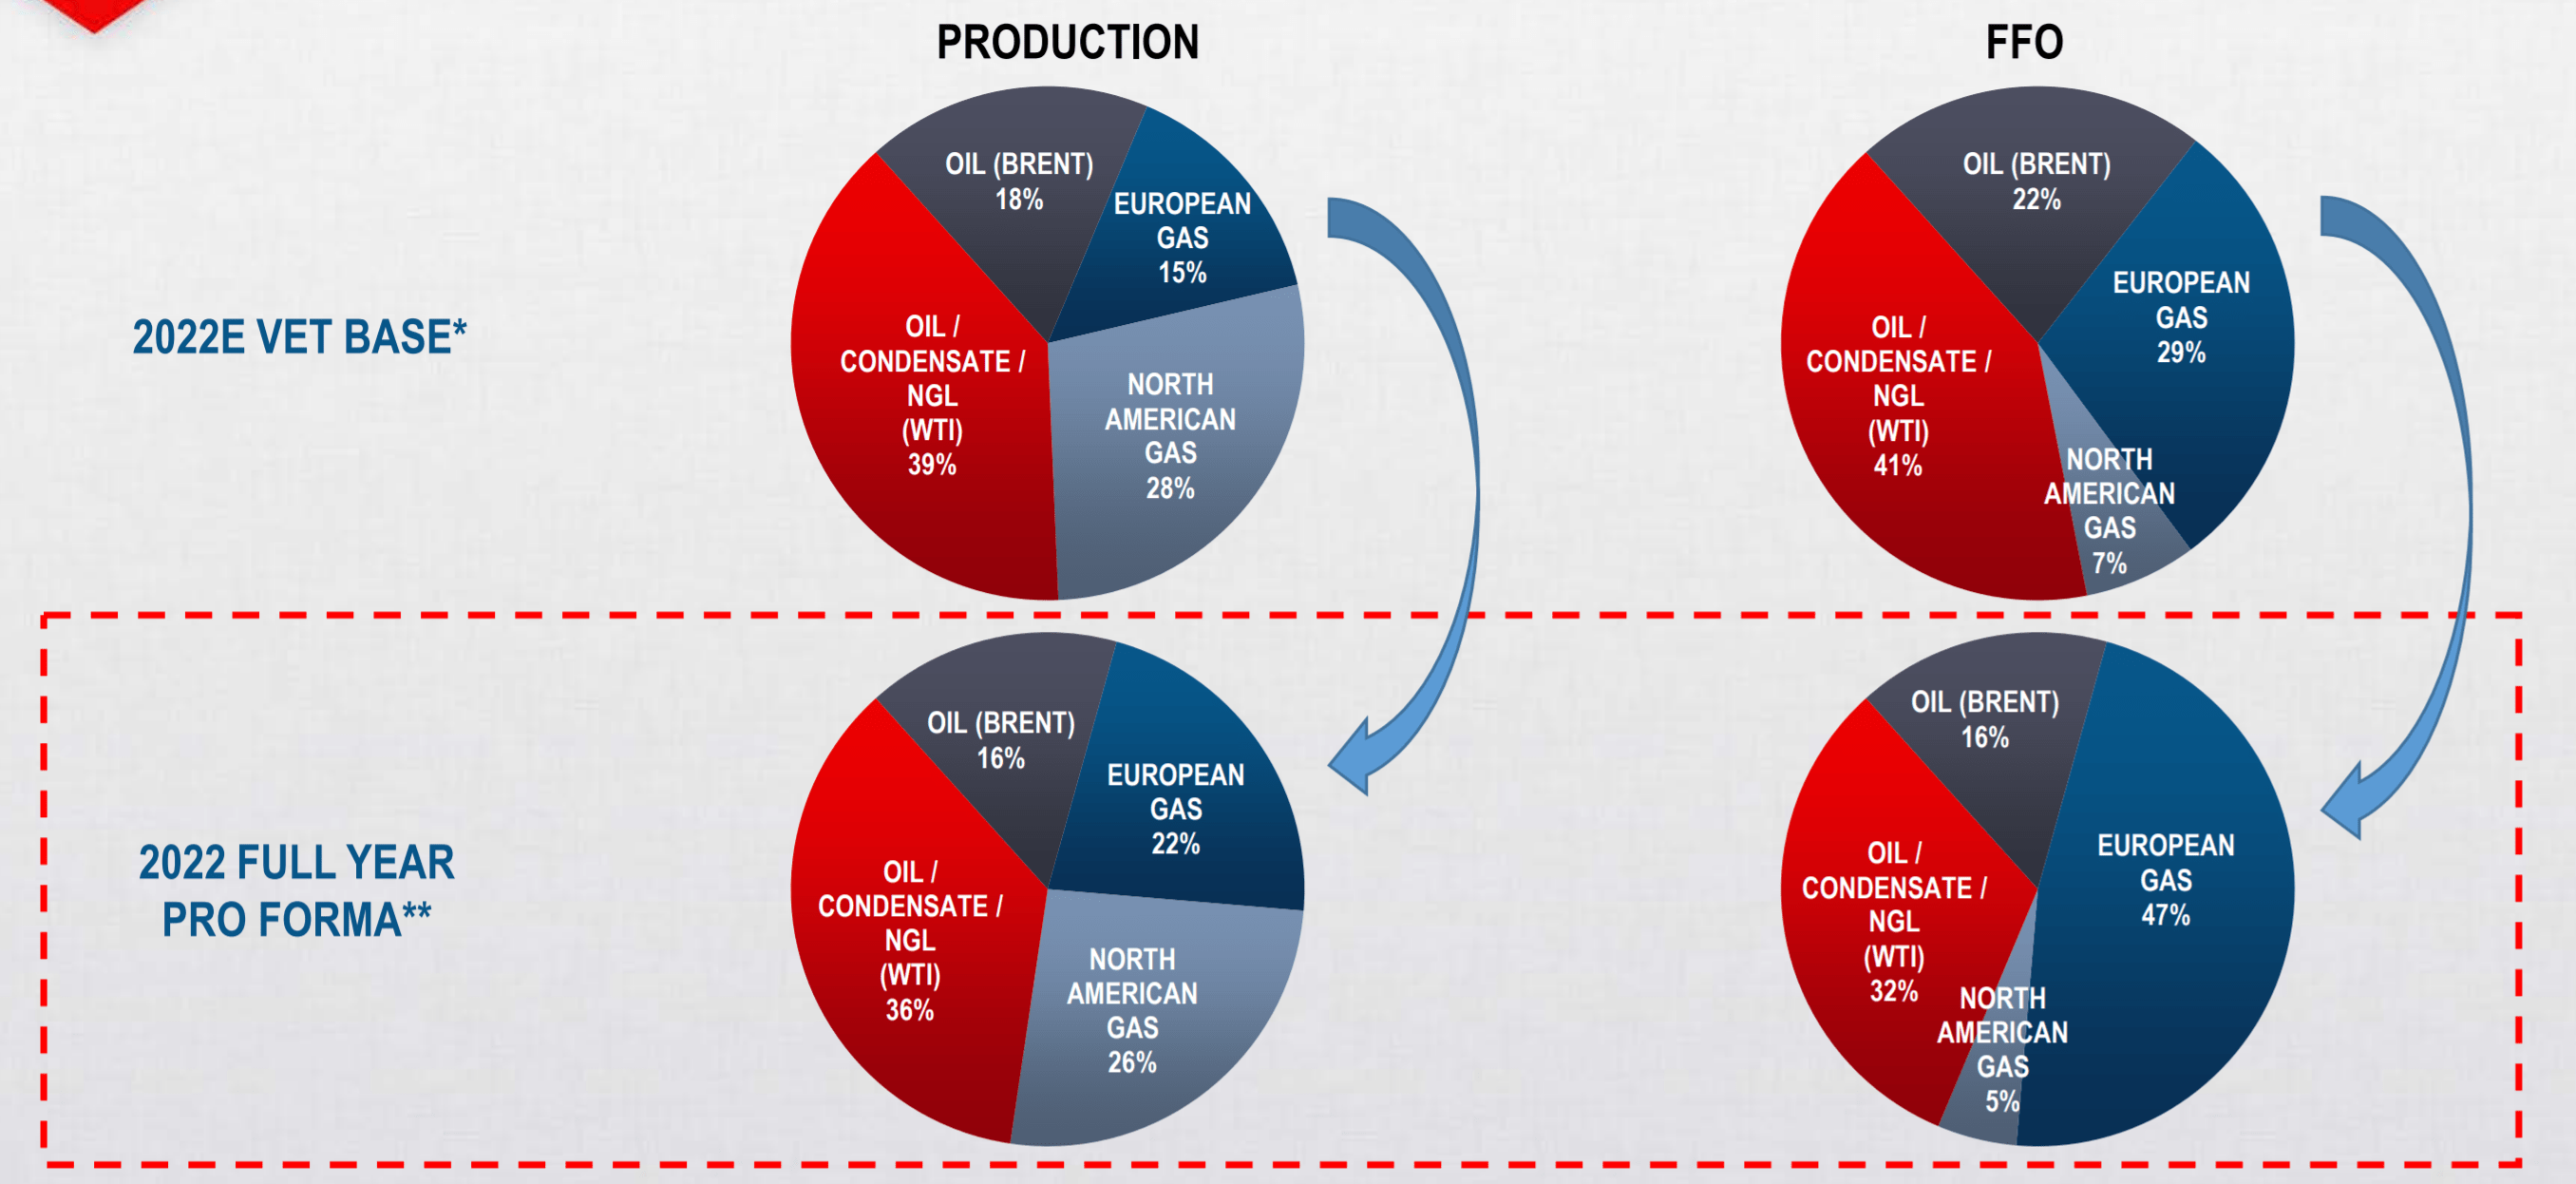
So why is there so much money to be made on EU natural gas? Well, it’s a big question with a lot of variables. Simply put, supply and demand. There are currently low domestic storage levels, and there’s some pretty cold weather forecasted. Tie that in with declining EU domestic production (Groningen field will cease production in October 2022, Mature North Sea production is in decline), and an increase in demand from the power sector due to the phasing out of coal, and boom, you have a bit of an energy crisis. As a human being, it’s not a great thing to see happening, but as a shareholder it’s great. And I haven’t even mentioned the potential of Russian implications. It’s quite messy over there right now, and it’s all generally bullish for natural gas prices.
This is why the recent acquisition of a 36.5% equity position in the Corrib gas project in Ireland for $434 million from Equinor (EQNR), which now gives them an operating interest in Corrib of 56.5%. This increases exposure to EU natural gas, which is why we see FFO from EU natural gas increase from 29% to 47% thanks to this acquisition. Based on forward commodity prices, Vermilion forecasts Corrib will generate $440 million of FFO and $430 million of free cash flow in 2022. This asset will pay for itself in a hurry. However, there will be a hedge on roughly 70% of the production for 2022/23, which ensures everything is paid back in a two-year window. After the payout, there will still be 75% of reserves left. There is lots of money to be made on this purchase.
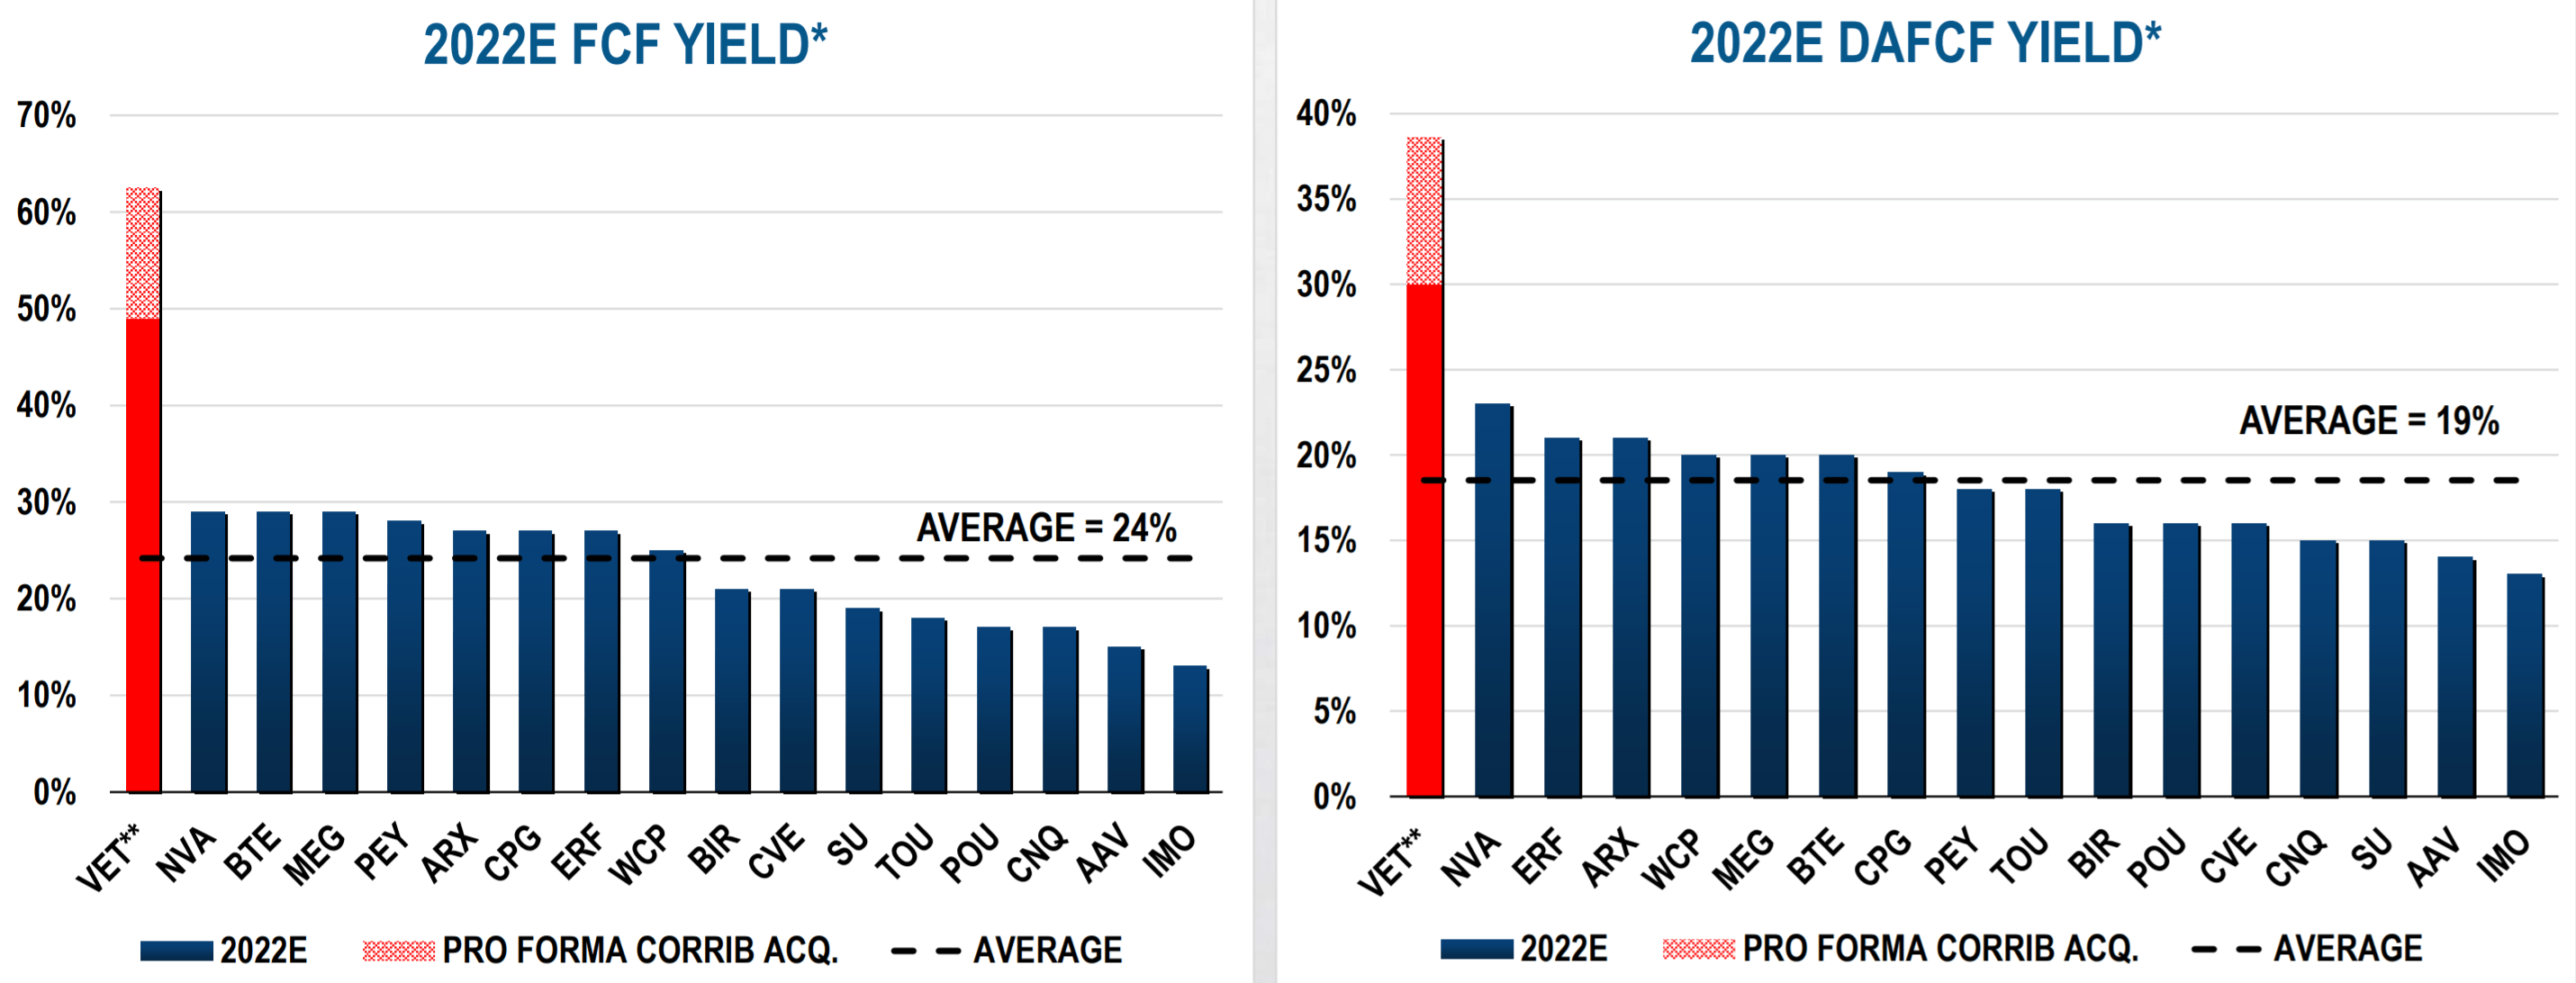
Looking above we can see just how big the potential is. They trade at one of the highest FCF yields in the industry at well over 40% and you can get that kind of yield for relatively cheap. If they pull in the expected $1.33 billion in FCF this year, that’s worth over $8.00 per share alone.
There is a lot of commodity price risk here, but if you are bullish on them, it’s hard to not like what Vermilion has to offer.
How’s The Dividend?
It’s coming back!! How big exactly is still to be determined. The company said that it would be 5-10% of FFO stress-tested at lower prices including $55 WTI, $2.50/MMBtu AECO, and $8.00/MMBtu European Gas. They then came out and said to expect a $0.06 per share dividend taking form in April and paid out quarterly from there. This works out to $0.24 annually. This works out closer to the 5% based on the originally budgeted $1.45 billion FFO. Since then, we have seen the company come out with a new target of $1.76 billion in FFO. The does mean we could see a bigger payday announced in March, but it’s too soon to tell at this point if they will indeed go that route or not. The important thing is it is indeed back, and we can expect annual growth if commodity prices cooperate.
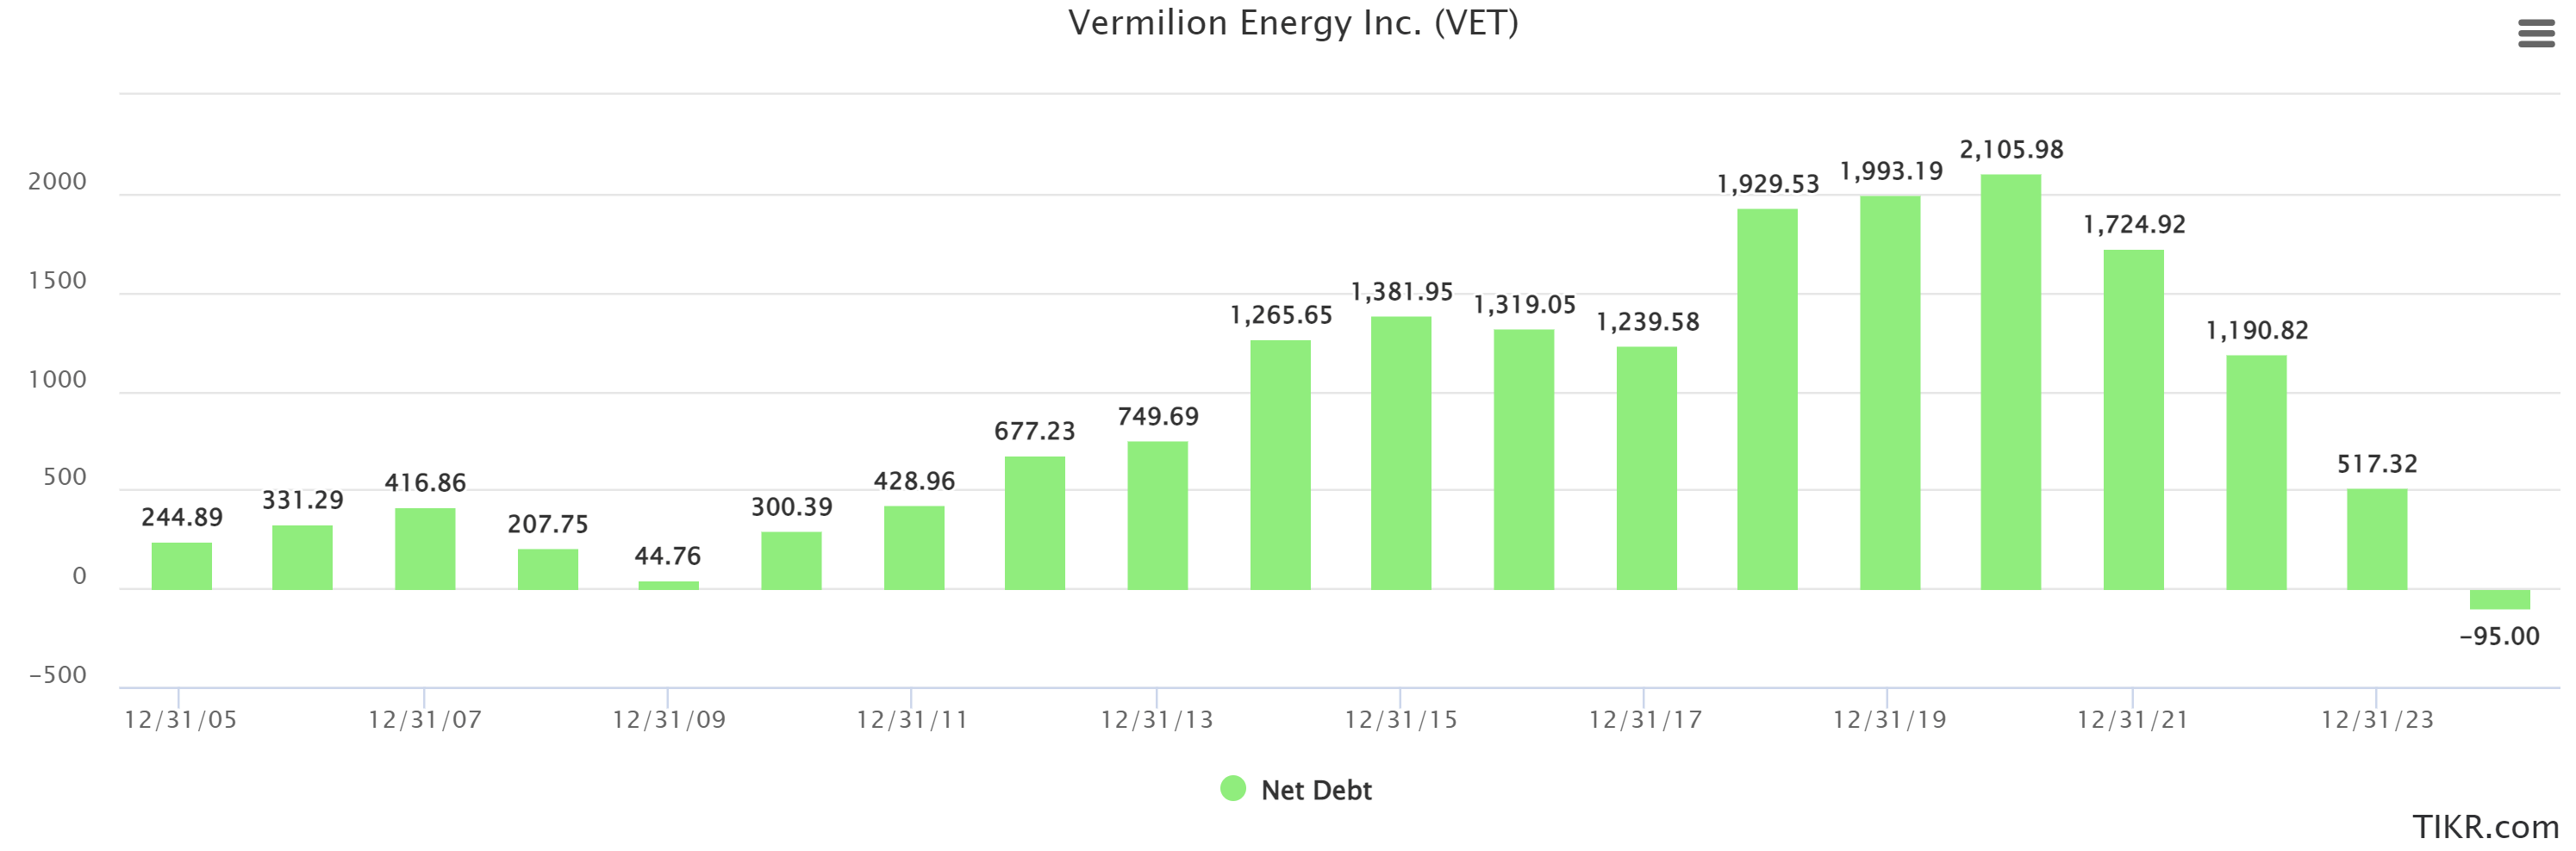
One of the knocks on Vermilion over recent years has been the debt. The above chart shows that essentially melting off over the next few years. A good chunk of this is due to the dividend being cut and slowly restored. The number one focus is still to reduce debt and fund the recent acquisition, which is exactly where the focus should be. The company peaked in 2020 with a leverage ratio over 5x, and it’s expected we see that fall below 1x by year-end 2022. If we see the strong oil & gas market I suspect we do in 2022 and beyond, Vermilion will have tons of cash to look at continuing to acquire assets, as well as return cash to shareholders in the form of dividend increases, special dividends, and share buybacks. It’s a good time to be a Vermilion shareholder as the light is finally starting to shine at the end of what’s been a very long tunnel for some.
What Does The Price Say?
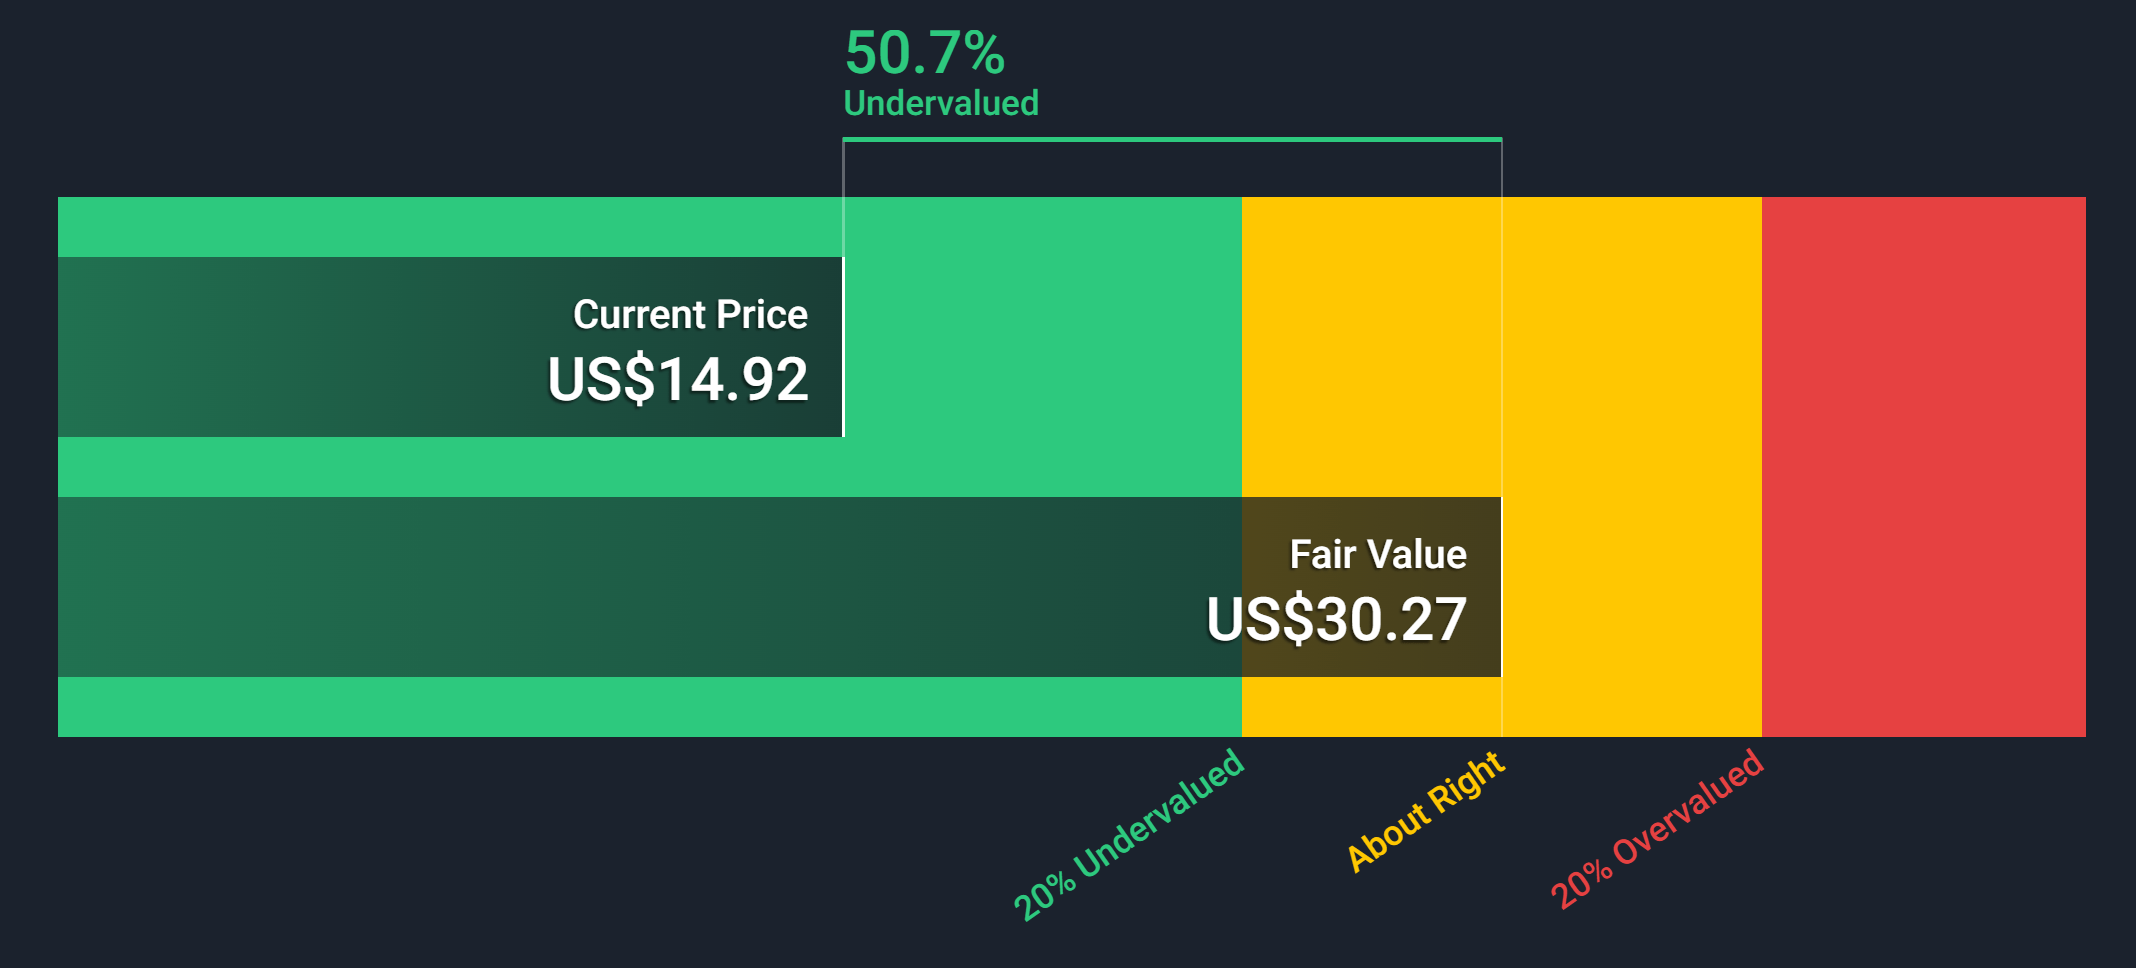
What a wild week two weeks it has been! A lot has changed, including Vermilion being up about 20%. Back when I wrote on Vermilion in early November, the stock was sitting around $11 and my target was $13.66. Well, we have blown through that headed for $20. Looking below, we can see the stock is still poised for a potential double from here. I’m not sure we see that much movement in 2022, but I’ve been wrong before. I do think we could see some short-term weakness in the near future, but overall I think the road to $20 is paved, we just need some further confirmation from energy prices.
Let me start with the 50-day moving average. In previous articles, I have talked about how it has been a good point of general support and trend. We have seen a few more touches and a really big point of turbulence in November that caused what appears to be panic selling. The important part here is that the stock rebounded very strongly, and we then have a positive re-test in mid-December. The cause for concern is the current distance between the price and the moving average. We are currently 20% away from the moving average. One of three things will happen in the short term:
1. The stock will continue to blast, and eventually crash hard.
2. The stock will trade sideways and allow the moving average time to catch up.
3. The stock will slowly dip back while the moving average rises, kind of like we saw in March of 2019.

So what levels do we need to watch for from here? I’ve got three key ones. The big one is $20. Being my current target price, there really isn’t a ton of resistance from current levels. Maybe a little bit between $16-17 but generally the physiological resistance will be at $20 and that plays to both sides of the trade. In terms of potential dips, $14 is an important one to watch. We have not had a positive backtest here, and this was the support that gave way back in March of 2020. A break of $14, sends us back to $11.50. I think we will land somewhere between $14 and $11.50 on the next pullback. $11.50 is where my hard stop would be. Lots of support there and it was hard to break through.

In short, I do think the party goes on as it could be a big year for oil & gas stocks, but I do think the last two weeks have been a little too good. If you’re looking to get in, buy on dips. Keep some cash to the side. No need to chase here in my opinion.
Wrap-Up
As you can see, Vermilion has a lot to offer shareholders over the next few years. Even though the stock might be a little overbought at current levels, there is definitely an upside to come here. The stock will get to $20, the question is just when. The good news is we will get paid to wait very shortly as well. Even though it’s not a ton, it’s a start and I have a feeling it will grow very quickly if we get the energy environment I am hoping for. If you’re looking for an entry, be patient here. If you’re already long, it’s always ok to take some money off the table and add at potentially lower levels. Taking profits never hurts! Stay safe out there.
Be the first to comment