

Spencer Platt
Verizon Communications Inc. (NYSE:VZ) will report its Q4 results two weeks from now, on the morning of January 24, 2023. I recognize that a few prospective investors may be looking to take a position in the stock ahead of an important event; here are some notable factors to consider.
Verizon’s Earnings Track Record
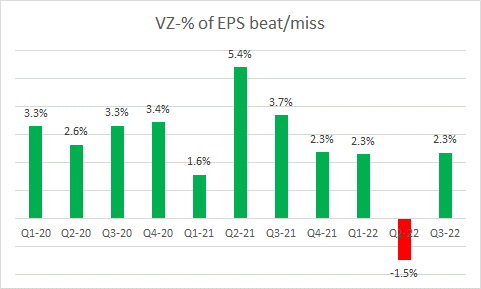
In the recent past, Verizon’s track record of beating street estimates has been decent enough. For instance, if you look at the performance over the last three years (from Q1-2020), there’s only ever been one instance (Q2-2022), where VZ failed to meet street estimates on the bottom line, missing the mark by -1.5%. Otherwise, you’re looking at a stock that typically delivers positive earnings beats to the tune of +2.6% on average.
Seeking Alpha
Q4 Results- What To Expect?
- On the topline front, latest consensus points to a Q4 revenue figure of $35.3bn; this would imply some slowdown to the 3.5% levels from levels of 4% seen in Q4. Do note that over the last three months, 12 sell-side analysts have revised their revenue estimates for Q4, and 58% of those revisions have been to the downside. On the adjusted EBITDA front, management had stated that they would likely deliver anything from flattish growth to a -1.5% decline for FY22. The Q4 consensus number at the EBITDA line already currently stands at $11.88bn, which would imply positive growth of almost 1% in Q4; this would of course be an improvement from the -0.4% decline seen in Q3.
- In Q3, the YoY run rate of wireless service revenue growth was quite impressive, almost hitting the 10% mark (in Q1, and Q2 it came in at 9.6% and 8.9% respectively). In Q4, investors would be advised to not expect an improvement on that run rate although there will likely be some lingering benefits from pricing increases made earlier in the year (in Q3 this impact was + $494m). Regardless management guidance was to deliver FY wireless service revenue growth of 8.5-9.5%. Even if you take the high end of that range, and extrapolate last year’s aggregate wireless service revenue ($68.5bn) that would translate to around $75bn of sales for FY22 or $19.5bn for Q4. This would mean a slowdown in the YoY run rate to 9.6%.
- A lot of focus will be centered around VZ’s net additions of wireless retail postpaid subscribers. Over the last two quarters, they’ve only been able to add around 10k subscribers on average per quarter, well below what some of its largest competitors have been adding.
- In recent quarters, VZ implemented pricing increases on some metered plans whilst also raising its admin fees. This has understandably triggered a spike in the level of churn which had hit levels of 0.92% in Q3. Since the pricing increases were not one-offs but implemented in a phased manner, investors would do well to expect churn levels to remain elevated in Q4 as well.
- VZ has been making a concerted effort to get more customers linked to its premium tier plans. Whilst this hit an impressive 42% in Q3 and was also instrumental in boosting consumer-related postpaid ARPA by ~4% in Q3, it is questionable if the strong penetration levels will be sustainable given the recessionary backdrop.
- The impetus towards C-Band spectrum (frequencies of 3.7 GHz and 3.98 GHz) which provides a fine balance between coverage and performance is a key part of Verizon’s 5G ambitions. As of 9M-22 the company had covered 160m of C-band POPs and this will likely hit 175m by Q4 (before CROSSING levels of 200m by Q1-23). Cash spend related to C-band stood at $4.5bn as of 9M, and one will likely see anything between $0.5bn-$1.5bn of cash outflows related to this in Q4. The good thing is that this is unlikely to be much of an encumbrance in FY23 and free cash flow generation should start looking up then (just for some context as of 9M-23, FCF generation was down by 28% at $12.4bn)
Wall-Street Is Sitting On The Fence
Currently, the sell-side analyst community isn’t entirely gung-ho about VZ’s stock; in fact, it appears that the majority of them are actually sitting on the fence. Data from YCharts shows that 69% of the 29 analysts who cover the stock only have a HOLD rating on the stock; 28% have ‘BUY’ or ‘OUTPERFORM’ ratings, whilst just one analyst is bearish.
YCharts
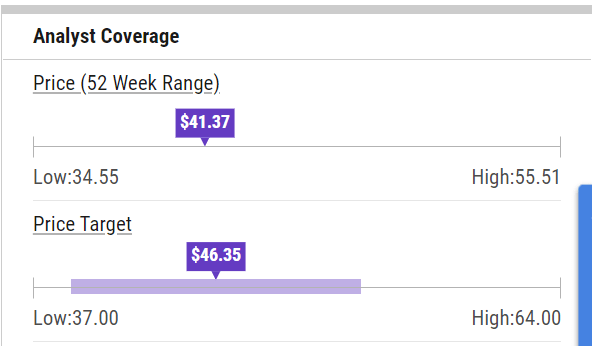
Also note that the average price target works out to $46.35, implying around 12% returns from the current price levels.
From a risk perspective, I suppose it helps that the analyst community is not unequivocal in taking a bullish stance at the moment. This way, any big awkward surprises on the results front can be digested more easily; whereas, for instance, when the entire community is positioned one way and when results come up short, one could see some pretty drastic swings as analysts scramble to readjust things.
Subdued EBITDA Growth Translates To A Subdued Valuation Multiple
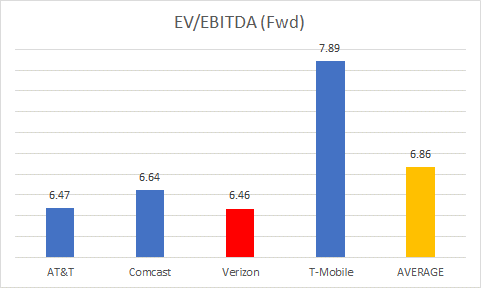
Verizon’s stock has traditionally traded within a forward EV/EBITDA range of 6.16-7.52x. With an expected FY24e EBITDA figure of $49.65 bn, investors may be swayed by the fact that you’re looking at an EV/EBITDA multiple (6.46x) that is a lot closer to the lower end of its 5-year range. Incidentally, at 6.46x (based on FY24 numbers), VZ is also one of the cheapest options when compared to its largest peers in the space.
YCharts
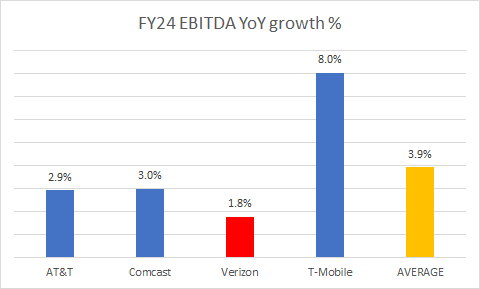
But before you get carried away with things, I’d also urge you to consider that VZ offers the lowest EBITDA growth expansion amongst all these peers. In FY24, you will only get less than 2% of EBTIDA growth, below the peer set average of less than 4%.
YCharts
The Technical Picture Looks Mixed
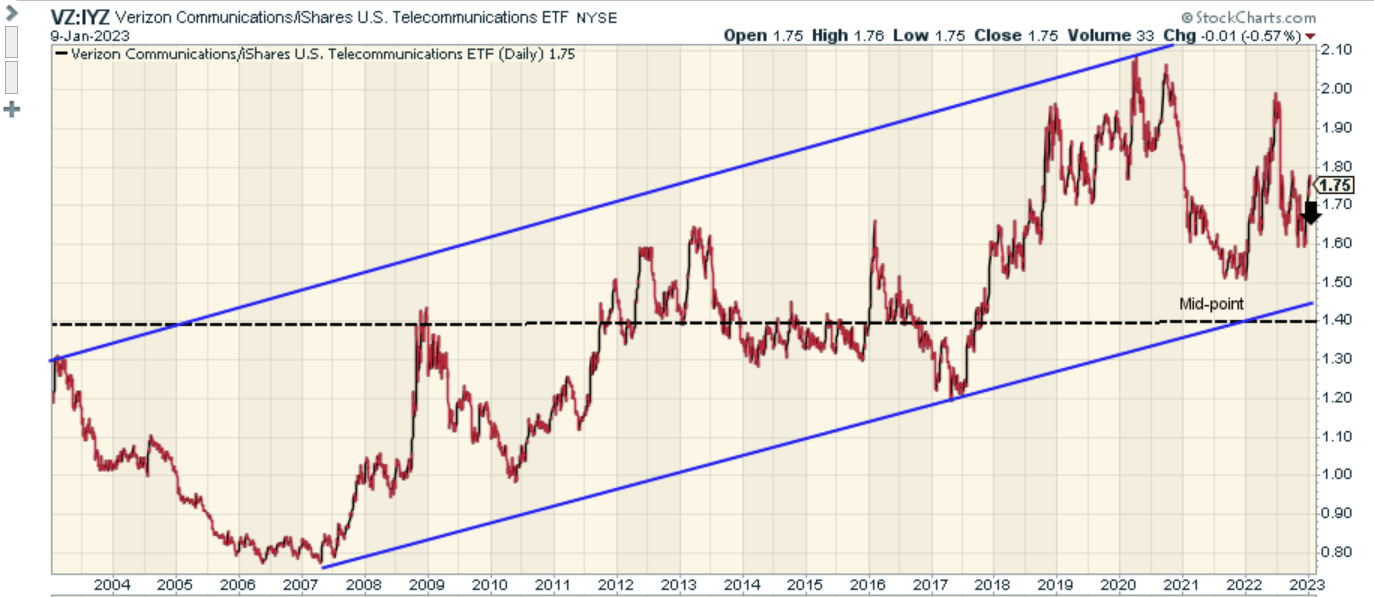
Firstly, let’s ascertain if the conditions are suitable for Verizon to emerge as a mean-reversion candidate in the US telecommunication space. The chart below shows that the relative strength ratio of VZ and the ETF IYZ has been trending up in the shape of an ascending channel for close to two decades.
Stockcharts
Based on where the ratio is currently perched (somewhere in the middle of the channel), one has to admit that the risk-reward is just about fair. However, one should also note that the ratio is currently trading at a level that is 25% higher than the mid-point of the two-decade range, which suggests that it may not be the best mean-reversion pick around in the US telecommunication space.
Investing
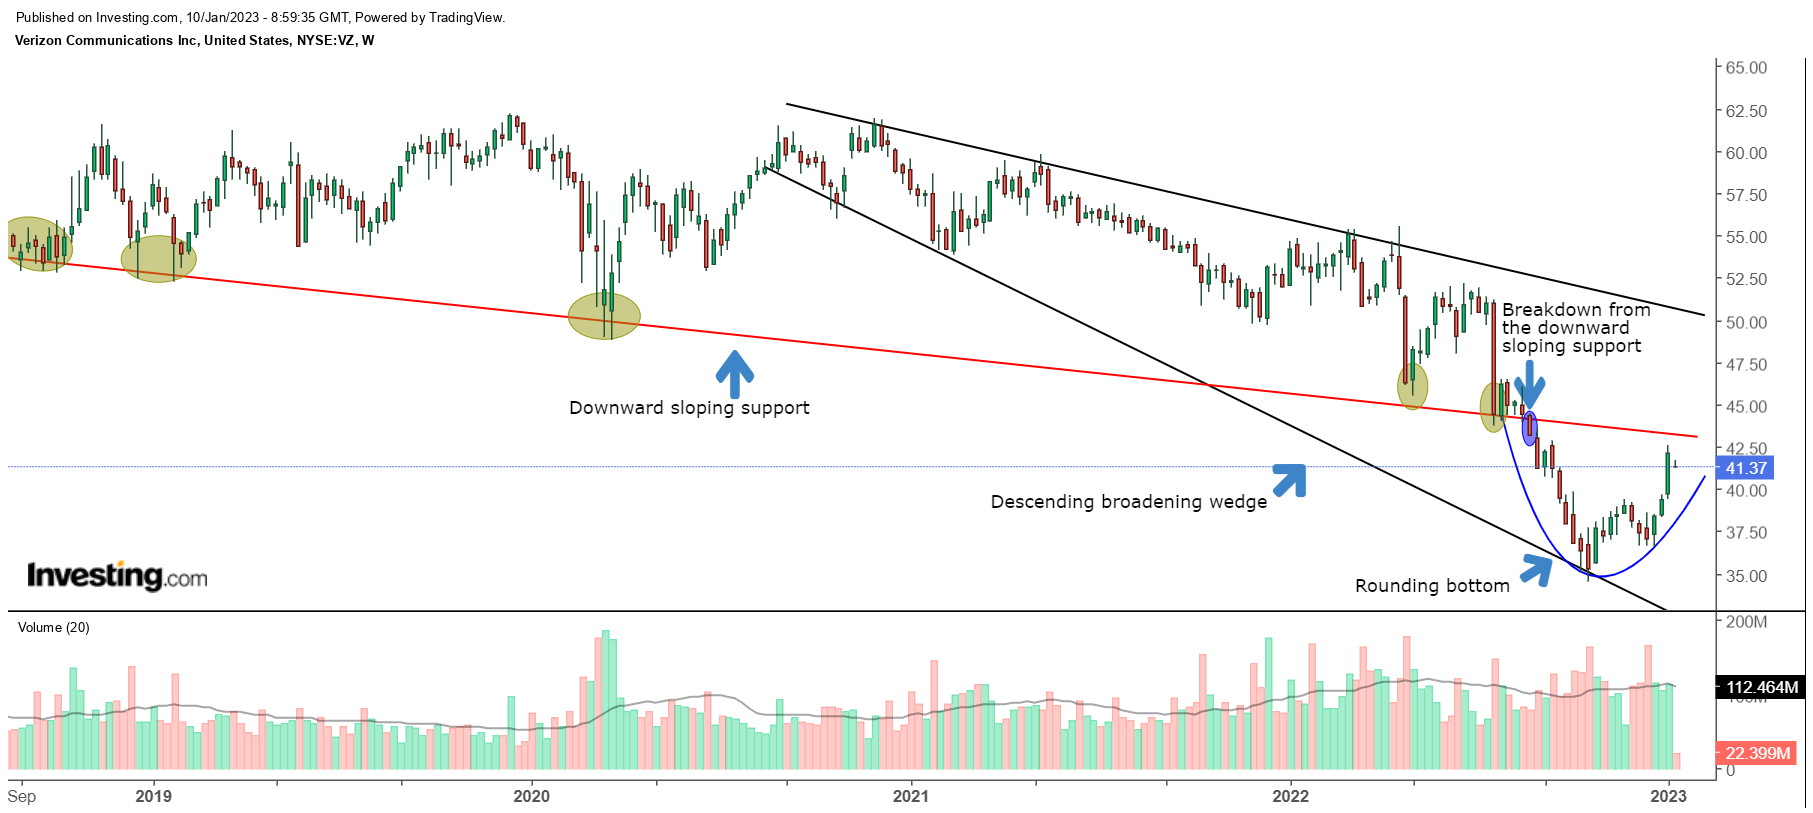
On the standalone weekly chart, there are quite a few things to highlight. Currently, two dominant patterns are playing out. The first one is a descending broadening wedge pattern which has been in play since August 2020. In August 2022, we saw the price drop below a long-standing downward-sloping support zone which was a cause for concern. However, the stock managed to bounce off the lower boundary of the wedge and has since formed an encouraging second intermediate pattern- a rounding bottom pattern- just below the breakdown point.
Whilst it has been heartening to see a quick reversal of fortunes since mid-October, I would be a tad cautious to consider an entry at this point, as the old support may well serve as a fresh zone of resistance. Even if it clears that resistance zone, the risk-reward on the descending broadening wedge pattern won’t be wholly compelling.
Be the first to comment