

MF3d
Investment Thesis
T, VZ, & TMUS Performance Metrics
Seeking Alpha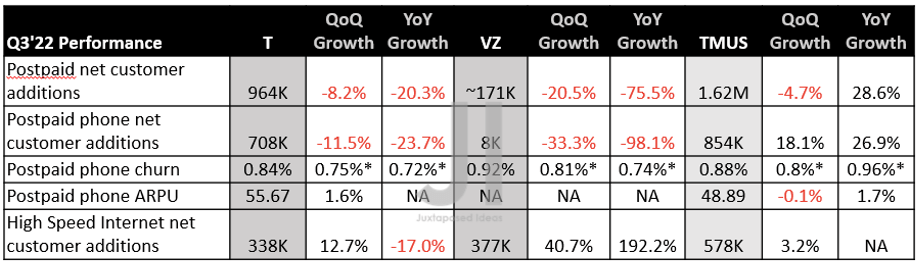
Verizon (NYSE:VZ) has continued to underperform with slower growth across the board, especially worsened by the YoY increase in postpaid phone churn from 0.74% to 0.92%. When compared to AT&T (T) and T-Mobile’s (TMUS) excellent performance in their recent Q3’22 earnings call, it is no wonder that the VZ stock has plunged by -28.26% YTD against T’s decline of -4.29%, TMUS’s rally of 29.9%, and the S&P 500 Index’s -21.85% at the same time.
T, VZ, & TMUS YTD Stock Price
Seeking Alpha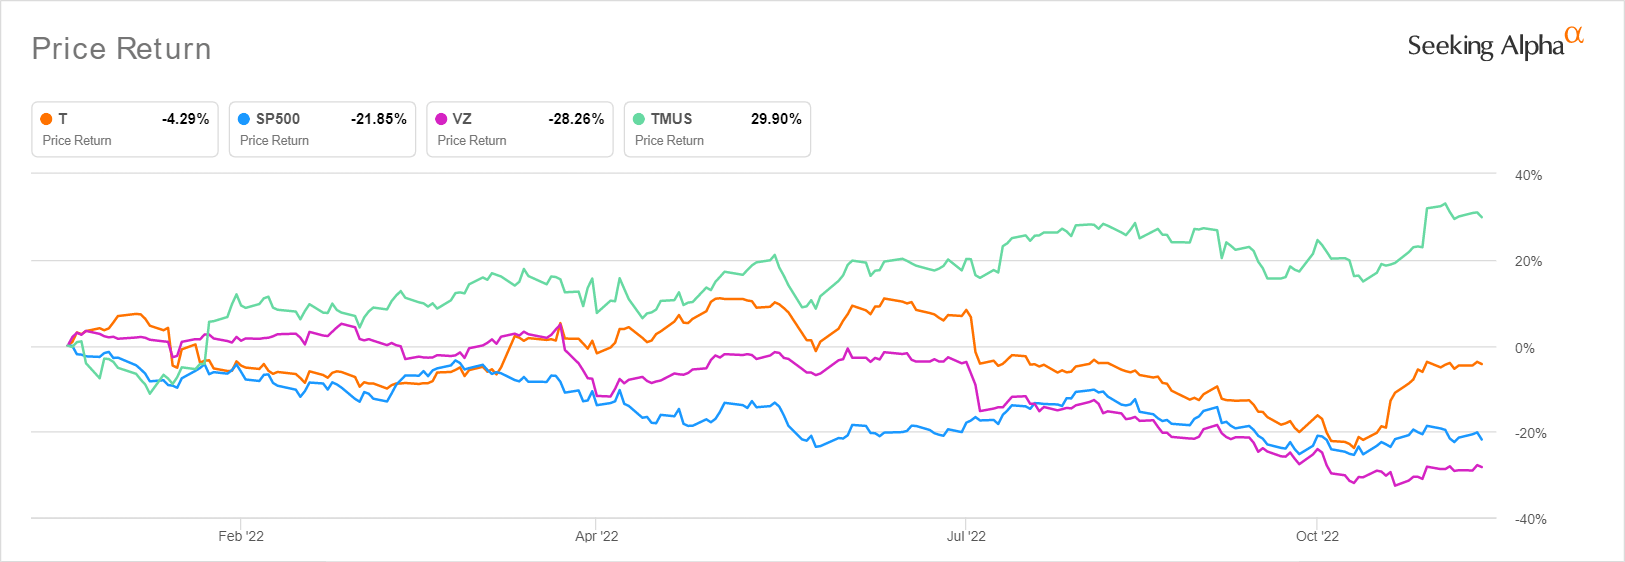
VZ’s competitors are naturally trading optimistically, with a notable 25.63% and 13.01% rally from the recent bottom in mid-October, significantly boosted by their raised FY2022 guidance. It is apparent that T’s acquisition strategy has worked, putting our previous bearish sentiments to sleep. Furthermore, the company continues to report improvements in its postpaid phone ARPU by 1.6% QoQ, despite the rising inflationary pressure and worsening macroeconomics. Meanwhile, TMUS naturally trumped competition with record-high postpaid net customer additions of 1.62M in Q3’22, further aided by the slowing YoY churn from 0.96% to 0.88%.
The only saving grace for VZ truly is its current dividend yields of 6.91%, which has continued to grow since our first article in July 2022 from yields of 5.05%. Naturally, only suitable for those with a stomach for volatility, given the company’s poorer performance thus far.
How Does Their Financial Performance Compare?
T, VZ, & TMUS Revenue, Net Income ( in billion $ ) %, EBIT %, and EPS
S&P Capital IQ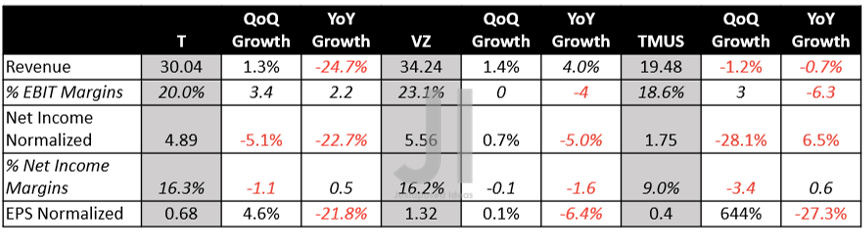
Despite the supposed destruction of demand, VZ continues to deliver robust top and bottom lines in Q3’22, with revenues of $34.24B, net incomes of $5.56B, and EPS of $1.32. These numbers have shown promising QoQ improvement indeed, thereby pointing to the stock’s overly-beaten state at extreme 11Y lows. T also reported a decent EBIT margin and adj. EPS expansion QoQ after the divestiture of Warner Brothers in H1’22, pointing to a potential turnabout in its forward execution and profitability.
T, VZ, & TMUS Cash/ Equivalents, FCF ( in billion $ ) %, Debts & Dividends
S&P Capital IQ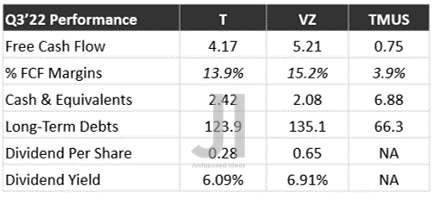
Both T & VZ reported rich Free Cash Flow (FCF) generation of $4.17B and $5.21B for Q3’22, though notably with -11.8% QoQ/-19.2% YoY decline and -11.7% QoQ/-6.5% YoY decline, respectively. This is due to their elevated capital expenditure of $19.4B and $22.2B over the last twelve months (LTM), indicating an increase of 30.7% and 29.1%, sequentially.
On the other hand, TMUS continues to record impressive 18.8% QoQ growth and 42% YoY in its FCF generation by Q3’22, due to its well-controlled capital expenditure of $13.5B over the LTM, indicating a notably minimal increase of 2.35% sequentially. Combined with the fact that the company does not pay a dividend (amongst other things), it is no wonder that TMUS reported lower long-term debts and higher cash/ equivalents on its balance sheet, despite the Sprint merger in 2020.
In the meantime, T and VZ are doing relatively decent with dividend yields of 6.09% and 6.91%, respectively, pointing to the massive improvement from their 5Y average yield of 2.77% and 1.93%, against the sector 4Y median of 3.55%.
Projected Growth Through FY2024
S&P Capital IQ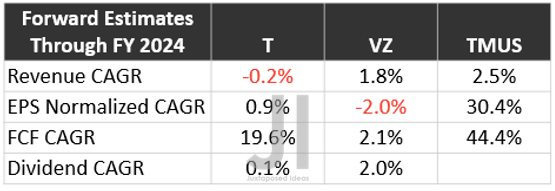
However, we must also highlight the slowing growth in T & VZ’s top and bottom line through FY2024, though the former and TMUS are also expected to record an impressive expansion in their FCF generation at the same time. In contrast, it seems that TMUS has not received the memo about the impending recession, given the aggressive projected growth in its EPS at a CAGR of 30.4% to $9.46 by FY2024. Stellar indeed, against T’s estimates of $2.64 and VZ’s $5.08 at the same time.
Due to all the factors discussed above, TMUS hangs in the balance due to its dangerously high premium, with an interestingly rosy price target of $176 and an 18.41% upside, even after its massive rally thus far. It is likely that the stock would plunge at the slightest whisper of slowing growth, since it is also trading way higher than its 5Y mean EV/Revenue valuations. Opportunistic investors may also want to take some gains off the table first, since one can always add later during dips.
Another interesting approach would be to sell some TMUS for Deutsche Telekom (OTCQX:DTEGF), which owns approximately 48.4% of the former’s outstanding stocks, which you may read about more here. Its dividend yields of 3.46% look decent as well.
In the meantime, we encourage you to read our previous article, which would help you better understand its position and market opportunities.
- Lo And Behold Verizon At 10Y Low – Will We See Higher Yields Soon?
- Verizon: The Fed Will Be The Ultimate Test
So, Is VZ & TMUS Stock A Buy, Sell, or Hold?
T, VZ, & TMUS 5Y EV/Revenue
S&P Capital IQ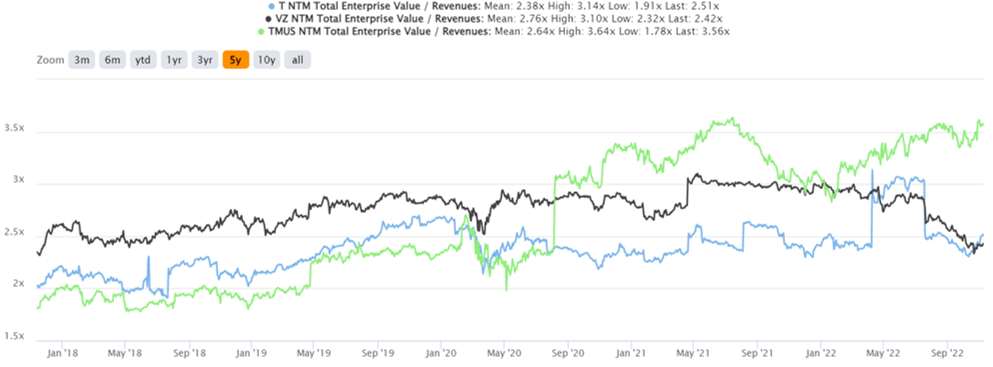
T is currently trading at a moderate EV/NTM Revenue of 2.51x, climbing below its previous rut, while VZ remains overly beaten at 2.42x, nearing its 5Y low of 2.32x. Meanwhile, the TMUS stock trades dangerously upbeat at EV/NTM Revenue of 3.56x, nearing its 5Y highs of 3.64x.
T, VZ, & TMUS 5Y P/E Valuations
S&P Capital IQ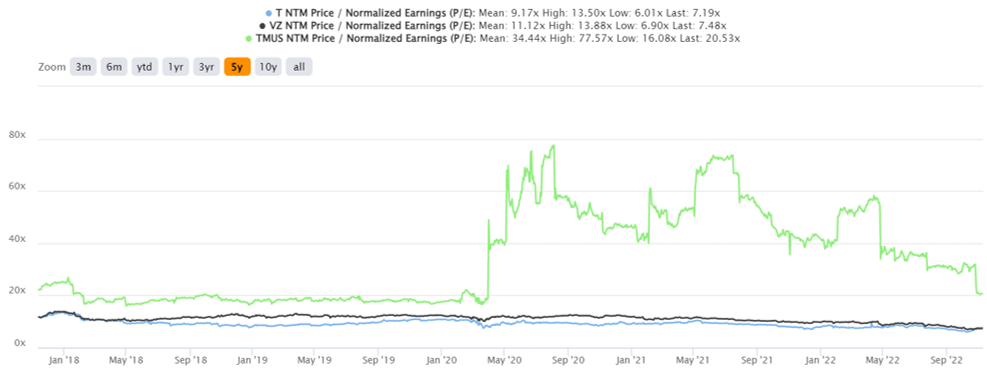
It is evident that Mr. Market is very confident that TMUS will continue delivering massive growth despite the impending recession, due to its similarly elevated NTM P/E of 20.53x, compared to T at 7.19x and VZ at 7.48x nearing their 5Y lows. Nonetheless, consensus estimates are still bullish about T’s and VZ’s prospects, with price targets of $20.43/$46.78 and 11.15%/24.35% upside from current prices.
Depending on how Mr. Market reacts to the upbeat results of October CPI reports and the Fed’s supposed pivot by the December meeting, we may see more short-term bubbly optimism ahead. Furthermore, VZ may have found its sustainable rock-bottom levels here, thanks to the poorer results thus far. Therefore, bottom-fishing investors may potentially nibble at these 11Y low levels. Investors who had loaded up at previous lows would have enjoyed stellar dividend yields of 7.6% by FY2024. Naturally, investors should ignore the noise about the value destruction thus far, since VZ should not be viewed as a high-growth stock but rather as an arguably blue-chip dividend stock.
On the other hand, though its debt levels have also somewhat moderated from peak levels of $149.29B in FQ1’21 to $135.19B by FQ3’22, investors must note its eye-watering interest expenses of $3.24B over the LTM. Furthermore, the company is looking at a massive $28.16B in long-term debt maturity within the next five years. Combined with the tremendous $10.69B of dividends paid over the LTM, portfolios should also be sized appropriately since the worst of the recession has yet to hit.
Be the first to comment