

Nastco/iStock via Getty Images
Sector and Industry Performance
As for the 1-month relative performance, the Technology sector has been one of the underdogs, having returned a loss of 7.27%, only slightly better than negative 8.4% for Consumer Cyclical.
1-Month Performance Sectors (Finviz)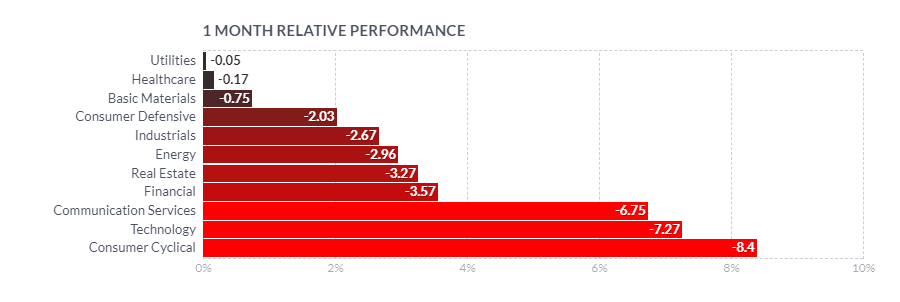
The 1-week return: the Technology sector was the worst-performing sector with a negative return of 2.29%, while the best performing Utilities have returned 1.4%.
1-Week Performance Sectors (Finviz)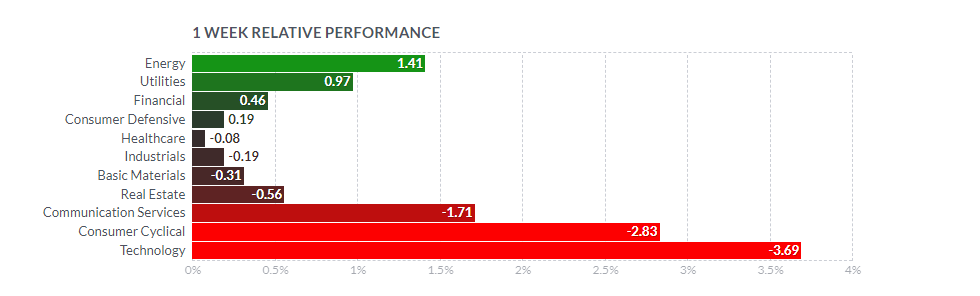
On the level of Technology sector, the Software Infrastructure industry, to which VeriSign, Inc. (NASDAQ:VRSN) is classified on Finviz, has been the second best amongst all industries (all painting red), with a loss of only 3.39%, slightly behind the Communication Equipment industry.
1-Month Performance Industries in Technology Sector (Finviz)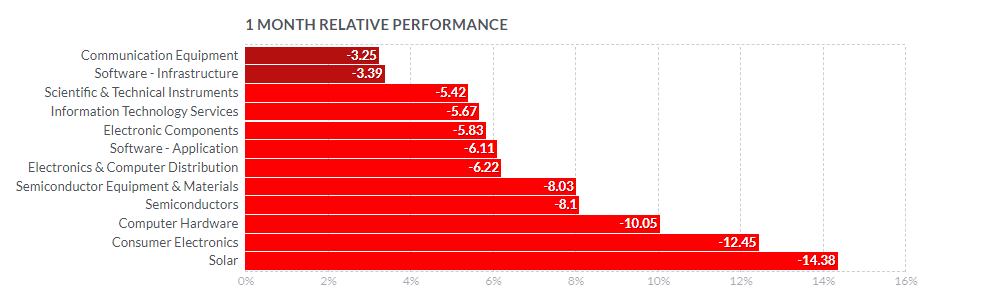
On the 1-week return basis, Software Infrastructure has landed somewhere in the middle, bringing home a slight loss of 2.96%. In both comparisons, the Solar industry drags the sector’s performance down.
1-Week Performance Industries in Technology Sector (Finviz)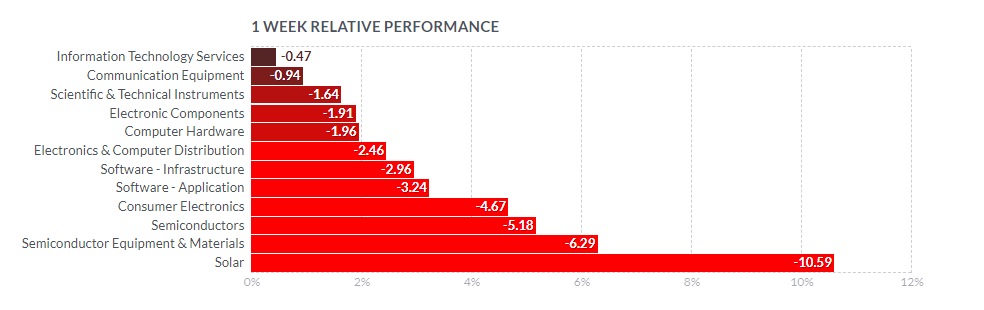
About the business
For a business description of the $21.32B cap VeriSign, I have looked at the last 2021 Annual Report, both for the industry description and the related competitors. In the words of the company itself, VeriSign is
“a global provider of domain name registry services and internet infrastructure, enabling internet navigation for many of the world’s most recognized domain names ” who enables “the security, stability, and resiliency of key internet infrastructure and services, including providing root zone maintainer services, operating two of the 13 global internet root servers, and providing registration services and authoritative resolution for the .com and .net top-level domains (“TLDs”), which support the majority of global e-commerce.”
Hence, VeriSign faces competition from both the generic and country-code top-level domains (“gTLDs” and “ccTLDs”) providers such as China Internet Network Information Center (CNNIC), DENIC, Nominet, Public Interest Registry (PIR), Donuts, GoDaddy (GDDY), and Radix. From all the aforementioned, only GoDaddy is a publicly traded company.
To a certain extent, wherever end-users navigate using search engines or social media (vs. direct navigation via domain names) or transact on e-commerce platforms, VeriSign’s competition includes search engines (Google of Alphabet (GOOG) (GOOGL), Bing of Microsoft (MSFT), and Baidu (BIDU)), social media networks (Facebook of META, WeChat of Tencent (OTCPK:TCEHY)), e-commerce platforms (Amazon (AMZN), eBay (EBAY), and Taobao of Alibaba (BABA)), and microblogging tools (Twitter (TWTR)).
As can be seen below for selected tickers (for visual clarity purposes), the YTD return of VeriSign has been on par with the one of S&P500 index (to which VeriSign belongs) reflected by ETF SPY, with the return of -20.35 and -21.15% respectively, only beaten by GoDaddy’s -13.76%, but better than Baidu’s -25.32%, Nasdaq-100 represented here by QQQ with -35.25%, Alphabet’s -40.40%, Amazon’s -52% or Meta Platforms’ -65.85%.
Comparison with Competitors and Indexes YTD (TradingView)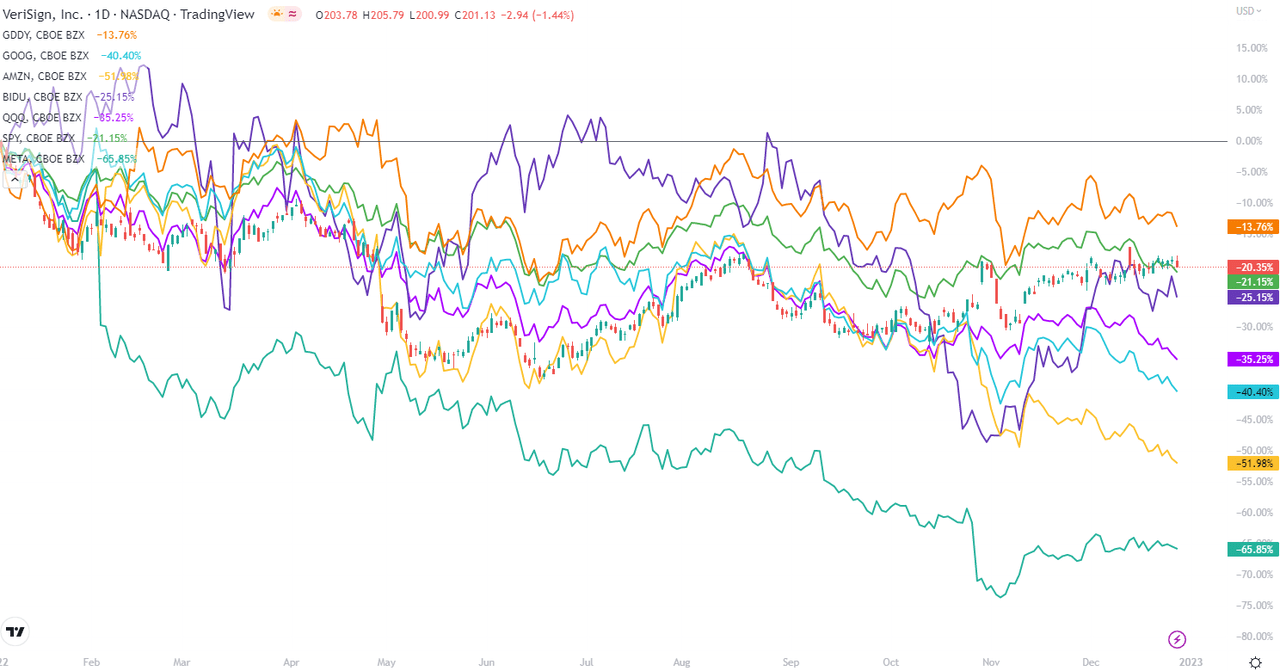
Explanation of My Technical Analysis Toolbox
I will analyze VeriSign from a perspective of a number of technical analysis tools and show the screenshots on the monthly, weekly, and daily Heikin Ashi candles charts – each timeframe presented through two separate sets of indicators – which I will complement with a simplified daily Renko chart.
The first chart setup (I will call it Chart 1) uses Bill William’s Alligator indicator and Awesome Oscillator, as well as Ichimoku Clouds and On Balance Volume indicator line. For fundamentals, I show the quarterly revenue trend which I use for a quick visual triage.
The Alligator technical analysis tool uses three smoothed moving averages that are based on thirteen, eight, and five periods, called also Jaw (blue line), Teeth (red line), and Lips (green line), respectively. Due to the smoothing of each moving average, the Jaw makes the slowest turns and the Lips make the fastest turns. The Lips crossing down through the other lines signals a short opportunity while crossing upward signals a buying opportunity.
William’s Awesome Oscillator (AO) is a market momentum tool that visualizes a histogram of two moving averages, calculated on median prices of a recent number of periods compared to the momentum of a larger number of previous periods. If the AO histogram is crossing above the zero line, that’s indicative of bullish momentum. Conversely, when it crosses below zero, it may indicate bearish momentum.
As for the Ichimoku Cloud – I am not using a full set of lines of Ichimoku lines, only the Leading Spans A and B, whose crosses dictates the color of the Cloud and whose individual lines provide levels of the strongest support and resistance lines. Ichimoku averages are plotted into the future which in its own right provides a clearer picture but has no predictive powers.
On-Balance-Volume (OBV) indicator is a volume-based tool and is supposed to indicate the crowd sentiment about the price. OBV provides a running total of an asset’s trading volume and indicates whether this volume is flowing in or out, especially when viewed in divergence with the price action.
The second chart setting (Chart 2) uses 2 moving averages (10- and 50-period), volume, and volume’s 20-period average. On the screenshot from top to bottom, you will see the Composite Index Divergence Indicator (CIDI), which I learned from the book of Constance Brown, as well as J. Welles Wilder’s Directional Movement Indicator (DMI). I also use MACD (Moving Average Convergence Divergence) which is well known to everybody: I seek crossovers of MACD and signal, as well as above/below the zero level.
CIDI comes from a combination of RSI with the Momentum indicator. For more literature, see Brown’s paper or read her book. CIDI has been developed to solve the problem of RSI not being able to show divergence. I personally use the CIDI’s crossover above and below its slow- and fast-moving averages, as well as the position of the averages against each other.
As for DMI, I skip the ADX line because it doesn’t give me anything. Instead, I focus on the crossovers of the Positive Direction Indicator DI+ and Negative Direction Indicator DI-. When the DI+ is above DI-, the current price momentum is upwards. When the DI- is above DI+, the current price momentum is downwards.
On the use of Heikin Ashi candles and Renko boxes, I use them as tools for trend reversal and continuation identification. Renko charts do not have a time scale and they are built on price movements that must be big enough to create a new box or brick. Similar to Heikin Ashi, Renko charts filter the noise.
As you might have guessed, my focus is on identifying the trend reversal and filtering the noise that allows the position continuation without the risk of too many false signals. However, I will be honest with you – I am not showing here all the technical indicators that I use for screening and analysis since they belong to my secret sauce.
The Long-Term Trend
For the long-term trend analysis, I use monthly charts. See below Chart 1, which shows a very narrow range of trading for VeriSign stock between 2019 till the end of 2021. This narrow range will be reflected in the closeness of Ichimoku Lead 1 and Lead 2 lines, to be projected to the future and keep close to the nearest strong resistance level at the $222 price (purple horizontal line). The year 2022 brought a nearly 40% correction from the high in December 2021 (see the orange horizontal line at the level of $257) to the low of June 2022. I have drawn downtrend and uptrend lines that cross around March 2023. Possibly between now and then, we will be able to see still a narrow range of trading until the moment of a stronger decision point. We can appreciate that Awesome Indicator, although still below zero, has turned green and the On-Balance-Volume line is also pointing upwards. The most promising sign is visible in the upwards direction of all the lines of the Alligator. However, we would need to wait for a more decisive crossing of these averages in a positive direction. Also, the fact that the price has been in such a narrow range for the last 3 years might as well mean that the stock was in the distribution mode and the Spring 2023 turn could be downwards. If so, given the consistent growth of VeriSign’s revenues (bottom panel), this could present a correction moment to buy a profitable company.
Chart 1 – Monthly (TradingView)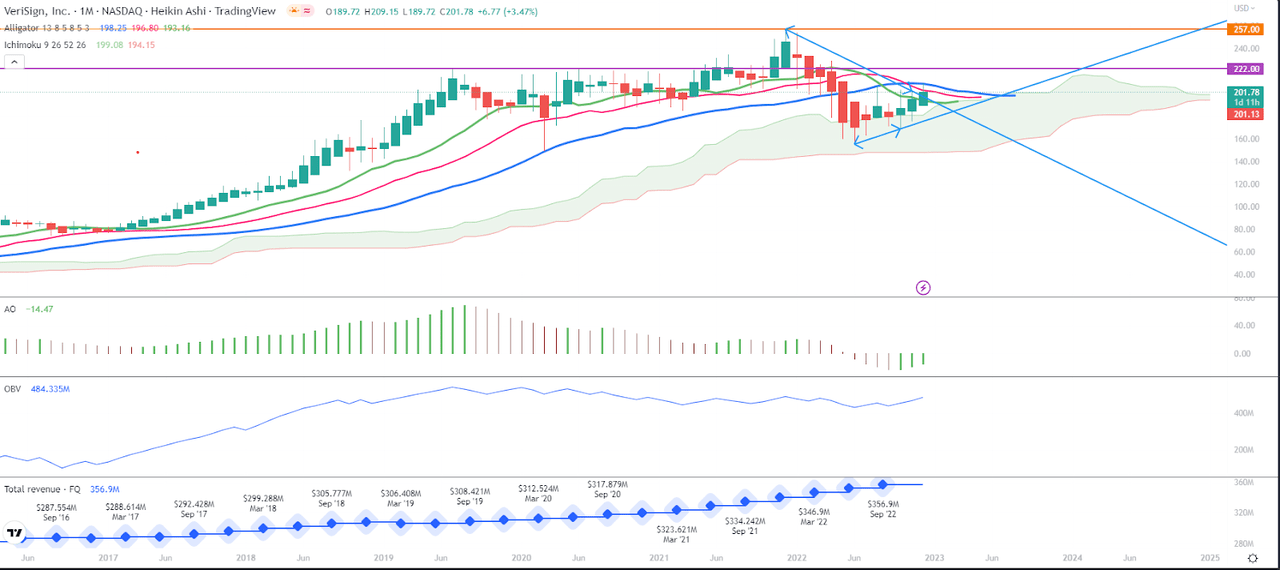
On Chart 2, besides the 10-month Moving Average still below the 50-month (though showing signs of turning towards the cross from below), we can also see the positive volume levels since October, painting above the 20-month average. CIDI has crossed above both the fast (green) and slow (orange) average, while the MACD has made a turn and approaches the signal. Within a couple of days (after December 31) we should see the position of MACD more clearly. The monthly Positive Direction Indicator DI+ has crossed above Negative Direction Indicator DI-, indicating a possible beginning of an uptrend.
Chart 2 – Monthly (TradingView)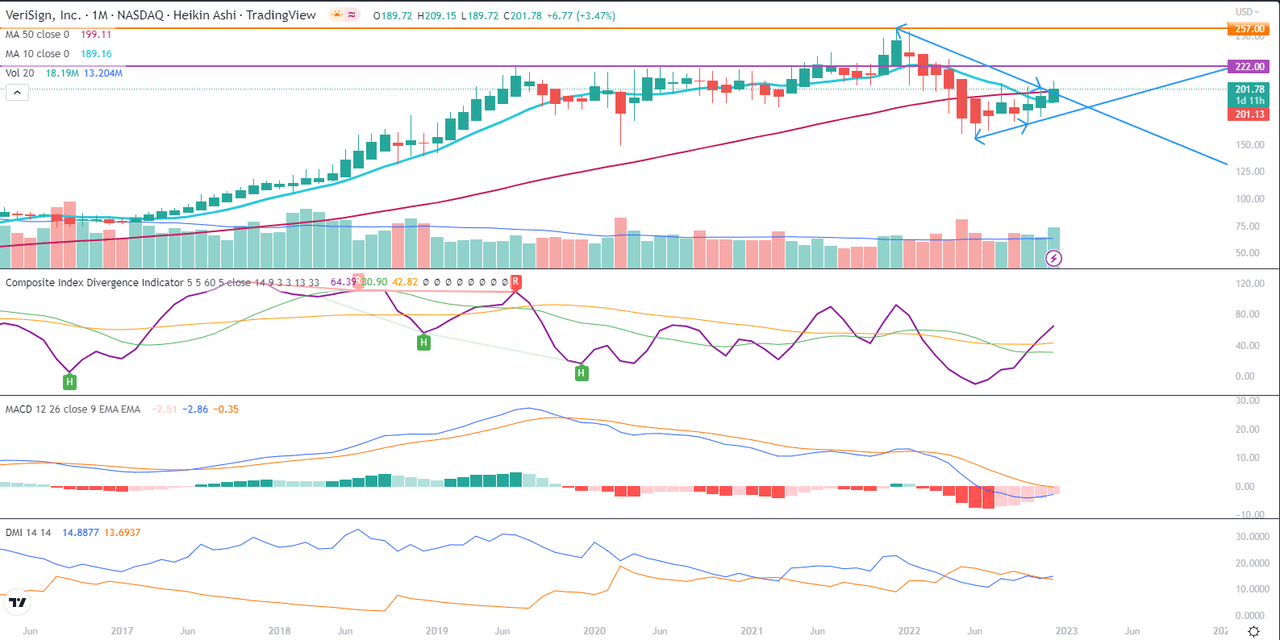
The Mid-Term Trend
As we can notice on Chart 1, the Alligator’s Lips and Teeth lines are well above the Jaw line and their orientation is slightly upward. There is quite a strong resistance line on the edge of the current red Ichimoku Cloud at the level of $206. The mentioned edge is a mid-term resistance line and we can expect the Heikin Ashi candles to turn red for a couple of next weeks. The Cloud’s bottom edge has also been rising successively to possibly switch color to green within the coming weeks, after having corrected to the level of $190 or $184. We can also see that AO has crossed above the zero line, indicating the start of medium-term positive price momentum. OBV line has reached above the previous highest levels recorded in 2021 and the highest year to date.
Chart 1 – Weekly (TradingView)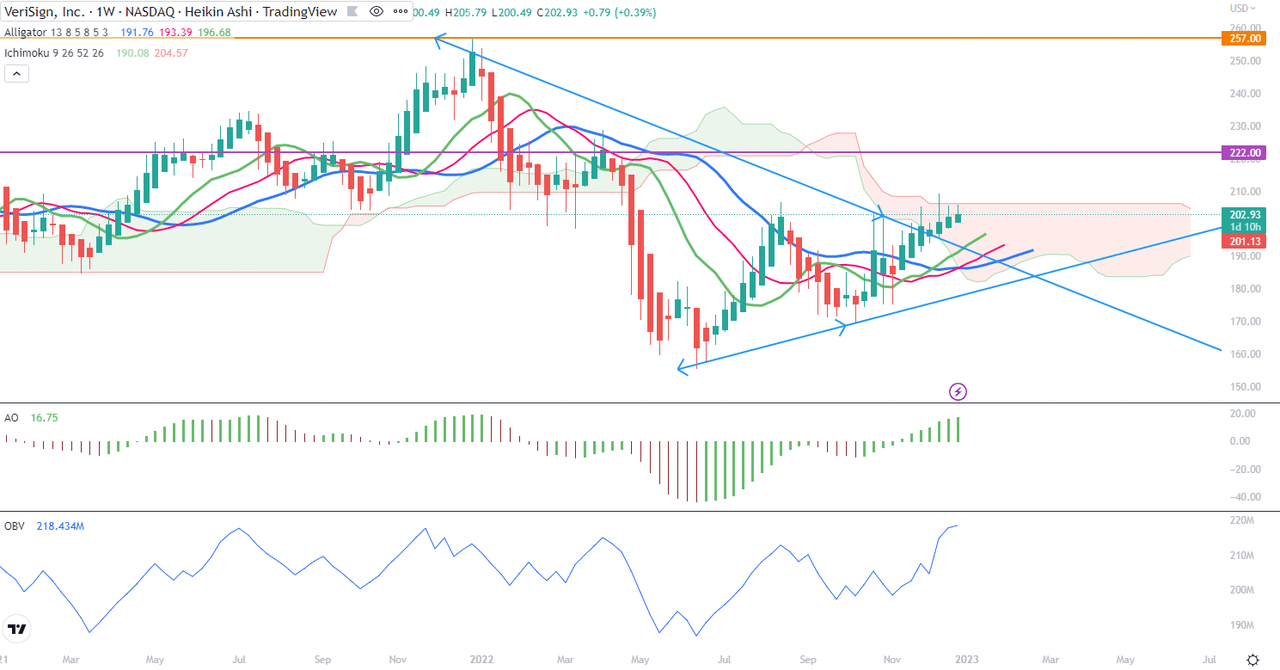
On Chart 2, we can appreciate that 10-week MA has just crossed the 50-week MA from below and this took place on a high volume. The U-turn of CIDI (purple line on the first panel below the chart) could indicate the upcoming pullback which I have been mentioning earlier. Despite this forecast, the CIDI’s averages are upwards facing, with fast being above the slow one. Also, MACD and its signal have crossed the zero level and indicate a positive momentum. Positive Direction Indicator DI+ might fall closer to Negative Direction Indicator DI-, but for the time being it is in positive territory.
Chart 2 – Weekly (TradingView)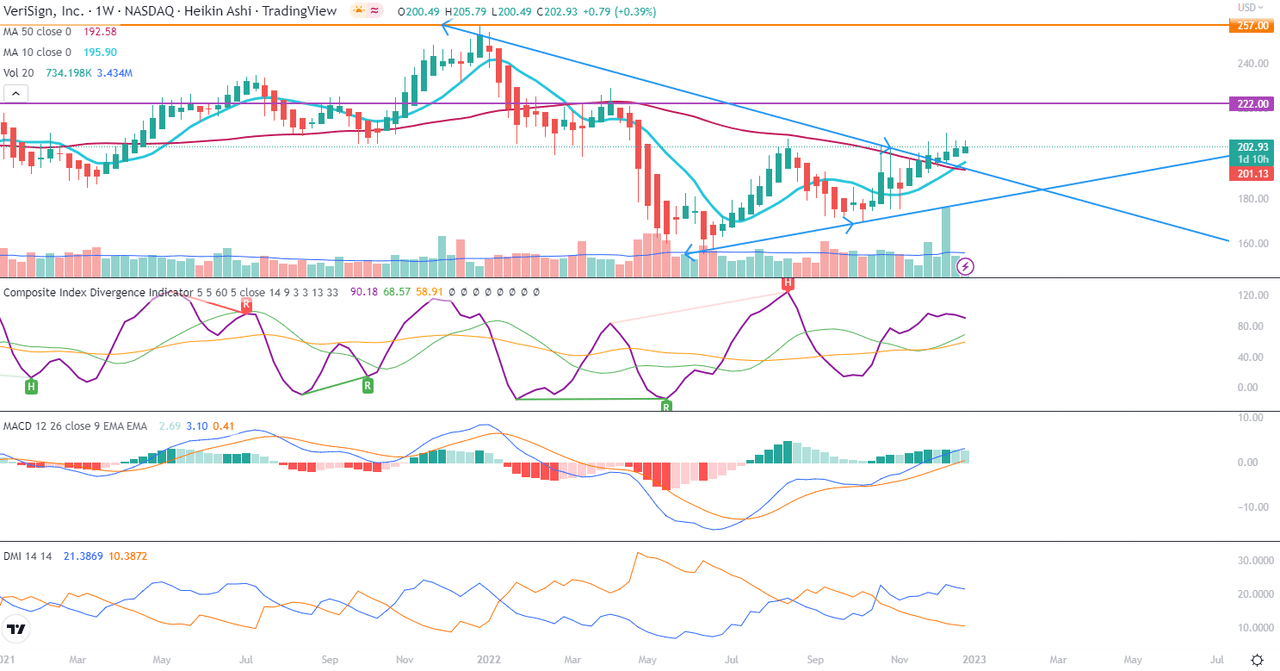
The Short-Term Trend
As we can see on Chart 1, the Ichimoku Cloud has become a bit fatter, reflecting two rallies that followed the October 27 earnings announcements. The price now oscillates around the recent highs from August and October, in the corridor between $194 (I drew a new pink support line at $194.20) and $205, achieved by wicks of a couple of candles (the highest crossed $209 on December 13). AO keeps positive but turns red, dropping together with OBV. All the lines of the Alligator are upwards but with narrowing space between them, which could indicate an approaching change in the short-term trend.
Chart 1 – Daily (TradingView)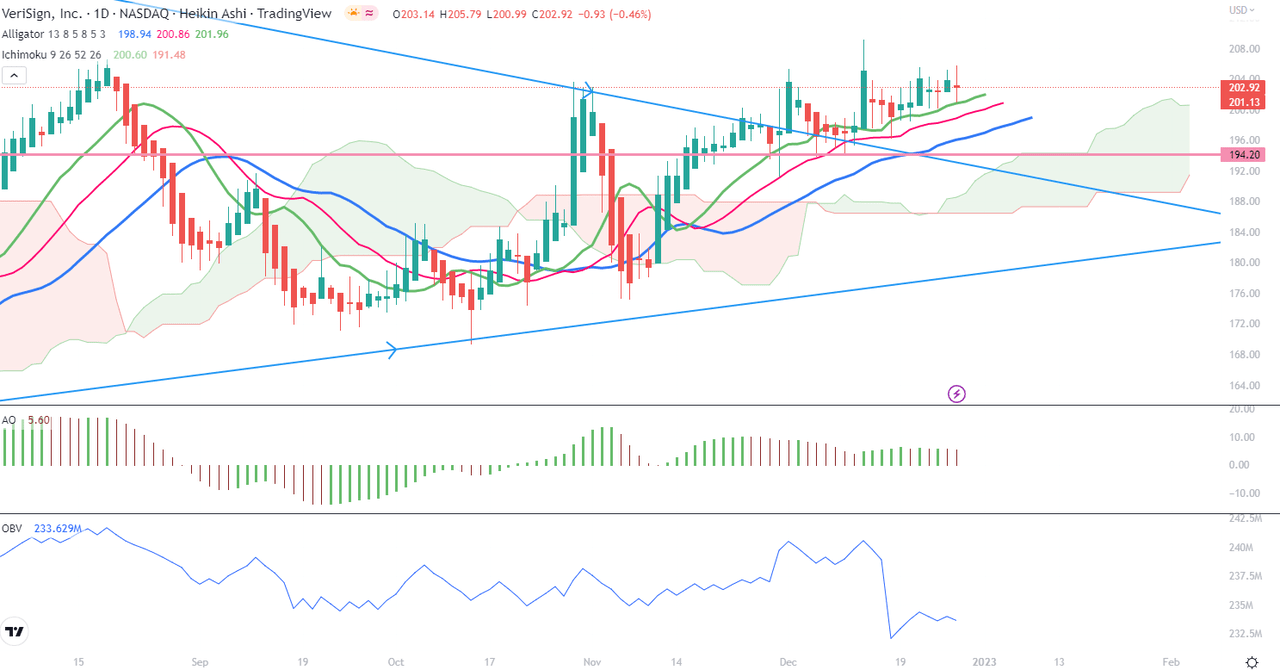
As for the picture on Chart 2, the 10-day MA is well above the 50-day MA but becomes flattish, after a big red volume day on December 16 put a break to this rise. CIDI and MACD are undecided, although CIDI has a more positive appearance due to the upwards direction of both the main indicator and the fast average approaching the slow one from below. On the DMI level, the positive blue line seems to be approaching the negative orange one, presaging a short-term negative change of trend.
Chart 2 – Daily (TradingView)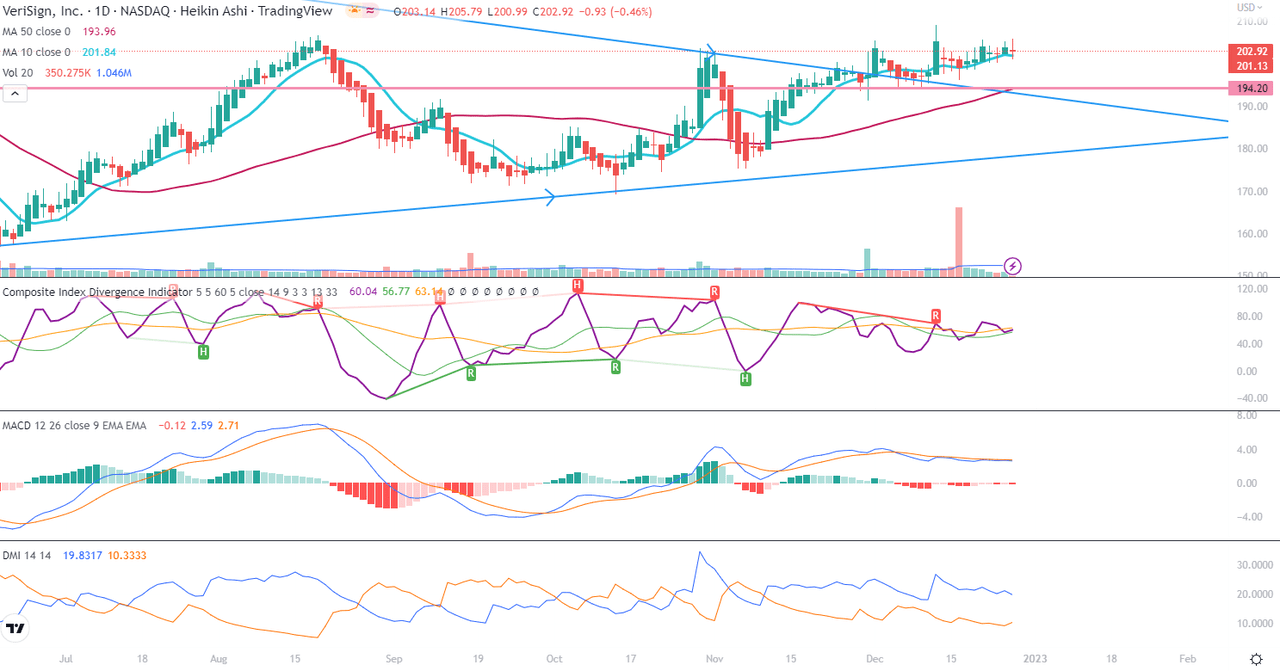
Price Momentum
The daily Renko chart presents the important junction of the moving averages which may resolve both ways. By the looks of MACD crossing above the zero line, the price momentum looks positive but calls for attention since the cross of the 10-box MA above the 50-box one still has to happen to give stronger hopes for the beginning of an uptrend.
Renko Chart – Daily (TradingView)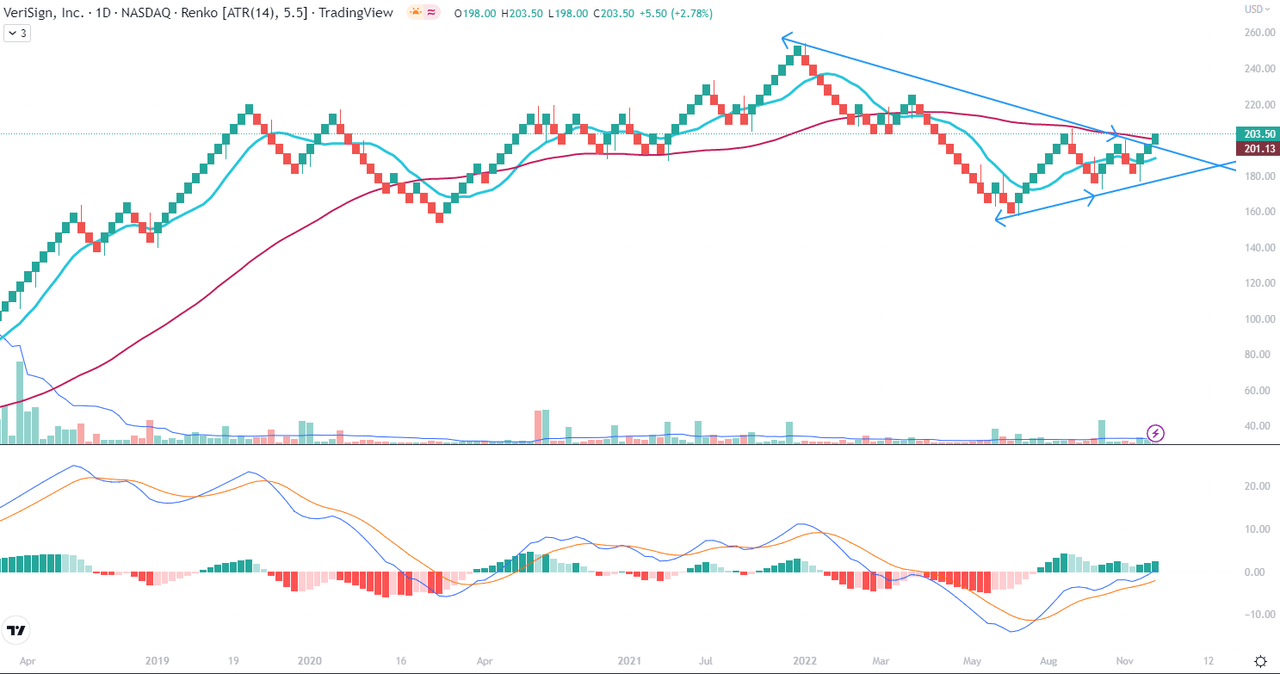
Conclusions
Technically, VeriSign is in waiting mode. Multiple time frames indicate the existence of positive readings of the indicators; however, closer attention needs to be paid to the ability of the stock price to cross above some significant resistance lines marked by past highs. In my opinion, the breakdown or a breakout will pronounce itself within the next 3-4 months so my advice is not to make a significant transaction at the moment unless dictated by the reader’s own due diligence and decision process.
Be the first to comment