

zhongguo
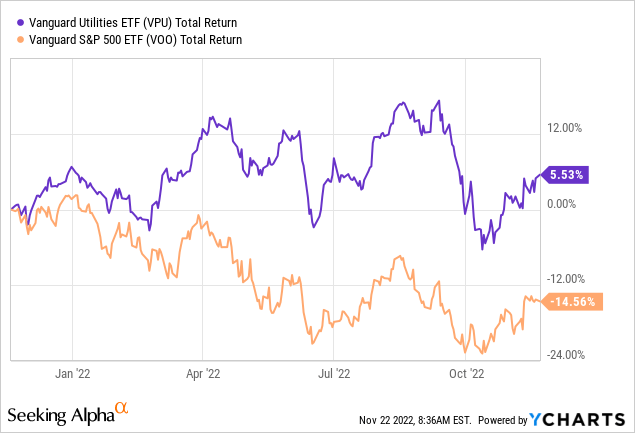
As you know, navigating bear markets is a much more pleasant experience for investors who had built a well-diversified portfolio that included allocation to relatively defensive sectors such as consumer staples, healthcare, and financials – all of which tend to do better than the broad S&P 500 in times of high inflation and rising interest rates. Another important defensive sector is utilities, which provides decent income and also tends to outperform in times of market stress. The Vanguard Utilities ETF (NYSEARCA:VPU) is down ~10% since its high in early September (see below), and is a fund that investors should consider in order to gain exposure to the utility sector. Longer-term, the VPU ETF appears to be well-positioned for the transition to clean-energy and the age of renewable power. Today, I’ll take a closer look at the VPU ETF to see if it might be a good addition to your portfolio.
Investment Thesis
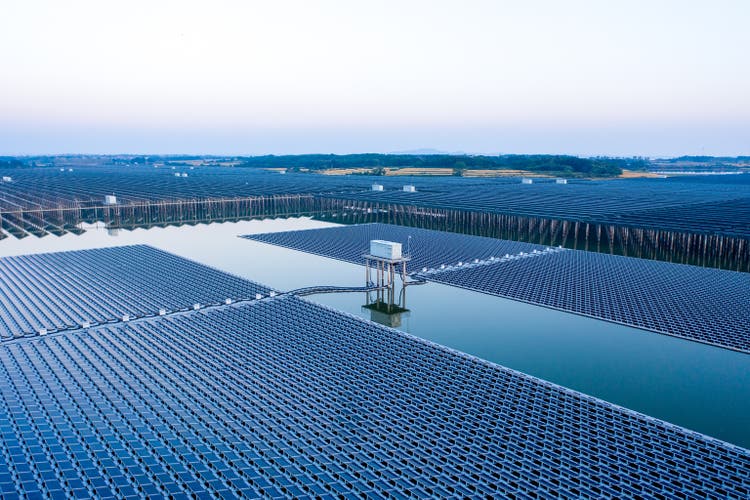
It’s no secret that the global energy grid is being retooled to get more power from renewable power generation (solar, wind, and battery backup) in order to address the existential threat of global warming. At the same time, the transition to EVs is going to require substantially more electric power generation capacity. Utility companies are obviously at the center of this massive transition, and they stand to be beneficiaries of the Biden administration’s ability to pass the bi-partisan Infrastructure Act. This law includes more than $65 billion – the largest in American history – for investments in clean energy transmission and the electric power grid. The Act will also fund new programs to support the development & deployment of cutting-edge clean-tech to accelerate the transition to a zero-emission economy.
Given that background, let’s take a look at the Vanguard Utilities ETF to see how it has positioned investors for success going forward.
Top-10 Holdings
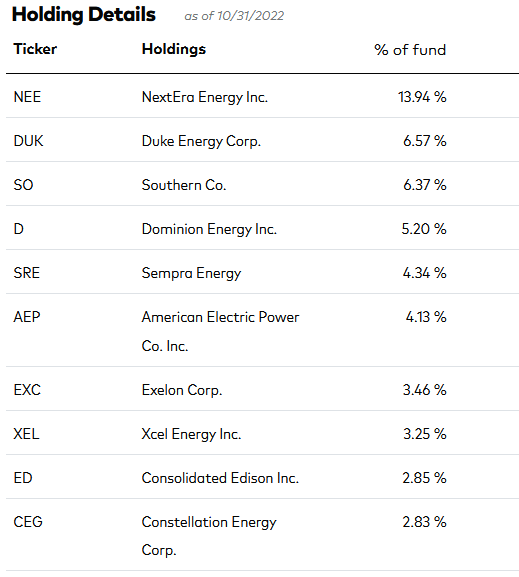
The top-10 holdings of the VPU ETF are shown below and were taken directly from the Vanguard VPU homepage. The top-10 holdings equate to what I consider to be a relatively concentrated 53% of the 65-company portfolio:
Vanguard
The #1 holding with a 13.9% weight is the largest utility company in America: NextEra Energy (NEE). NextEra became the largest utility company in the U.S. by being an early and strong adopter of wind, solar, and natural gas while its more coal centric peers were slow to realize the potential cost advantages of clean energy. Some, like #3 holding Southern Company (SO), even turned to large-scale “clean coal” (an oxymoron if ever there was one…) projects with predictable and disastrous results (see Verdict In: Natural Gas Trumps ‘Clean Coal’).
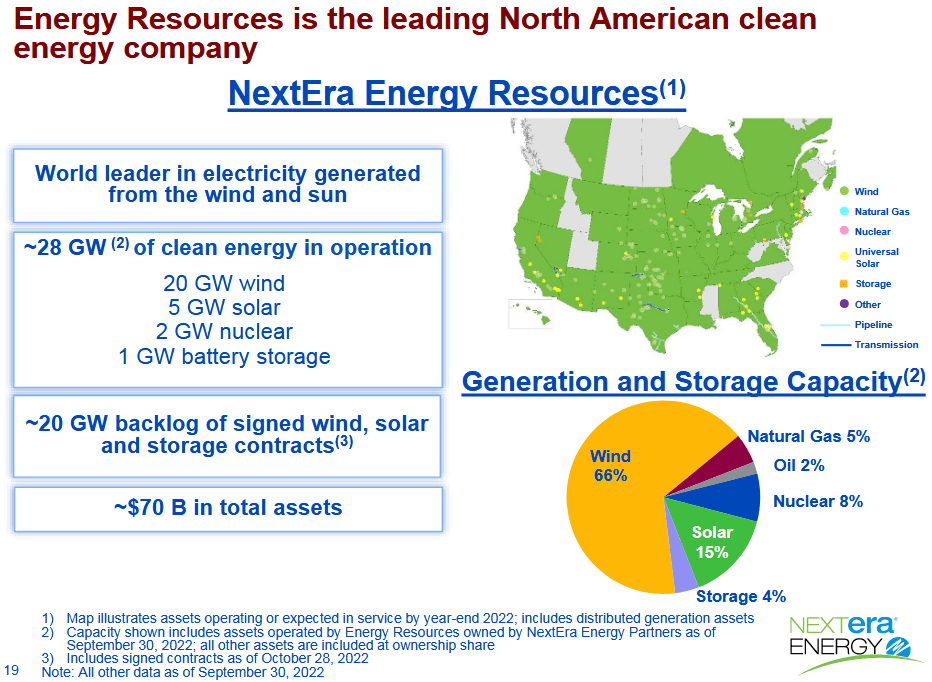
NextEra owns Florida Power & Light (“FP&L”) as well as a clean energy business – NextEra Energy Resources, LLC – which typically drops-down renewable power generation assets to the MLP – NextEra Energy Partners (NEP). Through these subsidiaries, NextEra is the “world’s largest generator of renewable energy from the wind and sun and a world leader in battery storage” (see slide below, and more information on NEE in this recent investor presentation). In addition, NextEra Energy generates clean and emissions-free electricity from seven commercial nuclear plants in Florida, New Hampshire and Wisconsin.
NextEra
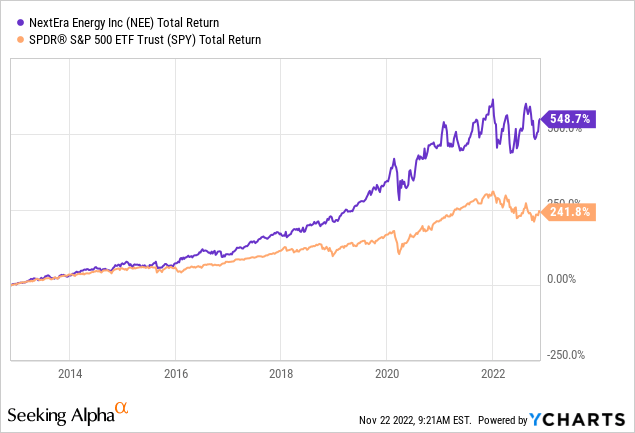
Since 2006, NextEra has grown its dividend at a CAGR of 9.8%, and its stock price at a CAGR of 8.4%. That being the case, NEE has delivered exceptional total-returns for investors over the past decade, more than double that of the broad S&P500 (not bad for a utility company):
Sempra Energy (SRE) is the #5 holding with a 4.3% weight. Sempra is one of North America’s largest energy infrastructure companies, with energy networks and investments in California, Texas, and Mexico. Sempra is set to build a new LNG export plant in Port Arthur, TX. The company’s Q3 report was a strong beat on both the top- and bottom lines. The stock is up 27% over the past year and yields 2.88%.
The #6 holding is American Electric Power (AEP). AEP Corp. owns 40,000 miles of electric power transmission lines – the largest system in the U.S. The company has 26 GW of electric power generation capacity and 5.5 million customers across 11 states. Unfortunately, 40% of AEP’s capacity generation comes from high-cost and dirty coal. AEP stock is up 11% over the past 12-months and yields 3.56%.
The #9 holding is Consolidated Edison (ED) with a 2.85% weight. ConEd delivered a $0.17 beat in Q3 and the stock is up 20% over the past year and yields 3.36%. Last month, ConEd announced it would sell is Clean Energy business to German utility company RWE (OTCPK:RWEOY) in a transaction valued at $6.8 billion.
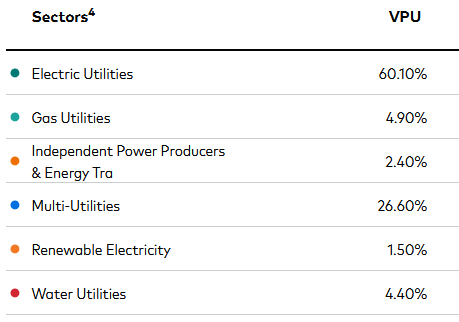
Overall, the VPU portfolio is primarily exposed to the electric utility (60%) and multi-utility oriented companies (26.6%), with lessor allocations to gas and water utilities:
Vanguard
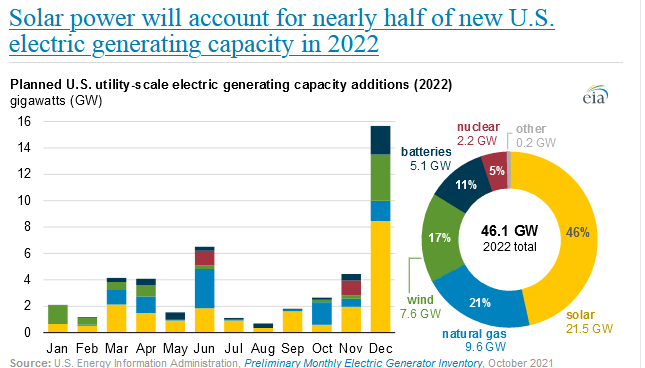
As you can see, the allocation to “pure-play” renewable electricity in VPU is listed as only 1.5%, but that is misleading considering nearly every “Electric Utility” company is currently investing quite heavily in renewable power. Indeed, the EIA reports that the majority of new electric power generation capacity in the U.S. this year will again (just like the past few years…) be from solar & wind (63%). Battery backup capacity additions are expected to be 5.1 GW, or ~11% of new incremental capacity:
EIA
Performance
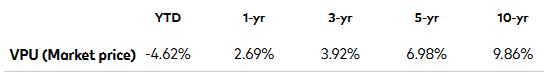
As mentioned in the bullets, VPU has an admirable 10-year average annual return of 9.86%:
Vanguard
The following graphic compares the 3-year total returns of VPU as compared to some of its peers: the SPDR Utilities ETF (XLU), and the Fidelity MSCI Utilities Index ETF (FUTY):
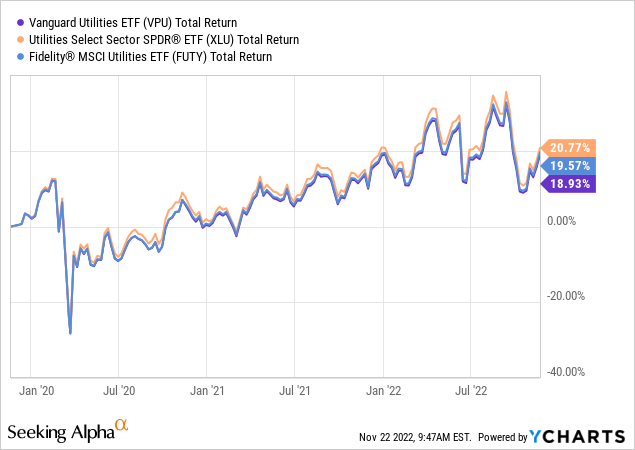
As can be seen in the graphic, the XLU ETF is the leader of the pack. Like VPU, the XLU also has an expense fee of 0.10% but an even larger position in NEE (16.43%). XLU has a TTM yield of 3.04%.
Valuation
The chart below shows some valuation metrics of the VPU versus its rival – the XLU:
| P/E | Price-to-Book | TTM Yield | |
| VPU | 19.7x | 2.1x | 2.94% |
| XLU | 22.4x | 2.15x | 3.04% |
As you can see, other than XLU’s higher P/E valuation, the funds are very similar. XLU’s higher valuation is likely due – at least in part – to its larger allocation to NEE (P/E 43.7x). However, that is also likely why XLU has outperformed VPU by ~1.8% over the past 3-years and by 0.5% over the past year.
Risks
While the risks of investing in the Utility Sector are generally lower as compared to the broad S&P500, the sector is certainly not immune to the investment macro-environment. Higher inflation and higher interest rates can lead to a weaker economy that can result in lower electric power demand from both consumers and industry. That can exert downward pressure on earnings, dividend growth, and ultimately the stock prices.
Upside risks include a faster than expected transition to EVs and therefore great electricity demand and higher profits for the utility companies.
Summary & Conclusion
With the transition to renewable power generation now in full-swing, the typically stodgy-old Utility Sector has become rather exciting in my opinion. New opportunities in wind, solar, and battery backup – combined with a big tailwind from the government’s Infrastructure Act and the EV transition – means the electric power generation and transmission companies have a bright and growing future that likely will only accelerate over the coming years. However, the VPU ETF appears to be fully valued at this point, so I rate it a HOLD. Meantime, investors considering an allocation into utilities should also consider the XLU ETF as well, which I consider to be a tad better than VPU due to its larger allocation to the leading utility company in the U.S.: NextEra Energy. Investors should also be patient and consider using current market volatility to scale-in at lower entry points. For example, VPU at, say, ~$145 and XLU at ~$65. After all, the utility sector is currently trading at a near market multiple, when it traditionally trades with a far lower valuation.
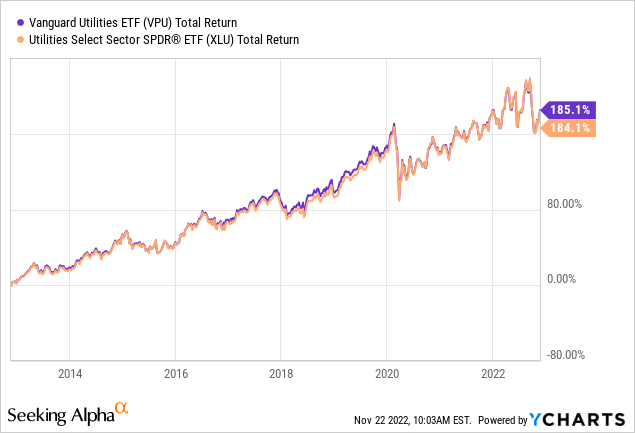
I’ll end with a 10-year total returns comparison of VPU versus XLU and note their returns are virtually identical:
Be the first to comment