

Natali_Mis/iStock via Getty Images
Quality is more important than quantity. One home run is much better than two doubles. – Steve Jobs
Introduction
If you’re well-versed with the ecosystem of The Lead-Lag Report, you’d note that one of my pivotal Intermarket risk signals – the utilities signal – switched to risk-on mode for the first time since Valentine’s Day, which would likely imply the onset of bullish momentum. I also feel that the level of negative sentiment that has enveloped the markets in recent weeks has gone a bit overboard. For instance, consider what the top brass and C-suite executives have been saying. Traditionally, these are guys who almost always try to paper over the cracks and sound bullish even in the face of the most adverse circumstances, but a recent survey showed that 6 out of 10 CEOs now believe that a recession is imminent.
Twitter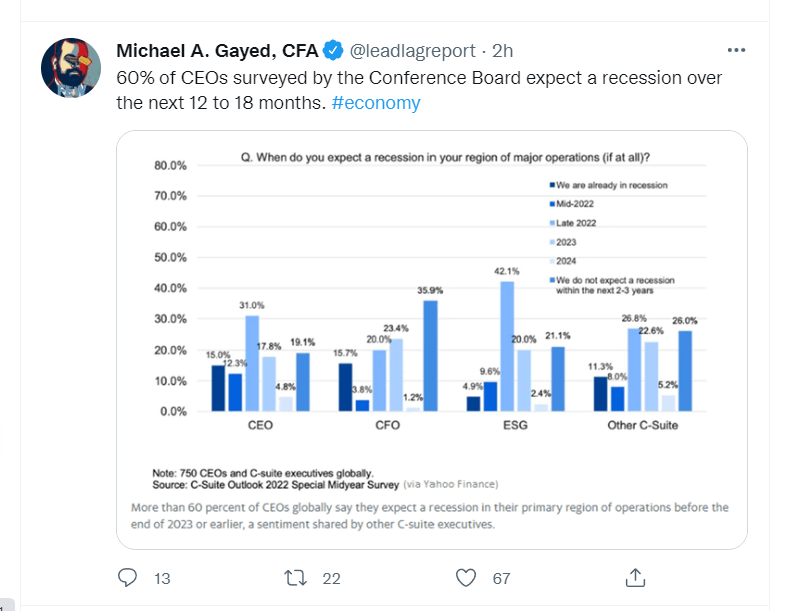
Regardless, it would pay to follow that old adage of “being greedy when others are fearful” as I suspect we may see a relief rally soon enough. Speaking of relief rallies, if you were looking for ideas on what could potentially work, note that I recently engaged in a productive discussion with Jeremy Schwartz via Twitter Spaces.
Twitter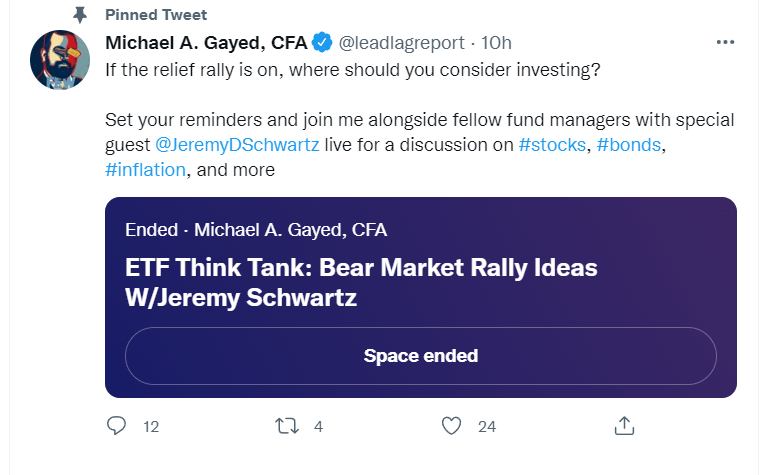
Why VFQY?
If you’ve missed out on that discussion, here’s one lesser-known product that I think may be worth looking at – The Vanguard U.S. Quality Factor ETF (BATS:VFQY). What about it?
Well, as the name suggests, this is a fund that focuses on 700 odd U.S. stocks that screen highly when a quality factor is incorporated. In other words, you’re looking at stocks with strong fundamental characteristics, or those exhibiting strong profitability and healthy balance sheets. I also want to add that this is an actively managed product where the fund manager is guided by a rules-based quantitative model. Interestingly, for an actively managed ETF, I must admit that the expense ratio of 0.13% comes across as quite cheap, but then again, this is a Vanguard product we’re talking about, and they’re pretty well-known for their low-cost expertise.
What metrics are used to determine quality in VFQY’s case? There are four separate metrics; ROEs, gross profitability, changes in net operating assets, and leverage. Gauging prospective stocks by using some of these scanners is of particular interest to me, given the environment we are in. High inflation will likely test these companies’ abilities to pass it on to the end customer and this will be reflected in the profitability rankings. The ROE metric too is key, as it will pick out a bunch of stocks that can meet higher return thresholds for equity holders, particularly in an environment where the cost of equity has recently gone up. You also don’t want to get bogged down with companies that are overly financially levered in an environment where the Fed runs the risk of not ensuring a soft landing with the aggressive nature of its rate hikes. VFQY’s leverage screener should be useful in that regard.
Given the presence of this leverage screener, some of you may be wondering if this portfolio then avoids financial stocks as they will likely screen quite poorly on the leverage metric? VFQY mitigates this challenge by only using the ROE screener and share issuances.
I also like the fact that VFQY is rather well-diversified, offering you adequate exposure to different buckets of market-cap; 48% of the portfolio is oriented towards the large-cap segment, 27% is oriented towards the mid-cap segment, 21% is oriented towards the small-cap segment and the rest comes from micro-cap stocks. Besides it’s not top-heavy with the top-10 stocks only accounting for 11% of the total portfolio.
As far as sectors go, the largest weight is taken up by the technology sector at 19%; as mentioned in the Leaders/Laggers section of this week’s report, I suspect the oversold tech sector could end up as one of the prime leaders if a potential oversold rally were to come through.
VFQY is not without its faults; it has not gotten an awful lot of publicity since its inception, and this is reflected in a fairly humdrum AUM (assets under management) of $115m; this can also be exemplified by rather wide spreads of $0.13.
Conclusion
Twitter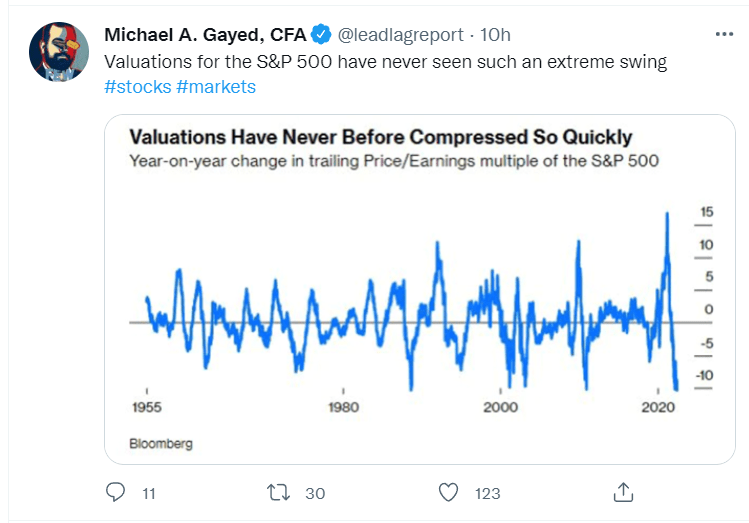
Followers of The Lead-Lag Report Twitter account may have noticed that I recently shared an image highlighting how the S&P500’s valuations had collapsed with great alacrity, so much so that, according to YCharts, you can currently pick up the SPY at a P/E multiple of 18.1x (around a year ago this was closer to the 25x levels). Well, if you thought an 18x multiple was accessible enough, do consider that a quality-focused portfolio such as VFQY, is available at even cheaper multiples of just 14x. What makes this even more of a bargain is the long-term earnings potential on offer; YCharts estimates have pegged the 5-year earnings growth trajectory at 16%, better than what’s on offer with the S&P500 (14.4%).
 Anticipate Crashes, Corrections, and Bear Markets
Sometimes, you might not realize your biggest portfolio risks until it’s too late.
That’s why it’s important to pay attention to the right market data, analysis, and insights on a daily basis. Being a passive investor puts you at unnecessary risk. When you stay informed on key signals and indicators, you’ll take control of your financial future.
My award-winning market research gives you everything you need to know each day, so you can be ready to act when it matters most.
Click here to gain access and try the Lead-Lag Report FREE for 14 days.
Be the first to comment