

sefa ozel
As overly simple as the idea may at first sound, you can build a very good stock portfolio simply by focusing on a handful of good names with high brand value. As a value-oriented investor, I long shunned this as an unprofessional way to build a portfolio, since stocks with better brand names would of course be better known, and so likely trade at higher valuation multiples, which would likely make their future returns lower than those of more “obscure” stocks. As I’ve continued to invest and learn over the years, I’ve come to appreciate that portfolios that simply buy a dozen or so “brand name” stocks with good fundamentals probably aren’t missing much, if anything, by leaving out the obscure stocks. In fact, what I’ve seen in several real life portfolios, and provide a sample of in this article, is that a simple portfolio of 12-15 “high brand value” stocks is likely to do “OK”, even in our sample where several of those names experienced significant declines. With some fundamental quality controls and a bit of luck, such a portfolio can just as easily outperform a broader portfolio diversified across thousands of more obscure names.
In this article, I wanted to run through the returns of a portfolio starting with the 15 most valuable brands from 15 years ago, plus a few tweaks on the strategy centered around a single rebalancing in 2014, including a rebalance that replaces 5 declining brands from our 2007 list with 5 new top brands from 2014. I compare the returns of these strategies with those of a popular benchmark: the Vanguard Total Stock Market ETF (NYSEARCA:VTI). Of the 20 stocks we look at in this article, 16 are US companies that together make up 21.5% of VTI’s current weight. I also believe brand value is a MAJOR reason why four of these names have become the top four components of VTI, with 16.2% of VTI now allocated to just those four names, and those four names have clearly driven much of VTI’s returns and the outperformance of the brand portfolios that included them.
A brief summary of my results:
- Simply buying and holding 2007’s top 15 “brand stocks” from 2007-2002 would have underperformed VTI by 0.5%/year without rebalancing, or by 1.2%/year with a rebalance in 2014.
- Buying and holding the 12 of 2007’s top 15 brands that were non-financials from 2007-2022 would have outperformed VTI by 0.8%/year without rebalancing, versus outperforming by only 0.5%/year with a 2014 rebalance.
- Owning 2007’s top 15 brands from 2007-2014, then rebalancing by replacing the five least valuable brands with five new top brands from 2014-2022, would have outperformed VTI by 0.6%/year.
- Owning 2007’s top 12 non-financial brands from 2007-2014, then rebalancing by replacing the five least valuable brands with five new top brands from 2014-2022, would have outperformed VTI by 2.5%/year.
- Although my sample was small, the strong outperformance of the strategies that replace declining brands with rising brands over the portfolios that don’t indicate that “brand value momentum” is at least as important as brand value as a factor driving returns.
My first takeaway lesson is that “big brand name” stocks do not seem to have a tendency to outperform the market just because of their big brands. That said, holding a diversified enough handful of “high brand value” stocks, say 12-15 across different sectors, seems to do a good enough job at avoiding significant underperformance, even over a period when US total stock market funds have seemed especially hard to beat.
One observation that also surprised me when thinking about this article was that as obvious as the idea of focusing on stocks with high brand value or brand momentum may be, there seem to be very few funds focused on such portfolios. The only US-listed ETF I found that focused on brand value was one that used to have the ticker “BVAL” and was reviewed in this 2018 article, but that ETF closed in 2020. I couldn’t find performance data on this ETF, but I would guess it closed more because it couldn’t raise enough assets from interested buyers than because stocks with brand value lag the market by that much. That could be seen as somewhat encouraging to those of us who want to incorporate brand value and brand momentum as investment factors, seeing that those factors might not be as “crowded” as I would have expected.
My Methodology
For this article, I started with this list of the world’s most valuable brands, which needed to not only include what the most valuable brands are now, but what the rankings for several years, in this case every year back to 2007. Starting with the 2007 list of that year’s most valuable brands, I look at how the stocks owning each of the top 15 of those brands performed over the following 15 years, breaking up this performance period roughly in half in 2014. I then consider what would have changed if, in 2014, we dropped the five names from our 2007 list that had the lowest rankings in 2014, and replaced them with the top five brand names in the 2014 list that weren’t in our 2007 list. I compare the 2007-2014 returns of the first 15 stocks, and the 2014-2022 returns of all 20 stocks (adding the 5 “replacement” stocks we switch into in 2014), against those of a few benchmark ETFs selected and explained below. Since I am writing this article in July and see the 2022 rankings are already there, I run the 2007-2014 returns and returns since 2014 from and to July 1st of each year.
This is a very long article I could not think of a good way to shorten, so please feel free to skip ahead to the conclusion at the end and refer back to any of the 20 stocks’ individual sections whose data interests you.
The “Most Valuable Brands” Lists
Here is our starting ranking of the most valuable brands of 2007, and what the values and rankings of those brands were in 2014 and 2022.
| Brand | 2007 Rank | 2007 Value | 2014 Rank | 2014 Value | 2022 Rank | 2022 Value |
| Coca-Cola | 1 | $ 43,146 | 12 | $ 33,722 | 44 | $ 35,379 |
| Microsoft | 2 | $ 37,074 | 4 | $ 62,783 | 4 | $ 184,245 |
| Citi | 3 | $ 35,148 | 24 | $ 24,518 | 45 | $ 34,443 |
| Walmart | 4 | $ 34,898 | 9 | $ 44,779 | 5 | $ 111,918 |
| IBM | 5 | $ 34,074 | 10 | $ 41,514 | 89 | $ 21,383 |
| HSBC | 6 | $ 33,495 | 20 | $ 26,870 | 109 | |
| General Electric | 7 | $ 31,850 | 6 | $ 52,533 | 95 | $ 19,725 |
| Bank of America | 8 | $ 31,426 | 21 | $ 26,683 | 41 | $ 36,719 |
| Hewlett-Packard | 9 | $ 29,445 | 45 | $ 19,824 | 194 | |
| Marlboro | 10 | $ 26,990 | 81 | $ 13,476 | 42 | $ 36,278 |
| Vodafone | 11 | $ 26,752 | 16 | $ 29,612 | 98 | $ 19,506 |
| Gillette | 12 | $ 26,649 | 138 | 318 | ||
| Intel | 13 | $ 25,095 | 29 | $ 22,940 | 69 | $ 25,612 |
| L’Oreal | 14 | $ 25,050 | 108 | 173 | ||
| 15 | $ 24,687 | 3 | $ 68,620 | 3 | $ 263,425 |
Source: https://brandirectory.com/rankings/global/2007
When we look at the leaderboard of the top 10 brands in 2014, we see that five names from our 2007 top 15 list made this top 10 list, plus we see five new names.
| Brand | 2014 Rank | 2014 Brand Value ($M) | In 2007 Top 15? |
| Apple | 1 | $ 104,680 | No |
| Samsung Group | 2 | $ 78,752 | No |
| 3 | $ 68,620 | Yes | |
| Microsoft | 4 | $ 62,783 | Yes |
| Verizon | 5 | $ 53,466 | No |
| General Electric | 6 | $ 52,533 | Yes |
| AT&T | 7 | $ 45,410 | No |
| Amazon | 8 | $ 45,147 | No |
| Walmart | 9 | $ 44,779 | Yes |
| IBM | 10 | $ 41,514 | Yes |
Source: https://brandirectory.com/rankings/global/2014
A
Some Benchmarks and Benchmark Data
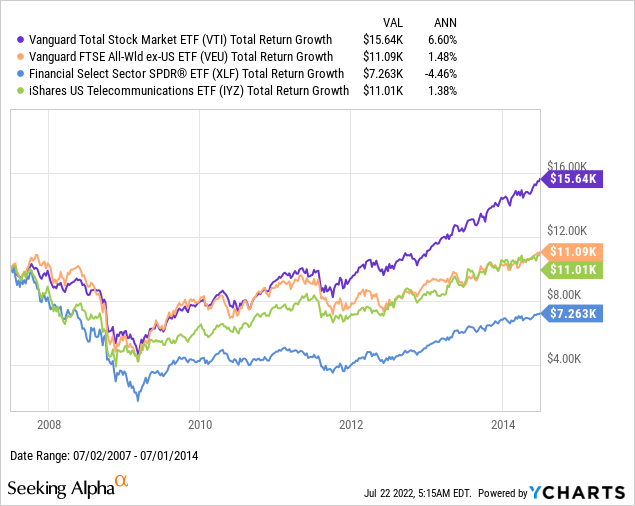
In addition to VTI, I also wanted to run the returns of three other benchmarks specific to the foreign stocks, financial stocks, and telecom stocks in our sample:
- For foreign / international stocks: the Vanguard FTSE All-World ex-US ETF (VEU)
- For financials / banks: the Financial Select Sector SPDR ETF (XLF), and
- For telecommunications carriers: the iShares U.S. Telecommunications ETF (IYZ)
One reason I am focusing on VTI as the “main” benchmark is that 16 of the 20 brand names in this article are American brands, and I believe the relative strength of US brands over non-US brands over the past decade has been a major factor in VTI’s outperformance over VEU. My two favorite foreign brands on the above list, L’Oreal and Samsung, both significantly outperformed VEU and had returns closer to VTI, perhaps because they captured this “brand value” factor, and so VTI is a “tough but fair” benchmark even for these foreign names.
I also thought it was important to run the returns for the financial and telecom sectors because the three banks (Citi, HSBC, and Bank of America), and the three telecoms (Vodafone, Verizon, and AT&T), are brands and businesses I think should be evaluated very differently than a consumer products or technology. The underperformance of these six names is partly explained by the poor performance of their respective sector benchmarks, but also because brand value is monetized differently for Citi or Verizon than it is for Coca-Cola or Marlboro.
Here are the returns of these benchmark ETFs from 2007-2014:
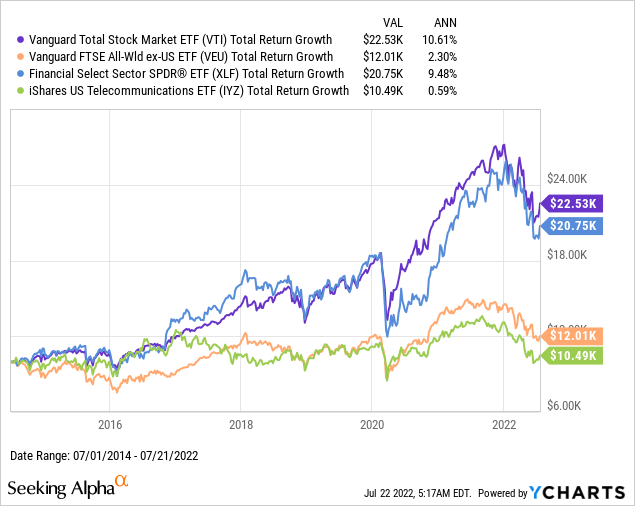
From 2014-2022, the US outperformance over foreign stocks and the telecom sector continued, but the big turnaround was in financials, whose returns over the past eight years have been almost as strong as those of the overall US market.
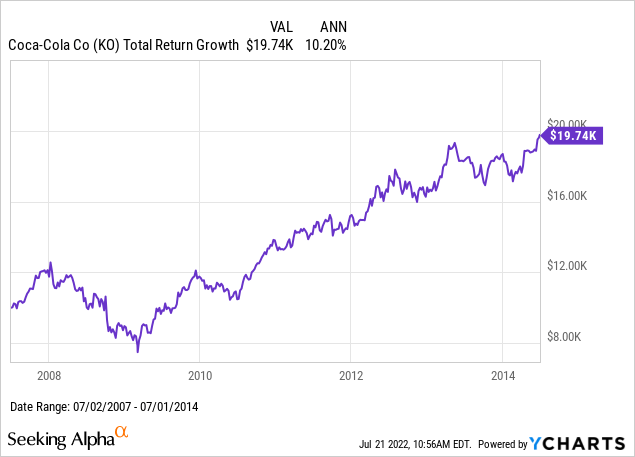
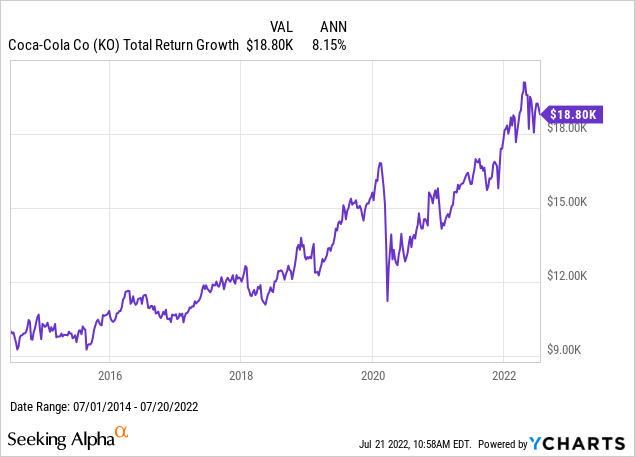
1. Coca-Cola (now 0.64% of VTI)
The Coca-Cola Company (KO) owns what was in 2007 still the most valuable brand in the world according to the list we’re using. Coca-Cola is also well known as the “textbook” example of one of Warren Buffett’s great investments, where he saw Coca-Cola’s brand value as a major asset other investors must have been overlooking in the late 1980s. KO shares then experienced a lost decade between the mid-1990s and mid-2000s, so one reason KO shares slightly outperformed VTI over our study period was likely do to my unfortunate timing of starting this study right at the end of that lost decade period.
From 2007 to 2014, KO shares would have almost doubled your money.
Since 2014, KO has continued to deliver steady returns, but at a slower pace, and over this period, the 8.2% from KO was less than the 10.6% from VTI.
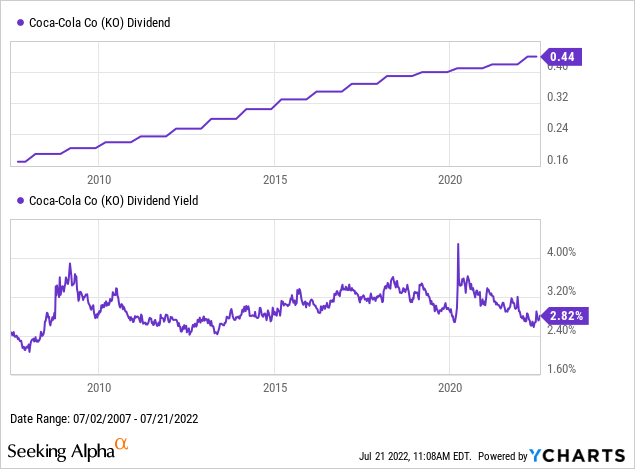
The slowing rate of return on KO shares might best be summarized by its slowing rate of dividend growth, as KO’s dividend yield has been relatively steady over time. I have written that the future of KO’s dividend depends on whether it can continue to find profitable growth, versus how much longer KO will continue relying on borrowing money for buybacks to prop up its per-share numbers.
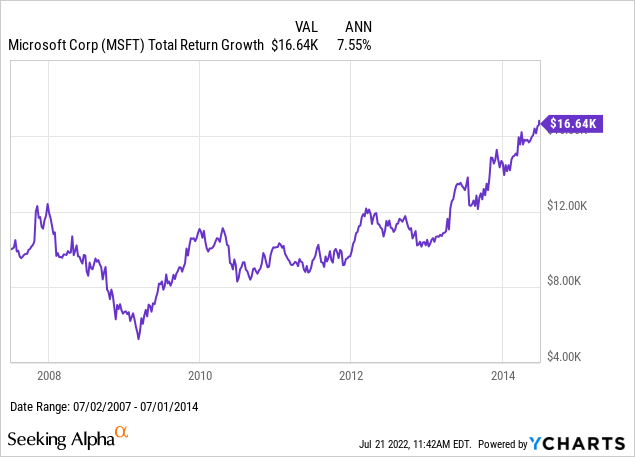
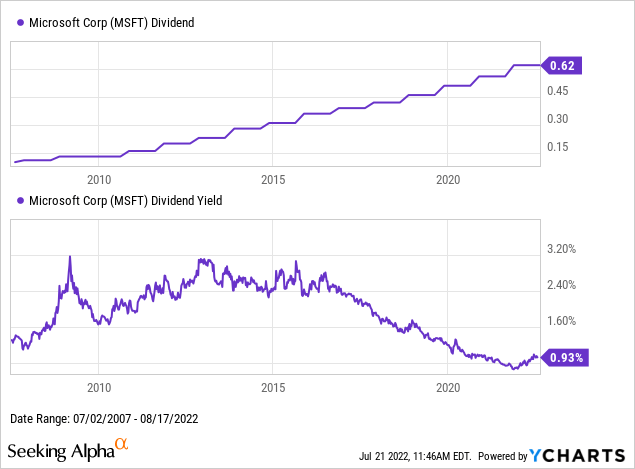
2. Microsoft (now 5.05% of VTI)
In Big Picture Growth & Income, I have often referred to Microsoft Corp. (MSFT) in 2010 as an ideal example of what I look for in a good growth stock. In other words, when I say I want to invest in “the next Microsoft”, I MSFT as it was in 2010, not as it was in 1980. By 2010, Microsoft was already a dominant global brand that still seemed to have almost no competition in desktop software, where Windows and Office were just its two best known cash cows. I am still amazed thinking I could have bought MSFT at 11x trailing earnings in 2010, which is a multiple that basically implied zero to negative future earnings growth. What we then saw over the next decade was that Microsoft not only managed to keep growing, but actually grew at an even faster rate in the 2010s than in the 2020s, as we saw reflected in its strong stock performance.
From 2007-2014, MSFT shares returned “only” about 1%/year more than VTI.
It was from 2014 through the present that an investment in MSFT would have grown more than seven-fold.
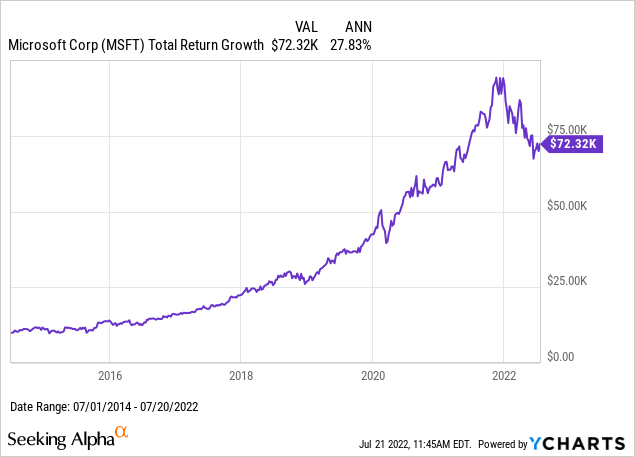
The fundamental driver behind MSFT’s returns is that Microsoft’s business has continued to grow strongly, especially in the cloud, but an equally significant tailwind in the 2014-2022 stock return has been from multiple expansion. In the below chart, we see MSFT’s dividend yield has fallen from over 2.4% in 2014 to under 1% today. This multiple expansion effect is why I don’t expect MSFT’s 2014-2022 return pattern to repeat.
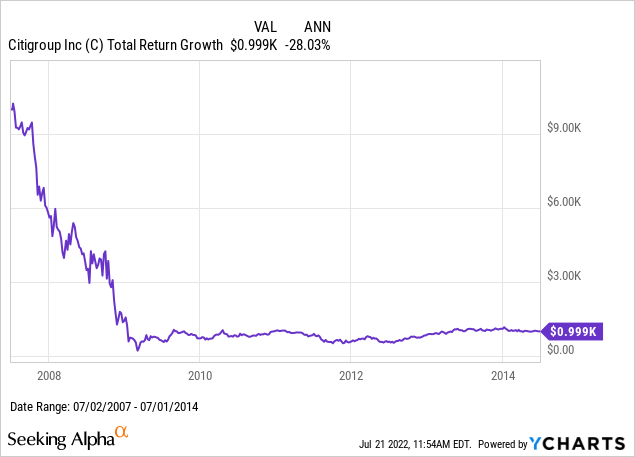
3. Citi (now 0.22% of VTI)
The first “big loser” we come across from the 2007 list of top brands is Citigroup Inc. (C), whose -90% return during the 2007-2009 financial crisis should be a major example for why investors, especially those who work for highly leveraged public companies, like to diversify. After bottoming out in 2009, C shares didn’t recover much through 2014, and Citi barely avoided being cut from my 2014 rebalance because five other names (HP, Marlboro, Gillette, Intel, and L’Oreal) managed to fall even further by the 2014 brand rankings.
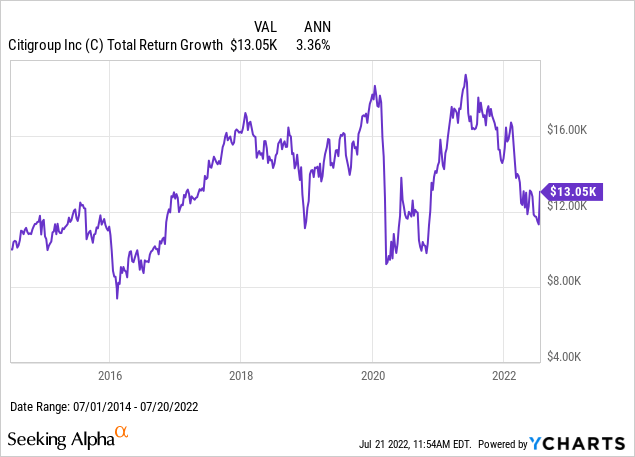
C shares have recovered a bit since 2014, but have performed relatively poorly when compared with XLF’s 9.5%/year over this period. These returns happen to be slightly higher than those of VEU over this period, which might be a factor given how international Citigroup’s business is, but that’s unlikely to satisfy most US-based investors.
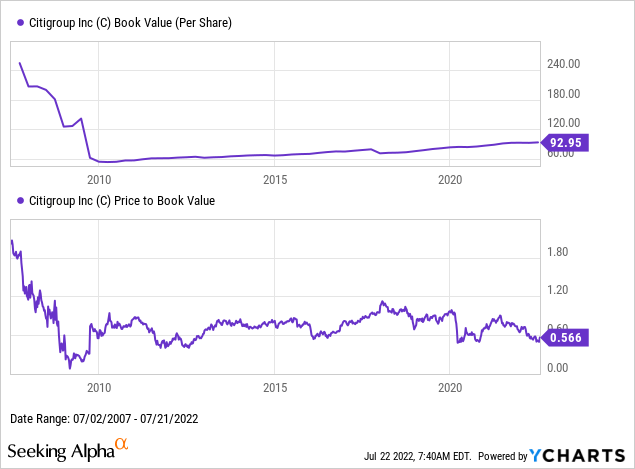
The obvious driver of Citi’s 90% decline were the massive write-downs and loan losses from the 2008-2009 credit crisis, which destroyed over 2/3 of C’s book value over that period. Just as multiple expansion boosted MSFT returns, multiple contraction multiplied the negative returns for C shares, which went from trading at over 1.8x book when Citi was a top brand to less than 0.6x book today, even after years of the book value slowly recovering.
4. Walmart (now 0.44% of VTI)
Retail giant Walmart Inc. (WMT) has charts that in many ways rhyme with those of KO above. First, we see that WMT shares outperformed VTI from 2007-2014:
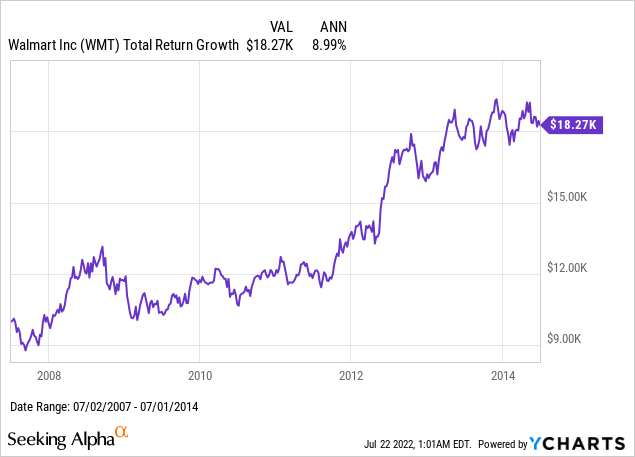
Then we see WMT lagged VTI by about 1%/year from 2014-2022, even though WMT’s absolute rate of return was slightly higher over this period:
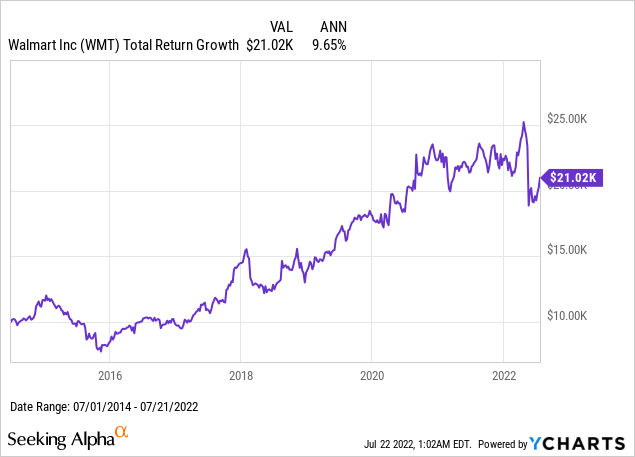
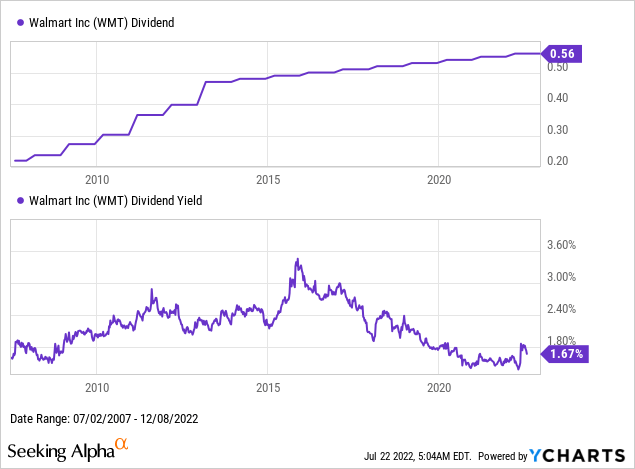
Similar to the case of KO, we see that WMT delivered significantly higher dividend growth before 2014 than it has since 2014. Since 2013, WMT has been raising its quarterly dividend by only one penny per year, which some might say looks a trick to maintain its 48 year track record of dividend growth, rather than a sign of sustainable organic growth. WMT’s strong returns since 2014 seem to be due more to the market bidding its dividend yield down from over 2.4% to below 1.8% than from underlying growth.
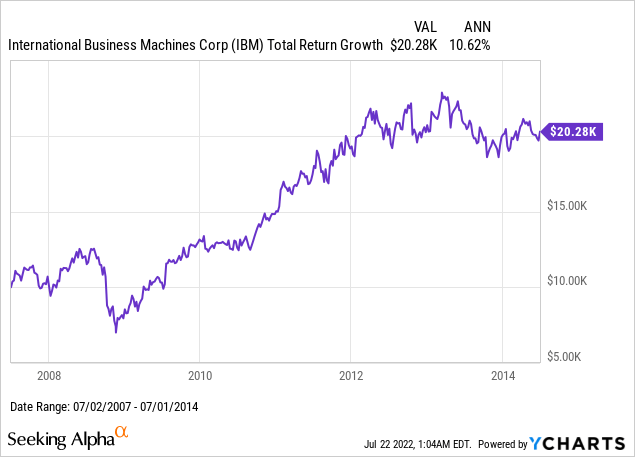
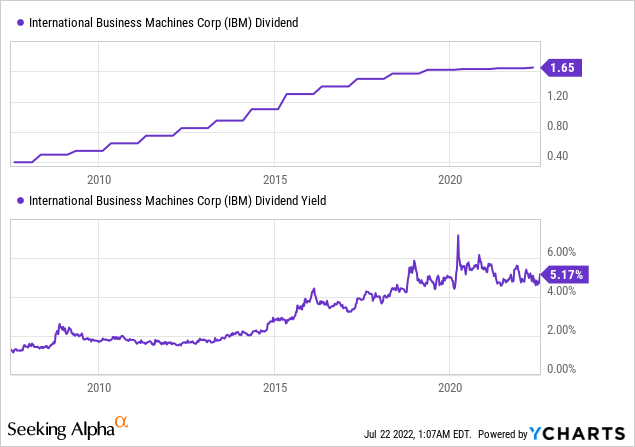
5. IBM (now 0.33% of VTI)
International Business Machines (IBM) is one of the names I was surprised to see ranked as a top 5 brand in 2007, and I was just as surprised to see it still ranking #10 in 2014. Like MSFT, IBM was also trading around 11x earnings in 2010, but the paths of these two stocks since then has clearly been quite different.
From 2007-2014, IBM outperformed not just VTI, but IBM also outperformed MSFT.
Since 2014, however, the total return from IBM shares, with all dividends reinvested, has been roughly zero, but with plenty of volatility.
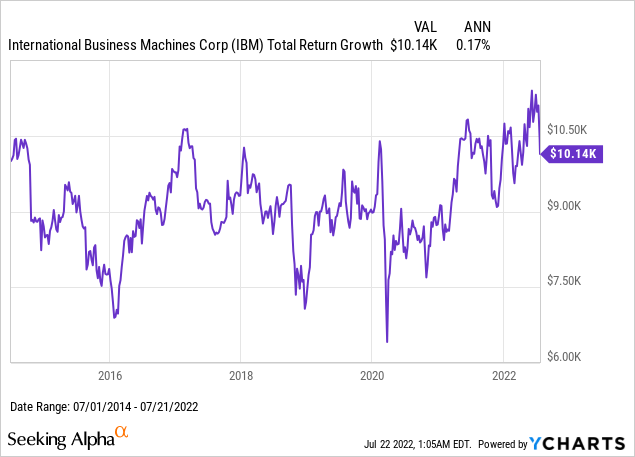
Like KO and WMT, IBM has been a steady dividend grower, and only reduced the annual increase in its quarterly dividend to one penny since 2020. The poor performance of IBM shares since 2014 is entirely explained by the rise in its yield from under 2% to over 5% over the past 8 years.
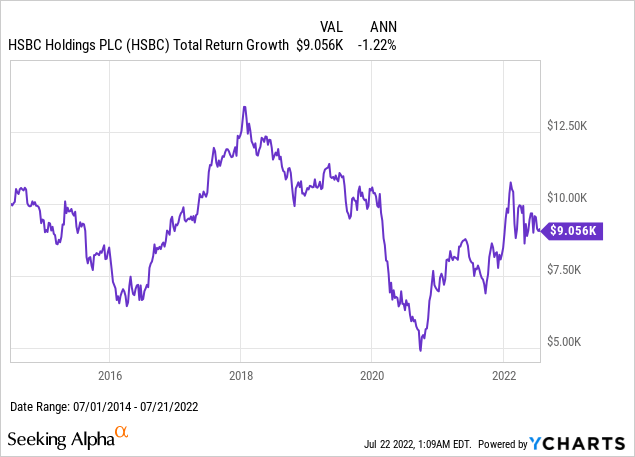
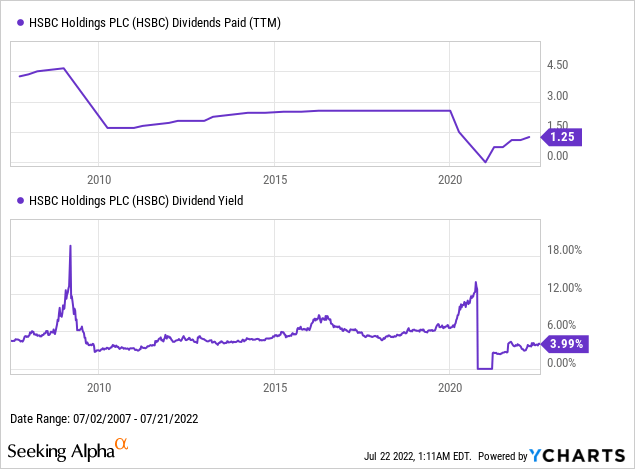
6. HSBC
The Hongkong and Shanghai Banking Corporation (HSBC) is a brand I became especially familiar with over most of this article’s focus period because I lived in Hong Kong from 2009-2021, and HSBC is still THE dominant Hong Kong brand. After HSBC stopped calling itself “The World’s Local Bank”, I highlighted how heavily HSBC relied on the Hong Kong market specifically, and while that may have kept it from losing as much as Citi or Bank of America during the 2008-2009 mortgage crisis, it still left long-term shareholders poorer since.
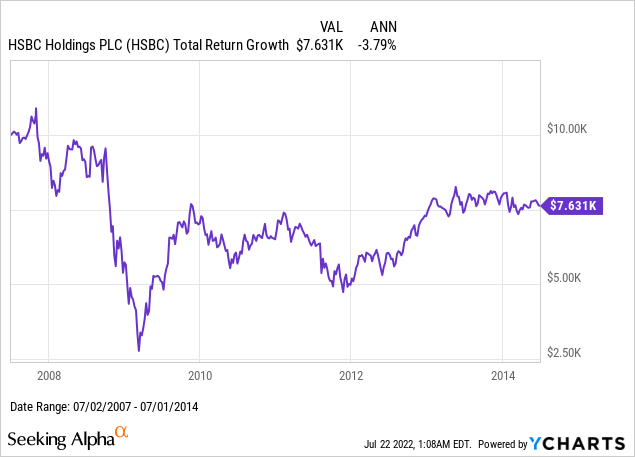
Unlike Citi, HSBC shares haven’t recovered since 2014, and have continued averaging negative returns over the years.
While YCharts has some irregular data on HSBC’s book value history, HSBC’s dividend history is just as good a denominator to track how this bank has created (or destroyed) shareholder value over time. While HSBC wasn’t alone among banks cutting its dividend in 2008 and 2009, I wrote in 2020 that HSBC’s dividend cut that year was a clear sign that this was not a high quality bank, at least not for shareholders.
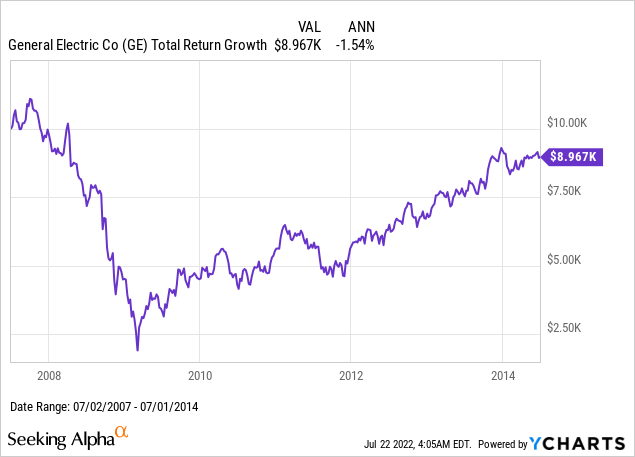
7. General Electric (now 0.18% of VTI)
General Electric (GE) is a name I was not surprised to see rank as the 7th most valuable brand in 2007, but I was surprised to see actually move up to #6 by 2014. 2014 was still four years before GE’s 2018 removal from its longest-held place in the Dow Jones Industrial Average, but already five years after its shares fell over 75% in the 2008-2009 credit crash, in a sign that GE probably had more in common with banks than with AAA-rated products companies. S&P downgraded GE from AAA to AA+ in 2009, and since then, GE’s credit rating has fallen to BBB+. One great quote I heard but haven’t been able to find again is that “GE’s problem is that it became a leveraged hedge fund that just happened to still make aircraft engines and light bulbs”.
The preservation of GE’s brand ranking was probably correlated to the recovery in its stock price from 2009 to 2014:
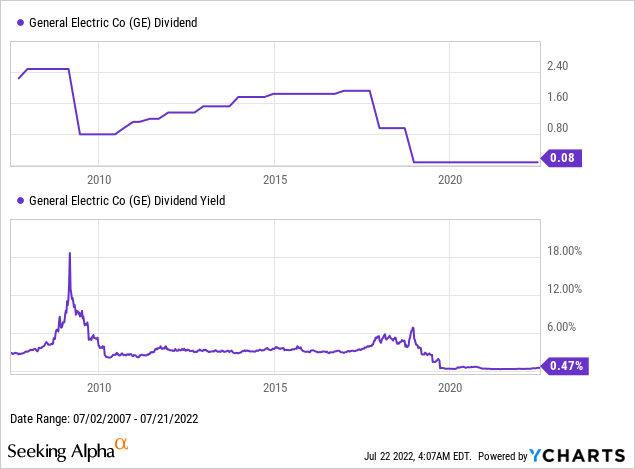
Since 2014, however, GE has been the worst performing stock of any of the 20 in this article.
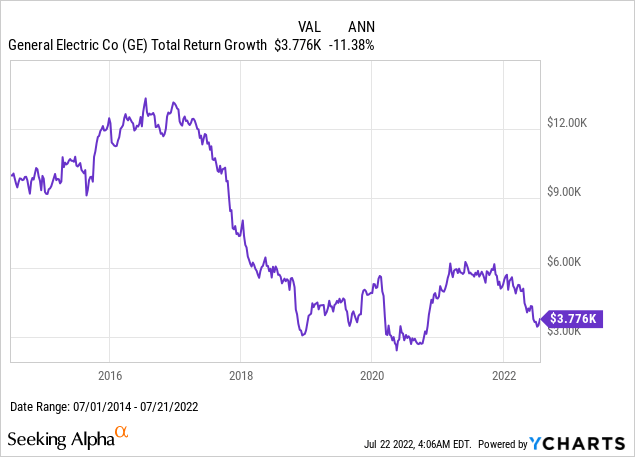
The fall of GE can be largely tracked by the decline in its dividend since 2007. Although I’m sure someone smarter than me can find value in this company long before resumed dividend increases come into view, I’ve yet to regret not buying a stock that cut its dividend from over $2/quarter to only 8 cents per quarter, with no clear path for that dividend to get back to $2/quarter.
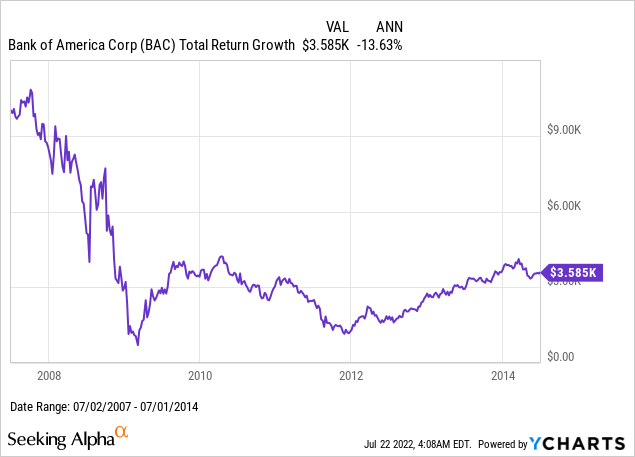
8. Bank of America (now 0.56% of VTI)
The third and final bank stock in this article is Bank of America Corp. (BAC), which like C saw a massive decline in the 2008-2009 crash that it still hadn’t recovered from by 2014:
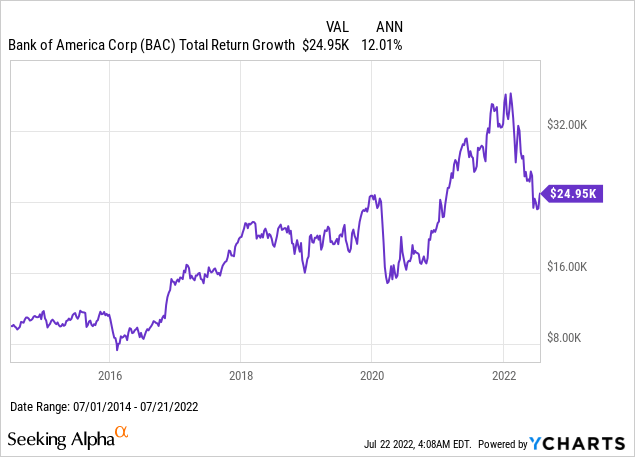
Since 2014, however, BAC shares outperformed not only XLF, but lead VTI by 1.4%/year, even through the correction of early 2022.
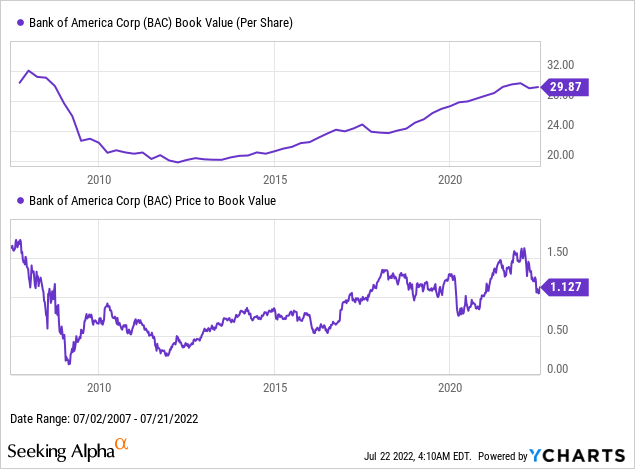
BAC’s relatively strong performance among financials is one I see best explained by its strong recovery of its book value, which fell less than Citi’s during the credit crunch, and has almost recovered to 2007 levels by 2022. This is boosted by BAC shares also trading back above book value, even if not at the same high multiples as in 2007 or late 2021. Although I tend to be more skeptical about how much a bank’s brand translates into strong dividend or book value growth, I do believe a strong brand is correlated with a bank stock trading at higher multiples to book value, so I agree that BAC’s brand should now be worth more than C’s brand by this metric.
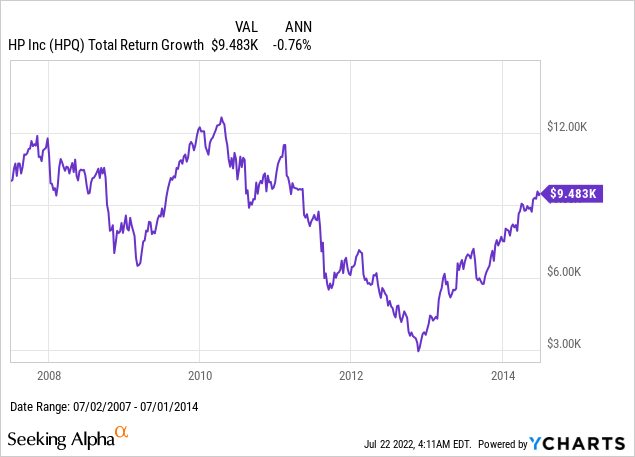
9. Hewlett-Packard (now 0.08% of VTI)
The company founded by Bill Hewlett and David Packard and now known as HP Inc. (HPQ), has been through a lot this century with its 2001-2002 merger with Compaq, which changed its ticker from “HWP” to “HPQ”, and the 2017 spin-off of HP Enterprises, which to keep things simple I will ignore here. As with the other 14 top brand stocks from 2007, this first chart is of HPQ’s total return from 2007 to 2014:
After those seven painful years, it seems that HPQ shareholders who held on were rewarded with returns 3%/year in excess of VTI’s since 2014. Of the five names whose brand values fell the most from 2007 to 2014, this is the one whose stock performance was the strongest over the eight years since.
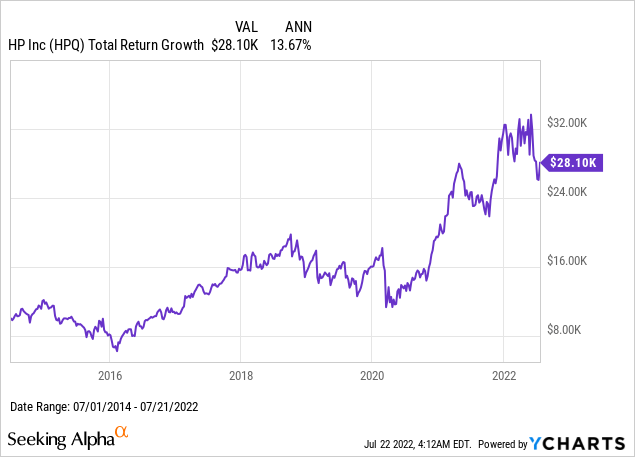
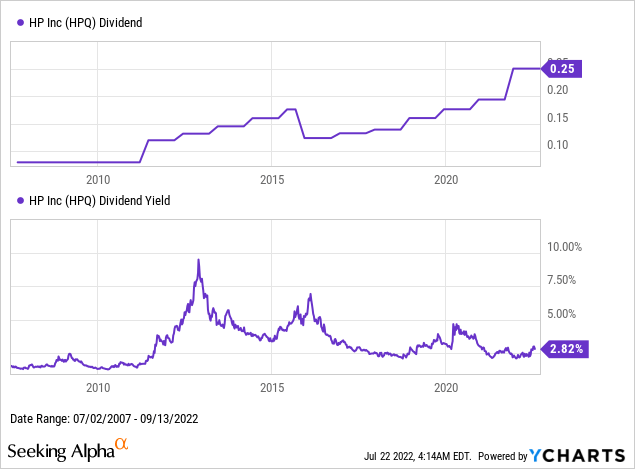
The decline in HPQ shares that led to the great buying opportunity in 2014 might seem like a bit of a mystery with the hindsight of this chart, as 2014 seemed to be several years into an era of strong dividend growth. While there did seem to be a dividend cut in 2015-2016, dividend increases seemed to resume soon after, and shareholders were further rewarded as the market has been bidding down the yield.
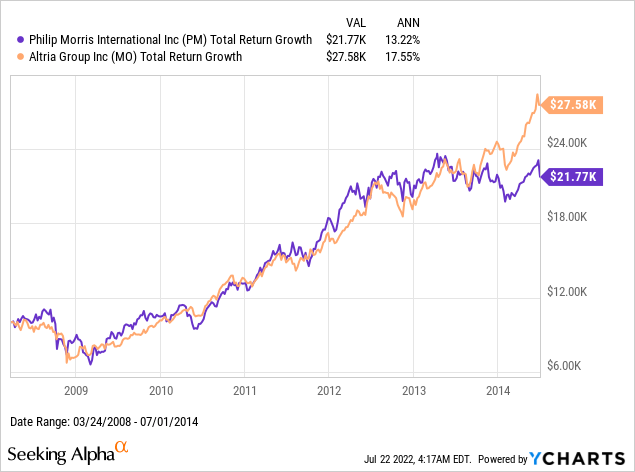
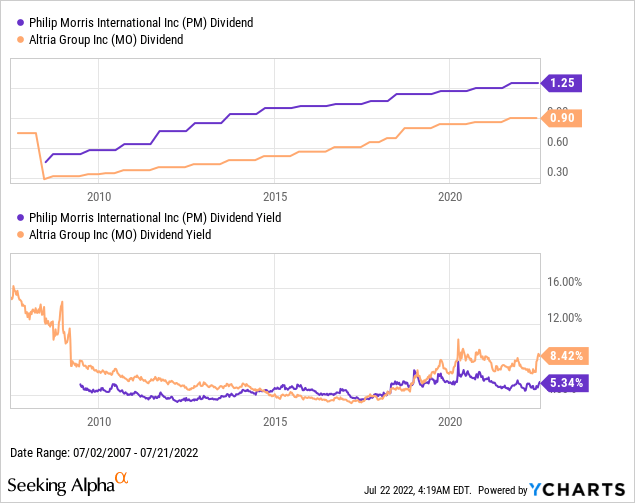
10. Marlboro, a brand of Philip Morris (0.4% of VTI) and Altria (0.2% of VTI)
Marlboro is a top global brand I have known and seen everywhere since I was very young, and while I can understand its brand value declining as younger generations smoke less and switch to e-cigarettes, I was surprised to see it rank below names like HP or Bank of America in 2014. Marlboro is marketed by Altria Group Inc. (MO) in the United States, and by Philip Morris International Inc. (PM) outside the US, and while I continue to own both and chart both below, I use PM in my calculations to err on the conservative side. I last covered PM in this 2021 article.
From 2007-2014, both PM and MO returned very well, though MO pulled significantly further ahead in late 2013 and early 2014.
The returns of both PM and MO have been far more muted since 2014, in line with the decline in Marlboro’s brand value, but would still fall within the “not too bad” range.
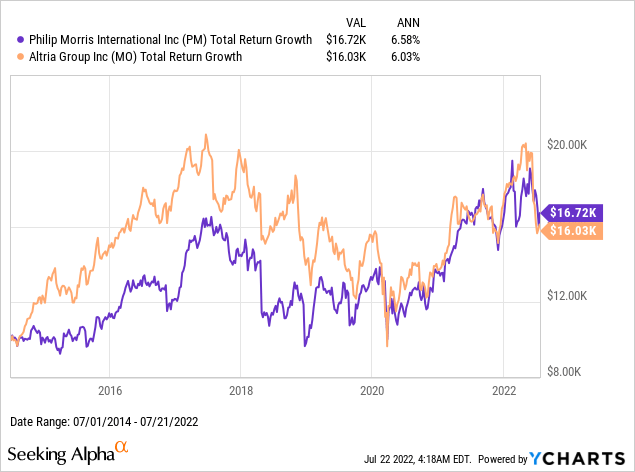
Both PM and MO continue to be very strong dividend growers, with the latest increases in their quarterly dividends being 5 cents and 4 cents respectively, not the penny increases we saw with WMT and IBM. The recent lagging performance in these shares seems largely due to the market offering up the yield, in other words, accepting lower prices for every dollar of dividends.
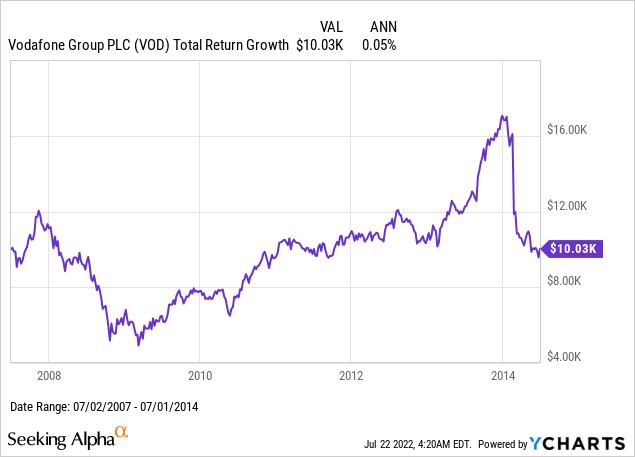
11. Vodafone
British telecommunications provider Vodafone (VOD) was the only telecommunications company in our 2007 top 15 list, and I was surprised to see it only fell to #16 by 2014, when it was surpassed by Verizon and AT&T as brands in this space.
From 2007 to 2014, VOD shares returns were “just about zero”.
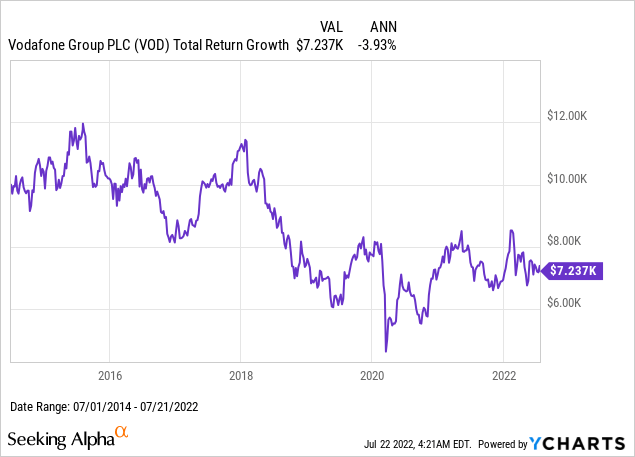
Since 2014, VOD shares went on a steeper decline, and even with dividends reinvested, leave shareholders with only 72 cents of every dollar invested in 2014.
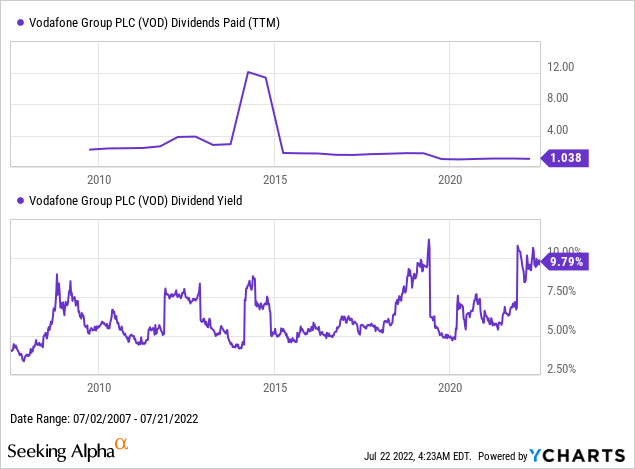
As with many other brand name dividend paying stocks, the trend in VOD’s business value can be tracked by the rise and fall of its dividend. VOD’s annual dividend was cut to EUR 0.09 per ordinary share from around EUR 0.14 in 2020, but the lack of any monetization of its brand value into dividend growth was something clearly visible even a decade ago. This goes down as another example of why a stock portfolio construction strategy based on top brands can be enhanced with a simple screen on dividend quality.
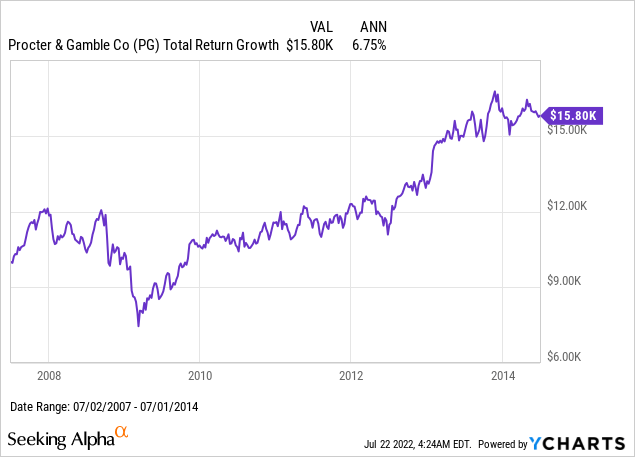
12. Gillette, a brand of P&G (0.91% of VTI)
Gillette, like Coca-Cola, is a brand that Warren Buffett made a famously profitable investment in, and it is perhaps fortunate for this article that Gillette was acquired by Procter & Gamble (PG) in 2005, two years before my source for brand rankings began. Although PG owns many brands other than Gillette, PG is the stock I will put in the 2007 brand portfolio for this article.
PG’s total return almost exactly matched that of VTI’s over the 2007-2014 period…
… and again over the 2014-2022, with amazing precision.
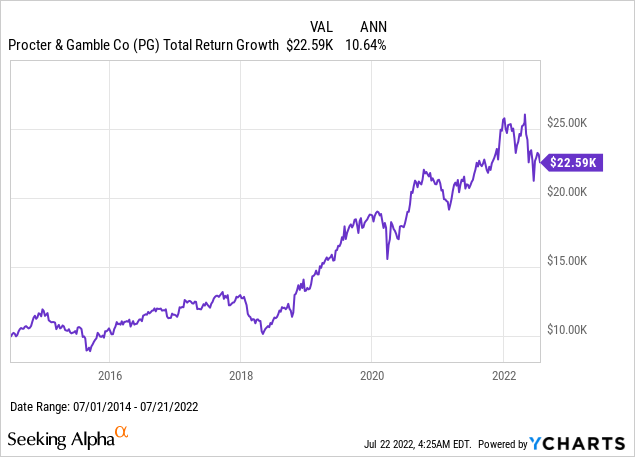
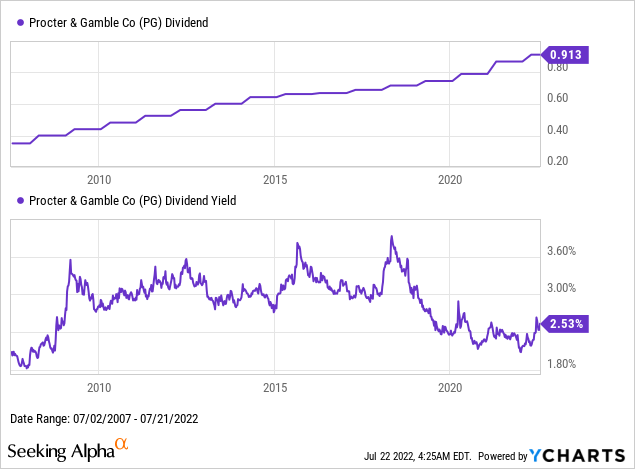
PG’s dividend growth seemed to be slowing down a bit around 2015-2016, but dividend increases have accelerated again since 2019, the latest increase in its quarterly dividend being by over 4 cents per share. The acceleration in PG’s total rate of return in recent years compared with the earlier years seems due to yield compression, as we’ve tended to see with earlier stocks of strong brands. What looks like an exception in this article is that Gillette seems to be the single biggest decliner in brand value ranking from 2007 to 2014, and then falling all the way to #318 in 2022, showing that most of PG’s performance comes from its other brands and not Gillette.
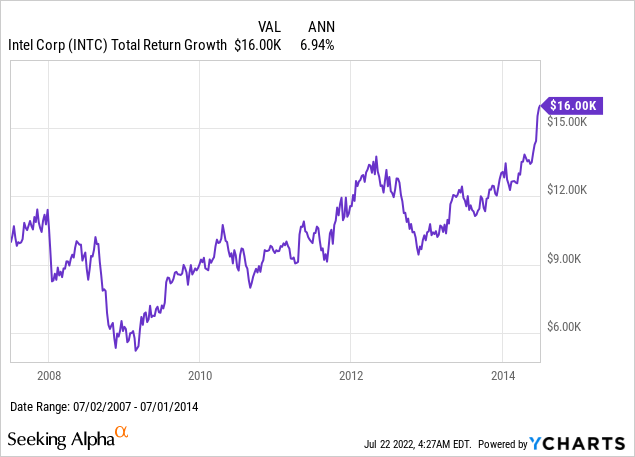
13. Intel (now 0.4% of VTI)
The brand of Intel Corp. (INTC) has been another relative decliner on the brand value ranking chart, which might be seen as roughly reflected in INTC shares returning roughly the same as VTI from 2007-2014…
… but then underperforming VTI by over 4%/year since 2014.
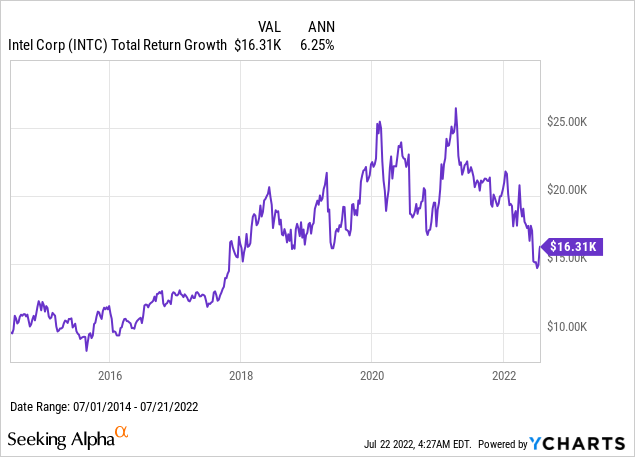
As someone who has used Apple computers for over 30 years, the brand value of Intel in my mind reached its height when Steve Jobs started putting Intel chips in Macs in 2006, and that brand value had already seemed to be declining for many years by the time Tim Cook stopped using Intel chips in 2020.
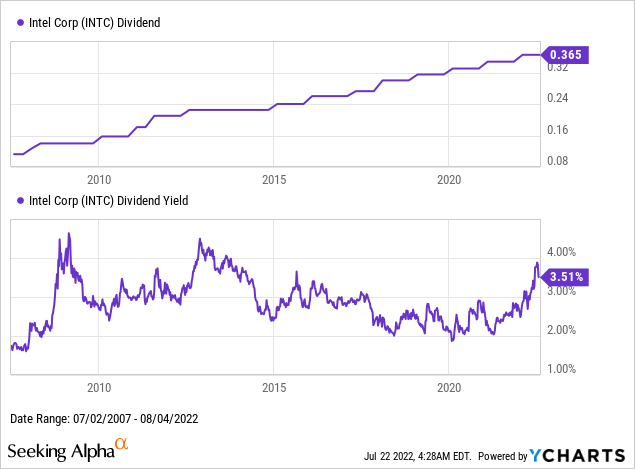
Looking at INTC’s continued dividend increases, this next chart wouldn’t seem to be one belonging to a “declining brand”. Although INTC’s dividend scorecard says INTC has “only 8 years” of dividend growth, I see this more as a flaw in a scorecard methodology that penalizes INTC holding its dividend at 22.5 cents/quarter through 2013-2014, which some might see as a warning, but I see as prudent dividend policy. So although we might agree that INTC’s brand has been declining in value, this example reminds me that may “brand momentum investing” methodology would be better if it saved me from the past 8 years of VOD before saving me from the last 8 years of INTC.
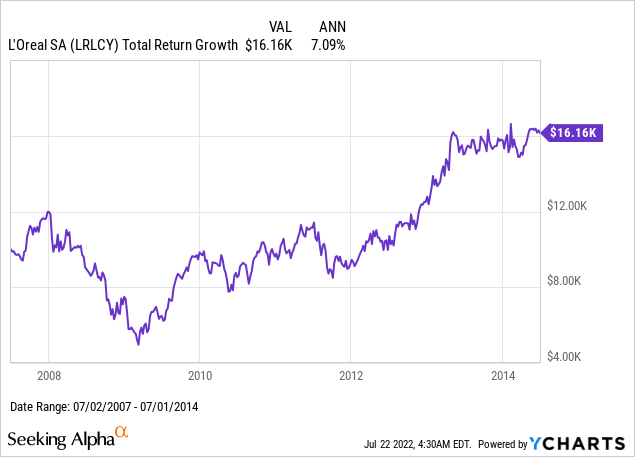
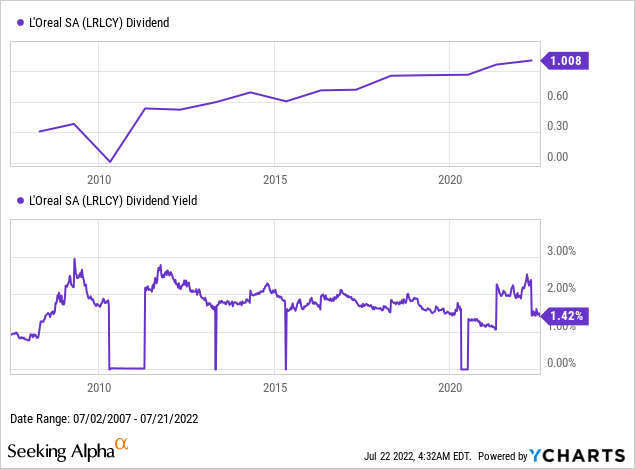
14. L’Oreal
The only French brand in our list is cosmetics giant L’Oreal (OTCPK:LRLCY), which has been a relative outperformer among foreign stocks, in that it slightly outperformed VTI from 2007-2014…
… and slightly outperformed again since 2014:
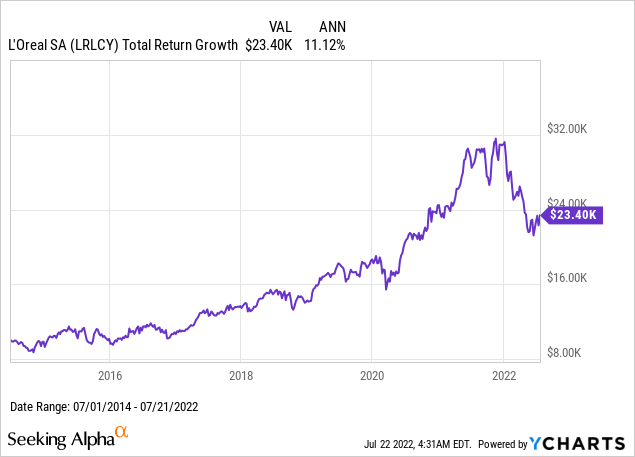
While the YCharts for L’Oreal’s dividend aren’t as clean as they are for US stocks, you can see the past 5 years’ dividend growth and cover of LRLCY’s Paris-listed ordinary shares here. LRLCY’s strong performance, backed by its strong dividend growth and declining yield, seems at odds with the significant decline in its brand ranking to #108 in 2014 and #173 in 2022. This could be read as a hint that brand rankings may be useful for identifying stocks to buy in the first place, but fundamentals may then be better to watch when deciding which stocks to keep.
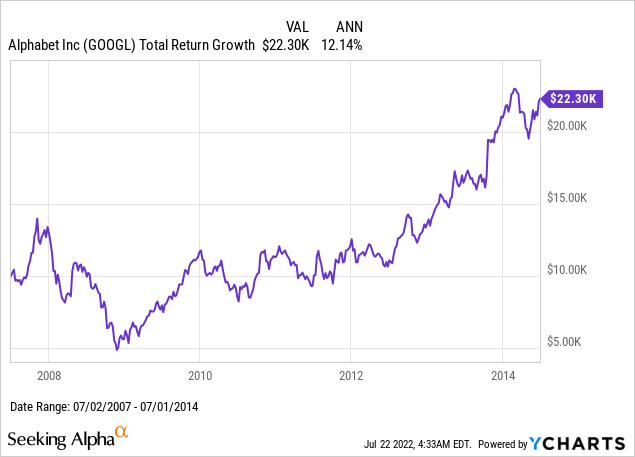
15. Google, a brand of Alphabet (now 3.3% of VTI)
Last but certainly not least from the 2007 top brands list is the world’s leading search engine brand Google, which since 2015 has had its parent company named Alphabet Inc. (GOOGL). Google’s brand value is the one that has most significantly increased of the original 15, from just under $25 billion in 2007 to over $260 billion in 2022, according to our source.
This significant rise in brand value seems to have been strongly correlated with GOOGL’s outperforming VTI by 5.5%/year from 2007-2014…
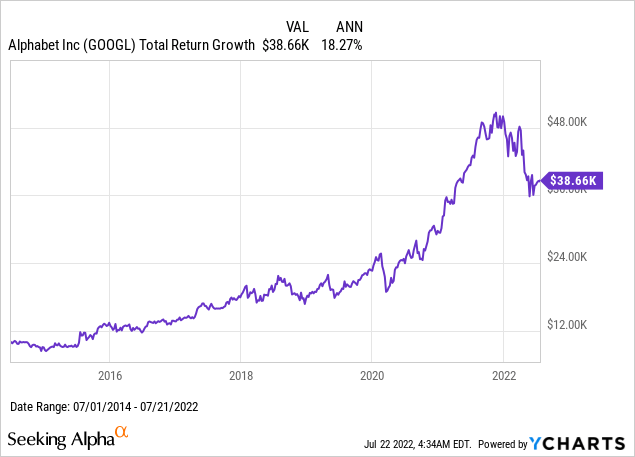
… and then outperformed VTI by over 7.5%/year since 2014:
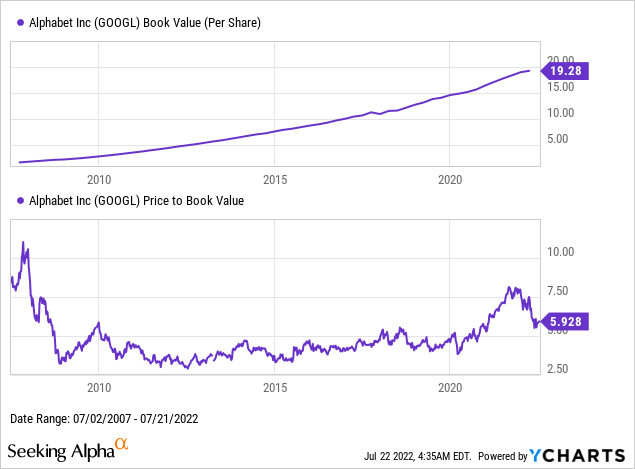
GOOGL has so far never paid even a single dividend, and so I track its shareholder value by using its book value, which grows at a very high compound annual growth rate reflecting the high rate of return earned on reinvested profits. Whether or not it still makes sense to pay 6x book value for a company that has historically doubled that book value roughly every five years depends how confident you are in the ability of Google’s brand to keep delivering that book value growth in the future.
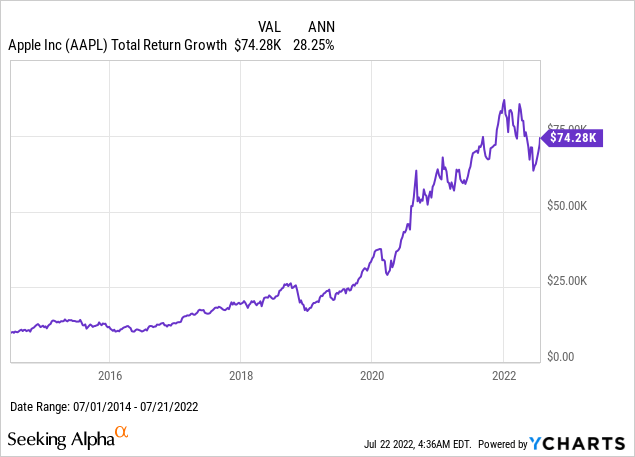
Replacement #1: Apple (now 5.5% of VTI)
One brand that wasn’t ranked in the top 15 in 2007, the year the iPhone was launched, became the #1 most valuable brand when the iPhone 6 launched in 2014, and that brand of course is that of Apple Inc. (AAPL). As explained earlier, we don’t look at AAPL’s returns before 2014, because we assume we are picking AAPL from the top of the 2014 brand value list in 2014, and then invest starting then. The results of AAPL’s strong returns since 2014, leading those of VTI by over 17%/year, seem to be a clear sign that brand momentum may be an indicator of future returns.
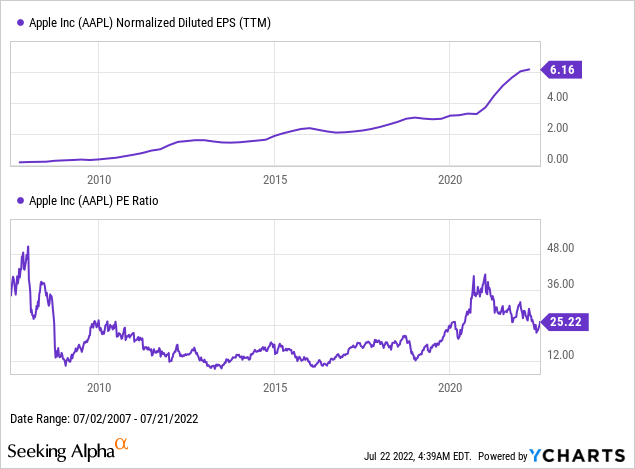
AAPL only resumed its dividend in 2012, so if I wanted to generate a single chart to look at AAPL’s fundamentals over the whole 2007-2022 period, I decided earnings per share would be a better denominator. Just as we saw strong “brand value momentum” for this name in 2014, we also see pretty strong “earnings momentum” around 2014, though a slight dip in earnings that year seems to have driven the opportunity to drive AAPL’s P/E ratio down to around 12. Just as I mentioned earlier how I wish I bought MSFT at 11x earnings in 2010, this below chart shows what a great price it was to buy AAPL at 12x earnings in 2014 when it was already a #1 ranked global brand.
Replacement #2: Samsung
The #2 most valuable brand in 2014, with a brand value then estimated to be $10 billion more than that of GOOGL, is Korean electronics giant Samsung Electronics (OTCPK:SSNLF). The main way I trade Samsung without having direct access to the Korean stock market is through the London-listed GDR with ticker “SMSN”. This GDR data is unfortunately unavailable on YCharts, which is why the below charts are from Koyfin. Samsung’s USD total return since 2014 slightly lags that of VTI’s, and came in significantly ahead of the USD returns of a fund like the iShares MSCI South Korea ETF (EWY), which has averaged around 0.5%/year since 2014.
Koyfin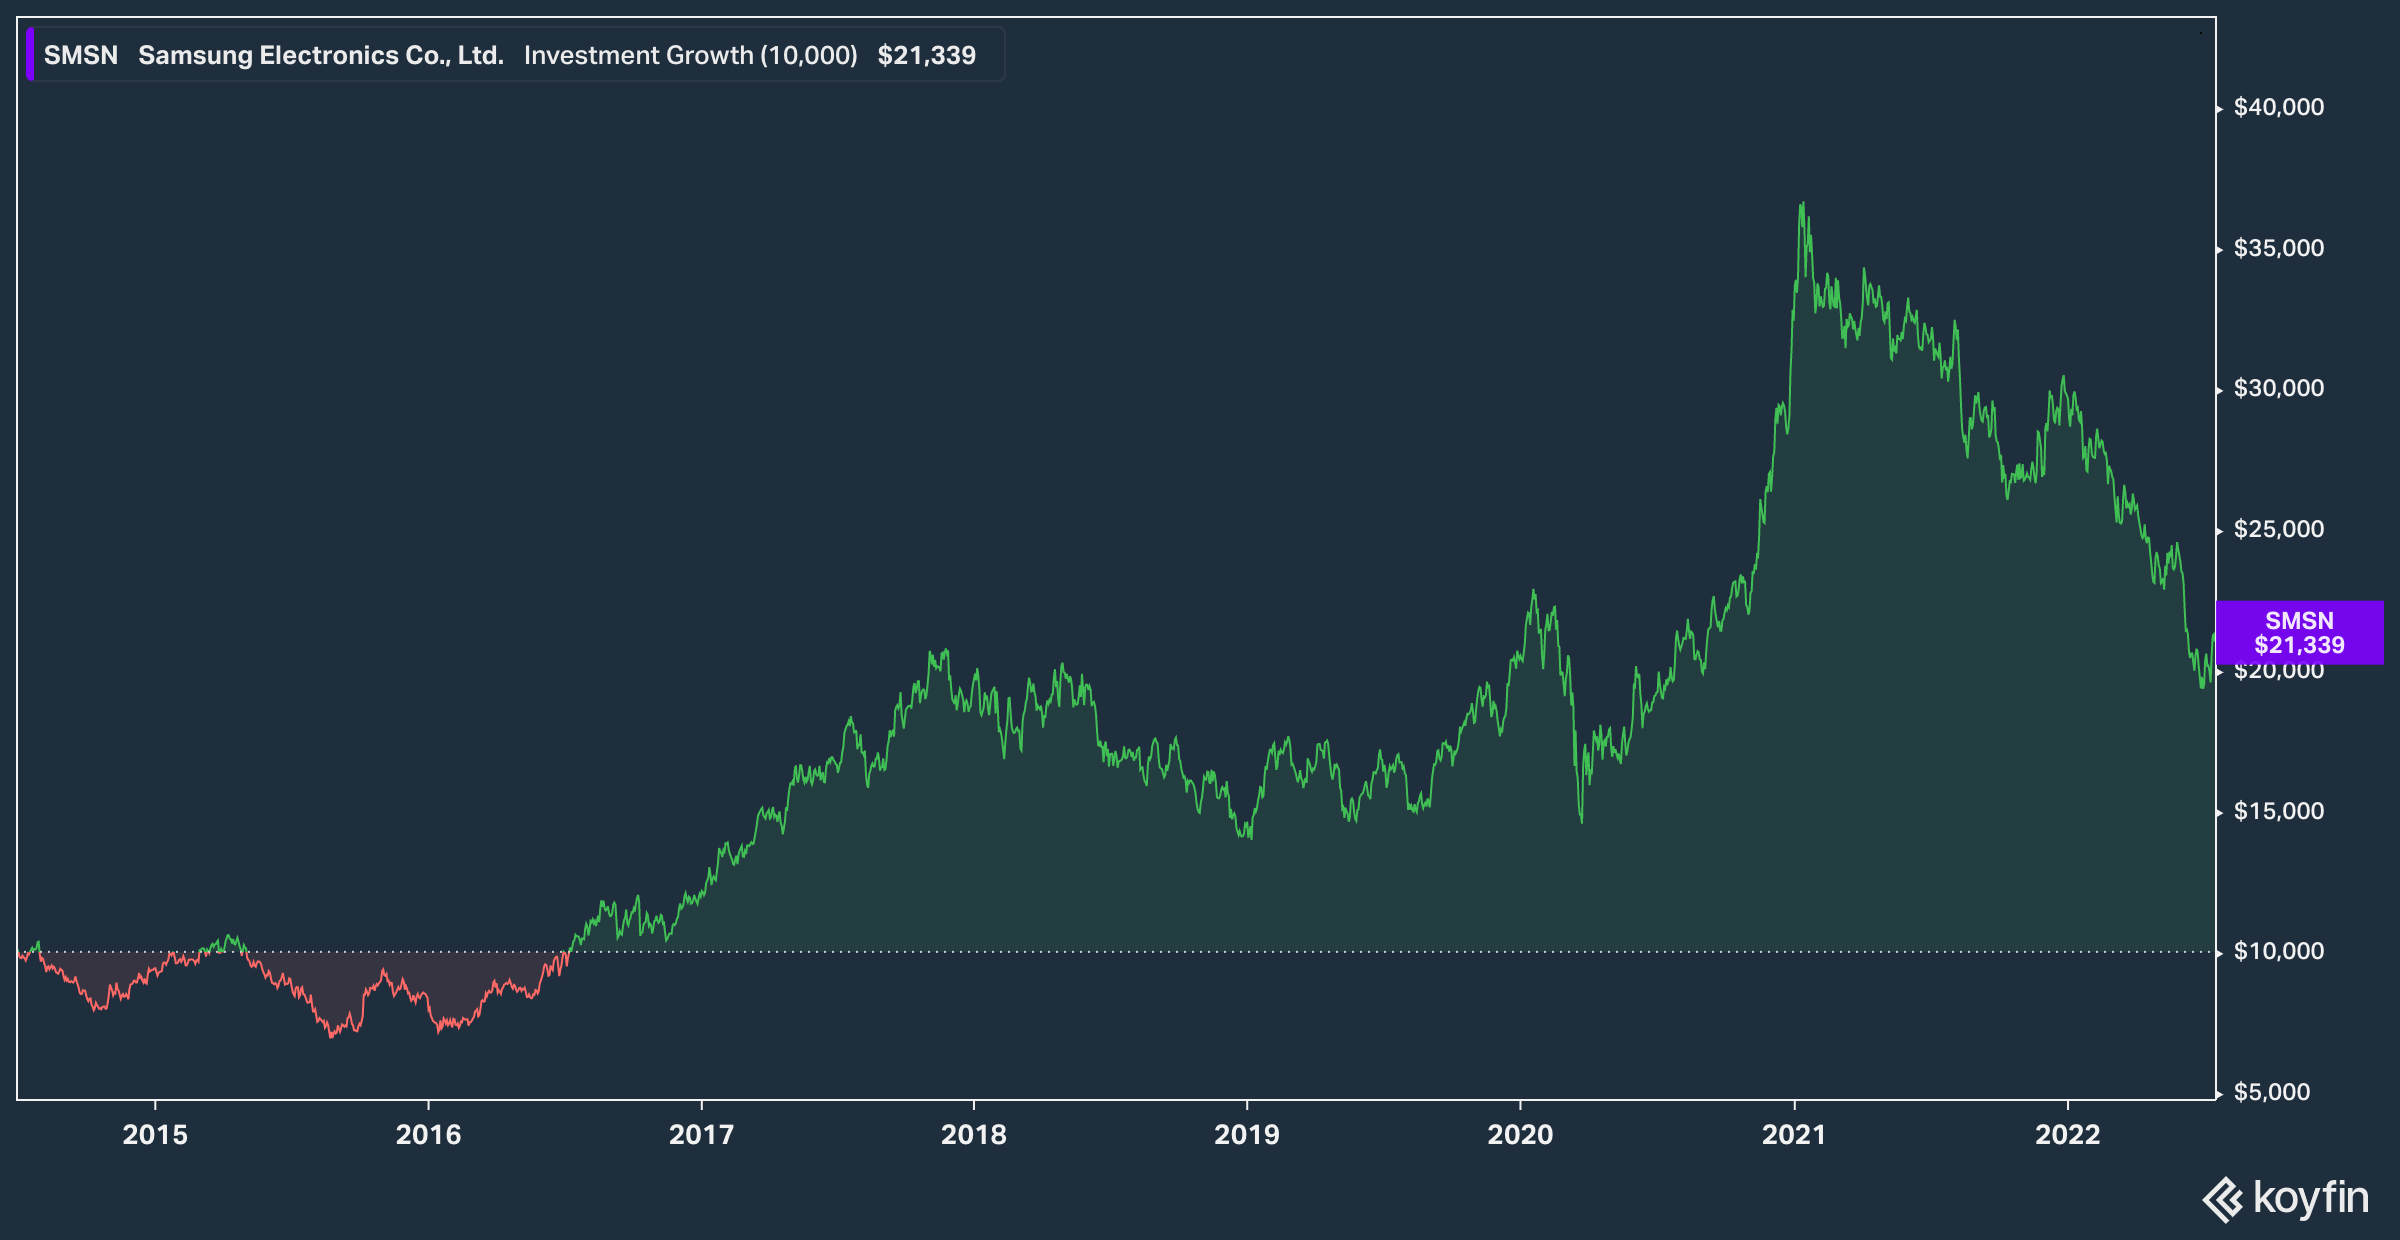
Samsung’s earnings have been through ups and downs over the years, but the current multiple of under 9x trailing twelve month earnings looks cheap, although does seem to be based on a cyclically high denominator. Samsung’s brand value rank has fallen from #2 in 2014 to #6 in 2022, so this would probably be a name kept if we were to continue running this strategy for another 7-8 year round.
Koyfin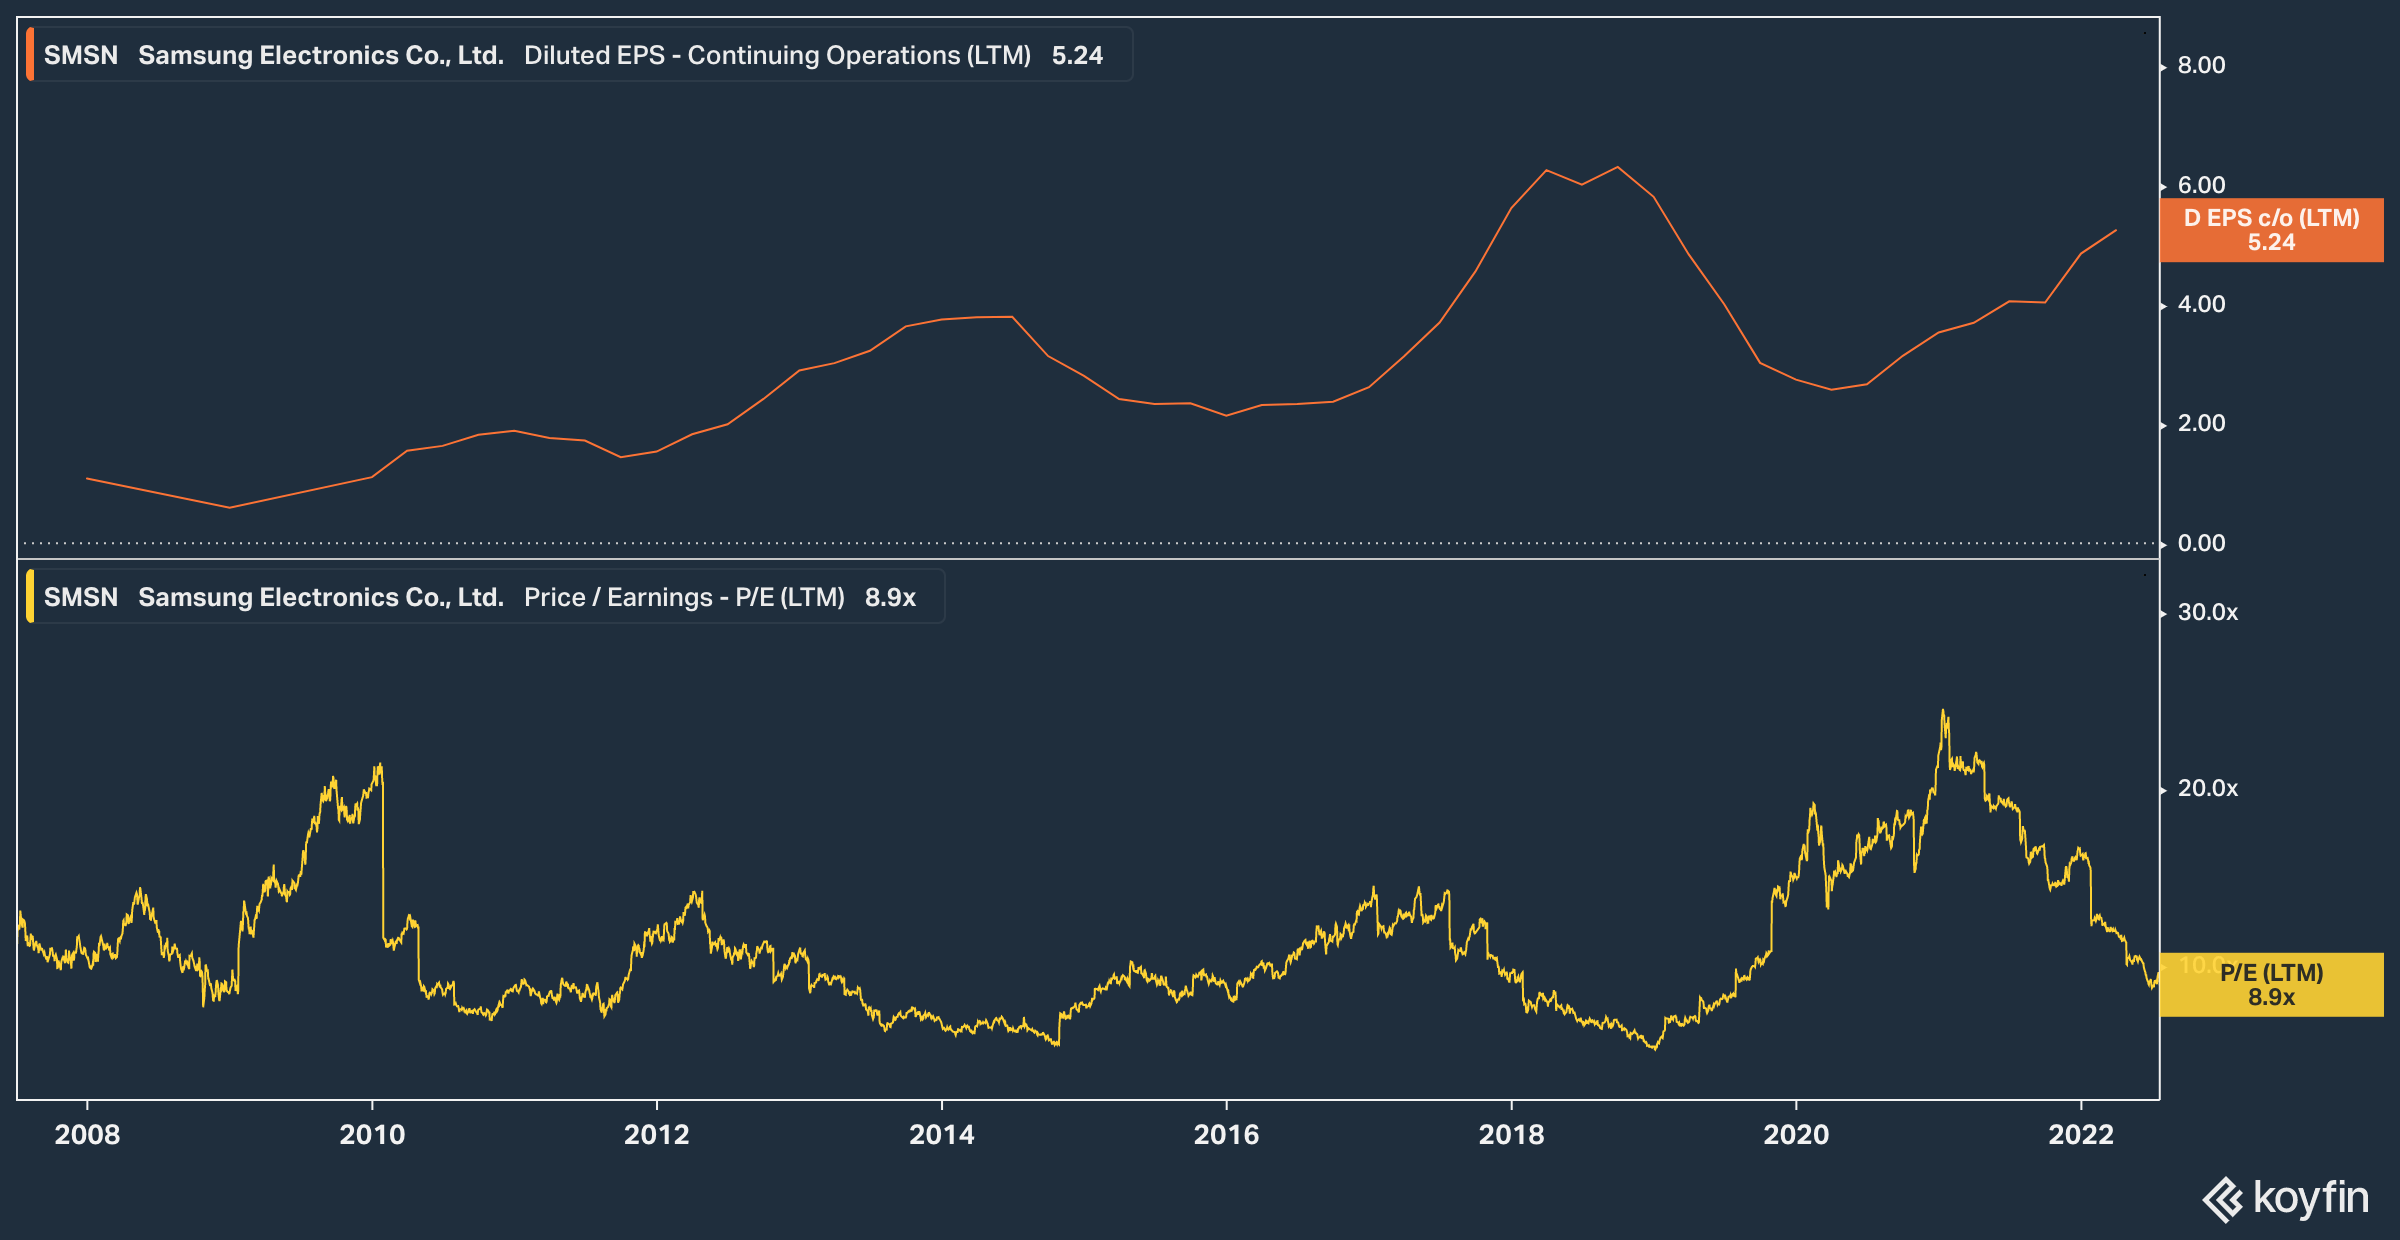
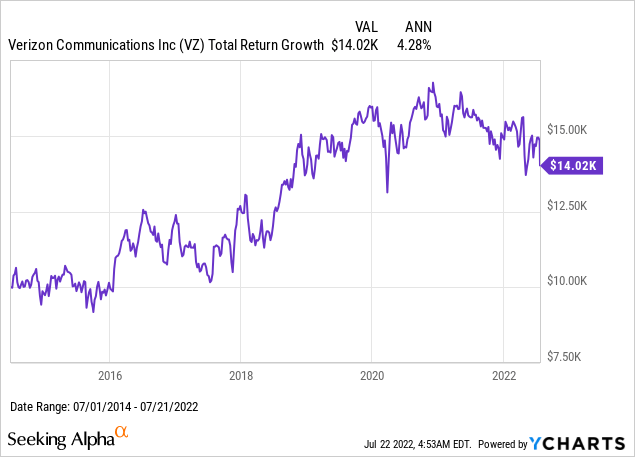
Replacement #3: Verizon (now 0.5% of VTI)
Of the newcomers to the top 10 brands of 2014, one that I had no personal sense of was that of American communications brand Verizon (VZ), most likely because I have been living outside the US since 2009 and did not see this brand outside its home market. Since that #5 brand ranking, VZ underperformed VTI by over 6%/year, but outperformed the telecommunications sector tracker IYZ by 3.5%/year. That tells me that, like with VOD, the telecom sector as a whole has been facing strong headwinds since 2014, and VZ’s brand strength is probably what made it a relative outperformer.
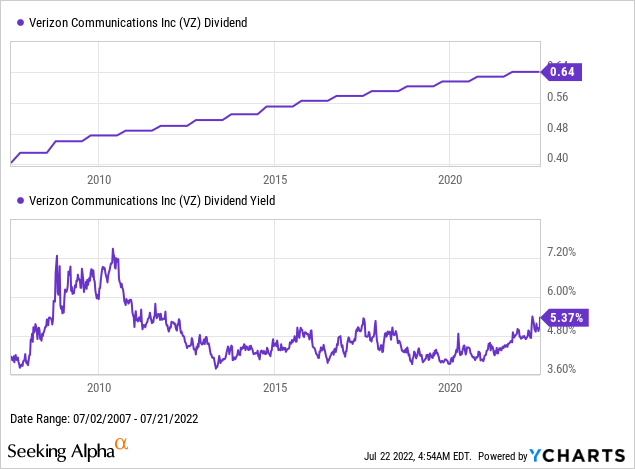
As with WMT and IBM, the rate of VZ’s dividend increases has slowed in recent years, though every annual hike of VZ’s quarterly dividend since 2016 has been by 1.25 cents per share, not just one cent per share.
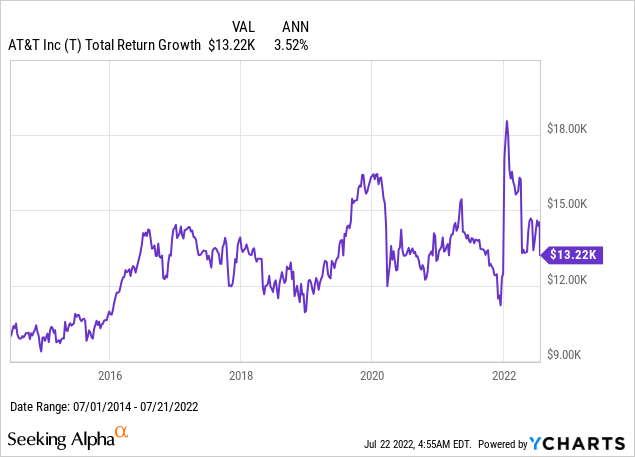
Replacement #4: AT&T (now 0.4% of VTI)
Similar to VZ, another American communications brand that rose to the top 10 in 2014 was the American Telephone & Telegraph Company (T). Like VZ, T’s returns since 2014 significantly lagged those of VTI, but outperformed IYZ by 3%/year.
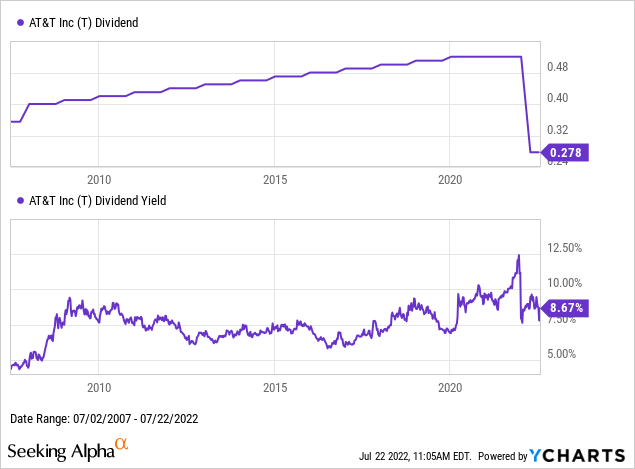
T has been a steady dividend grower since 1998, so in terms of “dividend momentum”, it probably would have passed our checks in 2014, and a yield around 7% would have seemed attractive and certainly not overvalued. T then increased its dividend for the next several years, and only cut its dividend this year in 2022, by which time its brand rank has fallen to #26. In theory, a 7% dividend yield should be seen as compensation for a high risk of a dividend cut, and this provides us a good example of what this downside looks like, even if the total return still ends up being positive over an 8 year horizon.
Replacement #5: Amazon (now 2.4% of VTI)
Finally, the #8 most valuable brand in 2014, and 5th most valuable brand that was not on our 2007 top 15 list, is online bookstore turned digital conglomerate and cloud computing provider Amazon.com Inc. (AMZN). As with AAPL, AMZN delivered very strong returns, in excess of 17%/year over that of VTI, and in line with AMZN’s continued rise to being the #2 brand of 2022.
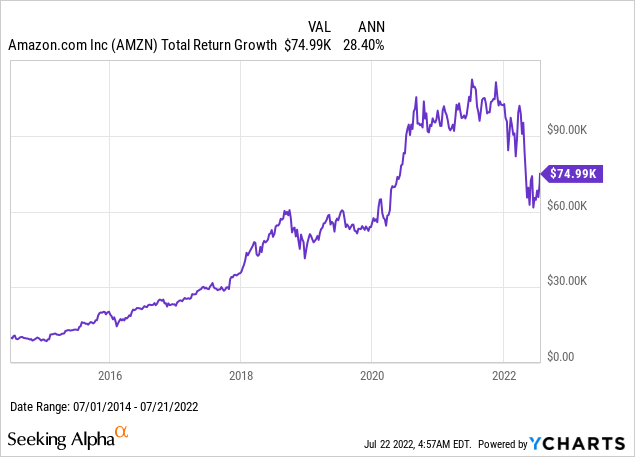
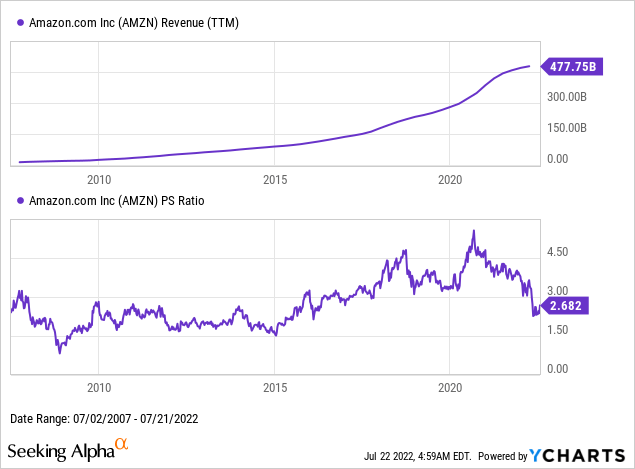
As with GOOGL, AMZN has yet to pay its first dividend, and so I would model its future value and returns by modelling compound growth of its book value. Amazon’s fundamentals are tricky to chart around the 2014 period, because AMZN still regularly reported negative earnings at that time, and only started showing consistent profits and book value growth in 2015-2015. My preferred denominator for the trajectory of AMZN’s valuation before the past few years is its top-line revenue number, which has roughly tripled from $150 billion to over $450 billion over the past 5 years. If you had been optimistic about this growth trajectory back in 2014 when you could have bought AMZN for around 2x sales, you would have been rewarded with the returns charted above, and the rise in AMZN’s brand value seem consistent with that.
Summary Table Of Returns
Since the 2007-2014 and 2014-2022 returns of each of the 20 stocks and four benchmark ETFs appear across 43 different charts above, I put those numbers together in the table below to summarize and calculate how $10,000 invested in each of these names would have grown over each period, with dividends reinvested. A few sum-ups of what this would have added up to in an investment portfolio, as summarized at the beginning of the article, are as follows:
- $150,000 invested in VTI in 2007 would have grown to $528,554 today.
- $10,000 invested in each of the top 15 stocks from 2007, and held until today, would have turned $150,000 into $493,072 today.
- If we invested the same $10,000 into each of the top 15 stocks in 2007, and then did a one-time rebalance to re-weight each of those same 15 stocks equally in 2014, that $150K would have grown to only $451,463. In other words, selling winners to buy more of our losers would have been a losing strategy with these 15 stocks.
- $120,000 invested in VTI in 2007 would have grown to $422,843 today.
- $10,000 invested in each of the 12 of the top 15 stocks from 2007 that were not banks (so excluding BAC, C, and HSBC), and held until today, would have turned $120,000 into $475,925 today. We could have a whole separate discussion about why it can be best to separate out financials, but I was personally excluding bank stocks back in 2007 because I was working for a bank at the time.
- The same $10K in each of those 12 non-bank stocks, with a one-time rebalance in 2014, would have grown that portfolio to $454,517 today.
- If we go back to investing $10K into each of the top 15 brand stocks of 2007, and then in 2014 drop the 5 brands with the lowest ranking (HP, Marlboro, Gillette, Intel, and L’Oreal, as underlined below), and rebalance the whole $207,646 in 2014 equally among the remaining 10 and new five (Apple, Samsung, Verizon, AT&T, and Amazon), that portfolio would have grown to $577,059 by today, still almost $50K more than VTI in #1.
- If we limit our initial portfolio to $10K in each of the top 12 non-banks starting in 2007, then rebalance the $369,802 proceeds in 2014 while replacing the same bottom 5 (none of which are banks), with the 5 new top brands (none of which are banks), that portfolio would have grown to $602,284 by today, about $180K more than VTI in #4.
| Brand | Ticker | Growth of $10,000 Over This Period | ||
| Top 15 of 2007 | 2007-2014 | 2014-2022 | 2007-2022 | |
| Coca-Cola | KO | $ 19,740 | $ 18,800 | $ 37,111 |
| Microsoft | MSFT | $ 16,640 | $ 72,320 | $ 120,340 |
| Citi | C | $ 990 | $ 13,050 | $ 1,292 |
| Walmart | WMT | $ 18,270 | $ 21,020 | $ 38,404 |
| IBM | IBM | $ 20,280 | $ 10,140 | $ 20,564 |
| HSBC | HSBC | $ 7,631 | $ 9,056 | $ 6,911 |
| General Electric | GE | $ 8,967 | $ 3,776 | $ 3,386 |
| Bank of America | BAC | $ 3,585 | $ 24,950 | $ 8,945 |
| HP | HPQ | $ 9,483 | $ 28,100 | $ 26,647 |
| Marlboro | PM | $ 21,770 | $ 16,720 | $ 36,399 |
| Vodafone | VOD | $ 10,030 | $ 7,237 | $ 7,259 |
| Gillette | PG | $ 15,800 | $ 22,590 | $ 35,692 |
| Intel | INTC | $ 16,000 | $ 16,310 | $ 26,096 |
| L’Oreal | LRLCY | $ 16,160 | $ 23,400 | $ 37,814 |
| GOOGL | $ 22,300 | $ 38,660 | $ 86,212 | |
| New 5 from 2014 Top 10 | ||||
| Apple | AAPL | $ 74,280 | ||
| Samsung Group | SSNLF | $ 21,339 | ||
| Verizon | VZ | $ 14,020 | ||
| AT&T | T | $ 13,220 | ||
| Amazon | AMZN | $ 74,990 | ||
| Benchmarks | ||||
| US Total Market | VTI | $ 15,640 | $ 22,530 | $ 35,237 |
| Global Ex-US | VEU | $ 11,090 | $ 12,010 | $ 13,319 |
| Financials | XLF | $ 7,263 | $ 20,750 | $ 15,071 |
| Telecoms | IYZ | $ 11,010 | $ 10,490 | $ 11,549 |
Conclusion & Takeaways
While many might say that the sample size of stocks here is too small or the time period chosen was too idiosyncratic, I do feel I can draw the following lessons from studying the 20 stocks above and how their returns added up in different portfolio strategies:
- 15 stocks is probably enough diversification for most purposes, especially if those 15 stocks are limited to those with a sizeable enough “moat” like having a top 15 valued brand. This is an idea I already covered from several angles in several earlier articles:
- Point #1 seems to have been tested in our sample where one of the 15 stocks declined by 90%, two others fell by almost 70% over different time periods, and two others are still down by about 30% after 15 years. In our sample, a few names with strongly positive returns outweighed the losers.
- Brand value and brand momentum does seem to matter, and stocks with increasing brand value have tended to outperform those with declining brand value, but as with other valuation metrics, this is not a perfect correlation and should be checked alongside fundamentals.
- Just as leverage can multiply the upside, leverage can multiply losses to shareholders well in excess of brand value. This is one reason to treat brands with high financial leverage or capital requirements differently from brands of more capital-light businesses.
- Perhaps most importantly, these examples seem to make a strong case for portfolios that focus on stocks with the highest brand value and strongest brand momentum, indicating that these portfolios “probably aren’t missing much” by excluding thousands of more obscure stocks. While stocks with valuable brands aren’t immune to significant losses, especially when they are highly leveraged, I don’t think it was a coincidence that the only four stocks now worth over $1 trillion (AAPL, MSFT, GOOGL, and AMZN) were among the strongest performers over the past 15 years, and were all picked up by these brand value screens in 2007 and 2014. The visibility on how the rising values of these top brands drove their outperformance, and just as importantly the visibility into how declining brand values drive underperformance, is one factor that should not be undervalued.
- The above five points are why I put a sell rating on VTI, not because I am bearish on all US stocks, but because I believe it’s better to get out of overly diversified funds with too many obscure names and focus on fewer names with clear brand value.
Be the first to comment