

Jchambers/iStock via Getty Images
Investment Thesis
I’ve had a rocky relationship with the VanEck Wide Moat ETF (BATS:MOAT). I had previously recommended it due to its superior asset allocations and excellent long-term track record. However, I’ve grown sour on it in 2022, as the underlying holdings don’t make much sense and are unnecessarily risky for what should be safer “wide moat” stocks. Unfortunately, this article is another bearish one, as last Friday’s reconstitution resulted in too many deep-value plays receiving too much weighting. Only three stocks, or 6% of the total weight, are up over the last year. Many, like Etsy (ETSY) and MercadoLibre (MELI), are down 50%. In short, this ETF isn’t for me right now, and unless you’re expecting a sharp turnaround in the markets shortly, I don’t think you should buy it, either.
MOAT ETF Overview
Strategy and Sector Exposures
MOAT tracks the Morningstar Wide Moat Focus Index and is the result of two sub-portfolios that rebalance semi-annual on different quarterly schedules. This strategy means that we’ll have a new set of constituents to analyze each quarter. It’s enough to keep investors on their toes, and ideally, it means the Index can more quickly respond to changing market conditions. For a 0.46% expense ratio, I think that’s probably the biggest draw, along with Morningstar’s reputation.
Selections for each sub-portfolio are made based on three factors:
- Morningstar Moat Rating
- Price / Fair Market Value
- Twelve-Month Price Momentum
Each sub-portfolio is equal-weighted and holds 40 companies, but some overlap exists. Rather than MOAT having 80 companies, it only has 48 as of the latest reconstitution, since several are in both sub-portfolios. Last quarter, it was 52. The Index applies a sector capping rule which, based on the composition of today’s equity market, is 40% and likely doesn’t apply.
I think the price / fair market value screen is working against investors’ right now. As the market declines, many stocks are probably trading well below what Morningstar analysts consider their fair values. It’s rare for a company to lose its moat status, so in declining markets, we’re more likely to be left with a randomized set of deep-value holdings. I’ll discuss that in more detail shortly, but first, let’s look at MOAT’s current sector exposures. I’ve updated this myself, as VanEck’s website still reflects exposures as of August 31, 2022.
The Sunday Investor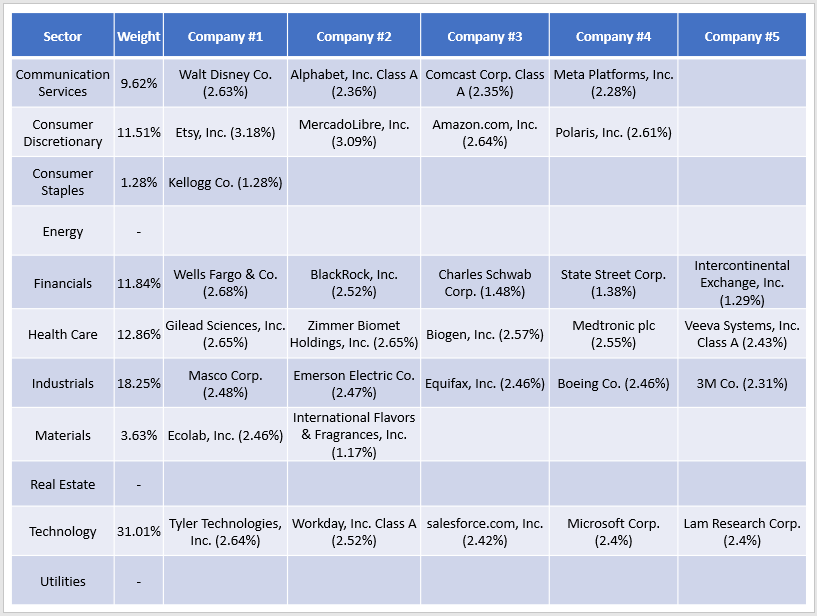
MOAT is doubling down on the Technology sector, which now comprises 31% of the ETF. Industrials stocks like Masco (MAS) and Emerson Electric (EMR) total 18.25%. Communication Services, Consumer Discretionary, Financials and Health Care, are around 11-13% each. Consumer Staples was all but eliminated after previously having about 8%. Finally, the Index continues to have zero exposure to Energy, Real Estate, and Utilities. MOAT typically doesn’t have much exposure to these sectors, but now that Consumer Staples is effectively out, MOAT looks riskier than any other time I’ve covered it.
Performance Analysis
MOAT vs. SPY Returns Since Inception
Since MOAT launched in April 2020, it’s delivered annualized gains of 12.92% vs. 12.44% for the SPDR S&P 500 ETF (SPY). As a result of higher volatility, risk-adjusted returns (Sharpe and Sortino Ratio) were marginally lower, but still, the track record looks excellent.
Portfolio Visualizer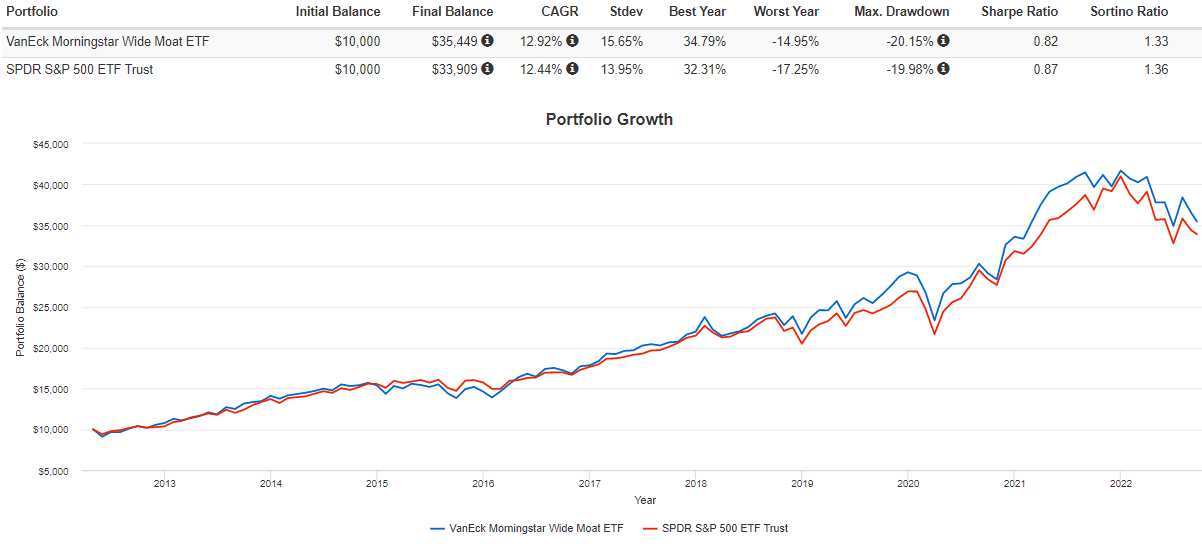
Against 35 large-cap blend ETFs, MOAT’s ten-year returns are second only to the Invesco S&P 500 High Beta ETF (SPHB). However, its returns also tend to be among the least consistent and are elevated by two specific periods of exceptionally strong performance. The first was from February to July 2017, when it outperformed SPY by 11.84%:
Portfolio Visualizer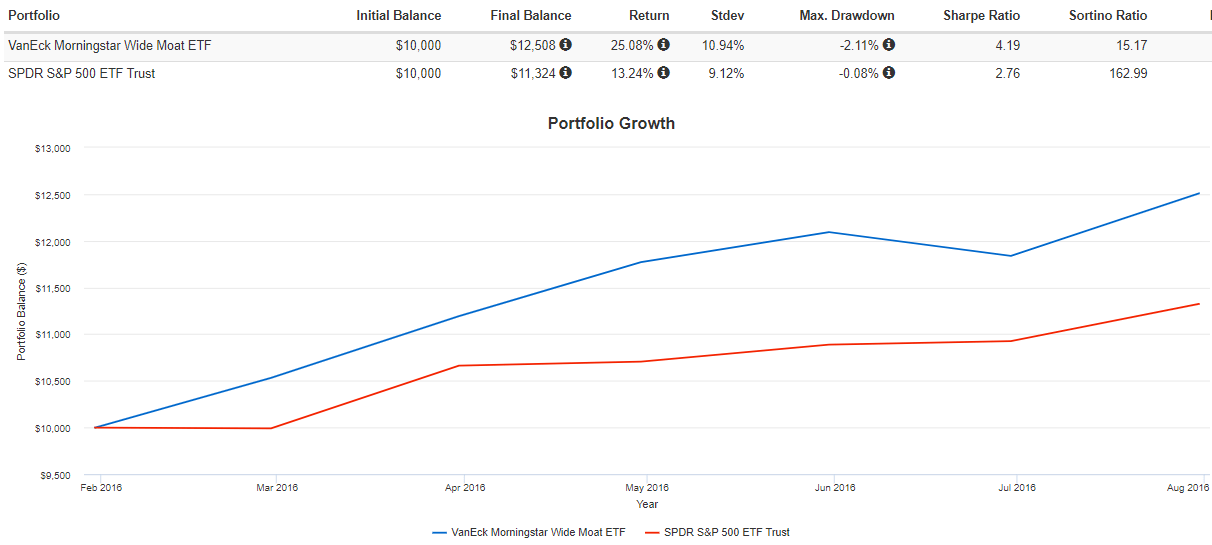
And from October 2020 to March 2021, MOAT outperformed by 9.54%.
Portfolio Visualizer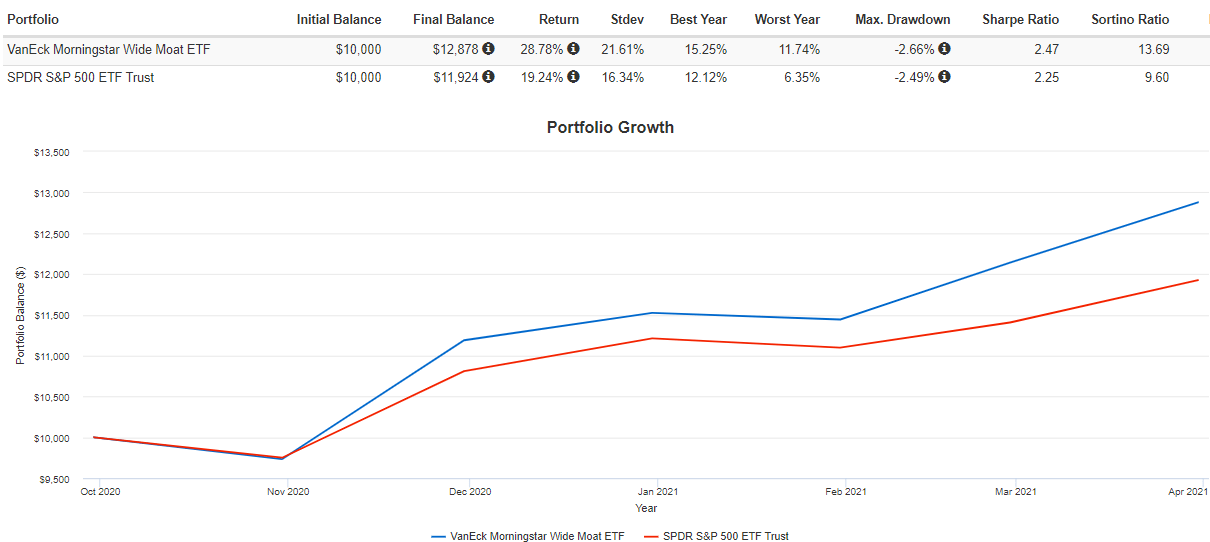
MOAT really hasn’t had many significant underperforming six-month periods other than from June to November 2021, when it lagged by 9.06%. In the 125 months since MOAT launched, it’s outperformed SPY 61 times and underperformed 64 times. Therefore, I think the odds are in favor of SPY most of the time, but MOAT eventually makes up for it. The key question is what will drive that performance, and if history were to repeat, it would likely be MOAT’s superior sector allocations.
Performance Attribution
In March 2021, I did a performance attribution analysis on MOAT and concluded that its wide moat stock selections were not a source of excess return for the ETF. It surprised me, because I assumed that wide moat investing would result in better returns. However, in a way, I was pleased because it meant that active sector exposure decisions drove the fund’s excess gains. You don’t need to buy MOAT to reap the rewards. You can just track its quarterly sector exposure changes and use that information to inform your own portfolio’s allocations.
Morningstar analysts may have reached the same conclusion. Here’s the latest five-year performance attribution analysis posted on their website as of June 30, 2022, showing total allocation and selection effects of 11.06% and -2.28%.
Morningstar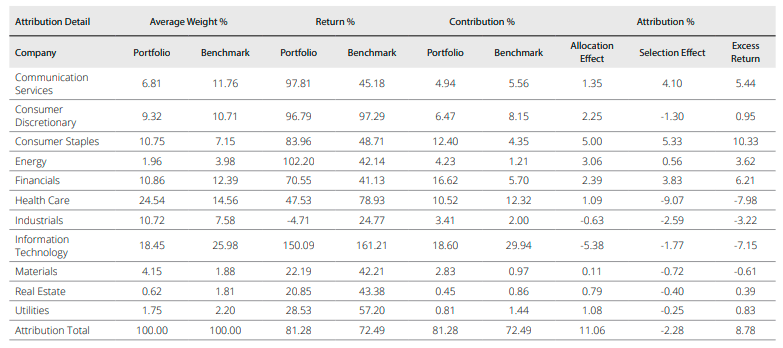
Admittedly, these results give me pause about criticizing MOAT’s current sector allocations. However, it’s difficult to support such a concentrated and risky portfolio absent signs of a market turnaround. To get a clearer idea of that risk, let’s look closer at MOAT’s current constituents and their fundamentals.
Fundamental Analysis
Reconstitution Summary
Each quarter, Morningstar provides a reconstitution summary for MOAT. This quarter, there were ten additions and removals, primarily based on the price / fair value screen. Morningstar lists Comcast (CMCSA), Applied Materials (AMAT), and Walt Disney (DIS) as priced roughly 35-40% below fair value.
Morningstar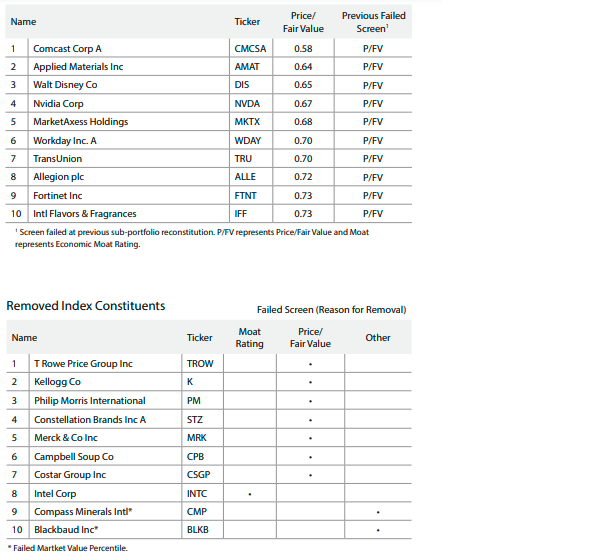
Other companies, like T. Rowe Price Group (TROW) and Kellogg (K), were removed. However, Kellogg is still a holding in the other sub-portfolio, and I’m assuming it will be completely removed next quarter if performance is strong.
Fundamental Analysis
The following table summarizes MOAT’s fundamentals against its constituents as of August 31, 2022, and against SPY as it’s constituted today. This way, you can easily see the impact of the above changes on the ETF and if it’s a better alternative to a more diversified broad-market fund.
The Sunday Investor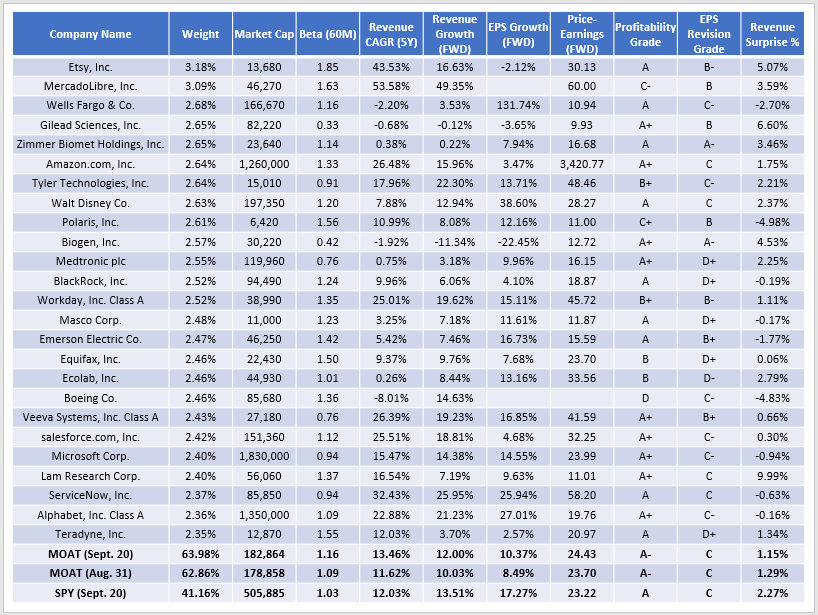
First, notice how MOAT’s five-year beta is now 1.16, up from 1.09 previously. Back in December, it was 0.97, and the weighted-average market capitalization was $280 billion, so MOAT is gradually leaning more into riskier, smaller-sized companies. Today, there are above-average-beta stocks like Workday (WDAY), Applied Materials, and NVIDIA (NVDA), while low-beta stocks like Campbell Soup (CPB) and Merck & Co. (MRK) are gone. In my view, more balance is required.
Second, the above changes slightly increased MOAT’s growth and valuation profile. Previously, MOAT had a 10.03% and 8.49% estimated revenue and EPS growth rate. Now, it’s 12.00% and 10.37% but trades at a more expensive forward earnings valuation (24.43x vs. 23.70x). These changes are small but are well below what’s considered normal for large-cap blended ETFs. For example, SPY features estimated revenue and EPS growth of 13.51% and 17.27% and still manages to trade at a lower earnings multiple (23.22x). To put things in perspective, of the 35 large-cap blend ETFs that have at least a ten-year history, MOAT’s estimated earnings growth ranks dead last, and its forward earnings valuation is the fourth highest. Therefore, it’s one of the worst picks for growth-at-a-reasonable-price investors.
Finally, it’s difficult to say exactly how Morningstar analysts arrive at fair value estimates, but it appears they are priced low for a reason. Consider last quarter’s weighted-average revenue surprise of only 1.15%, or half of SPY. When I turned bearish on MOAT in April, it was a similar story (1.66% vs. 3.03%). Therefore, I don’t think MOAT’s poor recent results can be blamed on any pricing inefficiencies. Its constituents have had a few relatively poor quarters and declined accordingly.
Investment Recommendation
I’m maintaining my sell recommendation on MOAT because it’s getting progressively more volatile, holds too many deep-value stocks, and lacks exposure to sectors that offer protection in market downturns. MOAT has an excellent track record of picking the right sectors, so my view may be considered a bit contrarian. However, its 31% exposure to Technology suggests Morningstar analysts expect that sector to rebound, and I’m not convinced that will happen soon. MOAT’s fundamentals are also poor relative to other large-cap blend ETFs like SPY, which I think is the better pick until MOAT becomes better balanced.
Be the first to comment