Ryan Pierse/Getty Images News
By Sean Freer
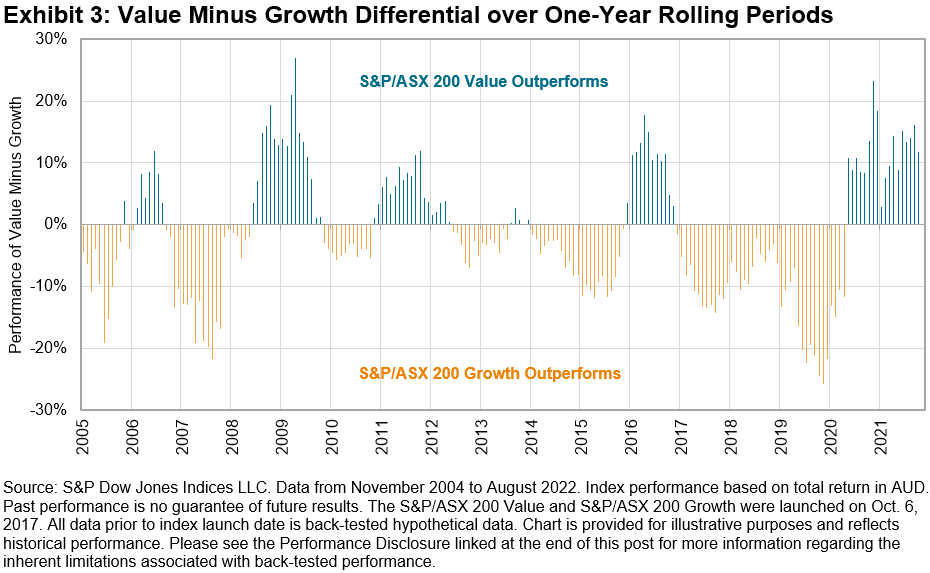
Those who implement style investing will have noticed a recent reversal of fortunes for the value approach following a long spell of underperformance. Since the inception of the S&P/ASX 200 Growth and S&P/ASX 200 Value in 2017, the back-tested approach has seen growth top value in 12 out of the past 17 calendar years.
However, with growth peaking in Australia and broadly across developed markets in 2020 (2021 in the U.S.), the rotation toward value is well underway. The digital innovation-led market with a prolonged period of loose monetary policy has given way to high inflation — now reaching multiple decade highs and tightening monetary policies by central banks. In this environment, future company earnings are discounted more heavily, and they are exposed to higher capital and other input costs, which hinders growth.
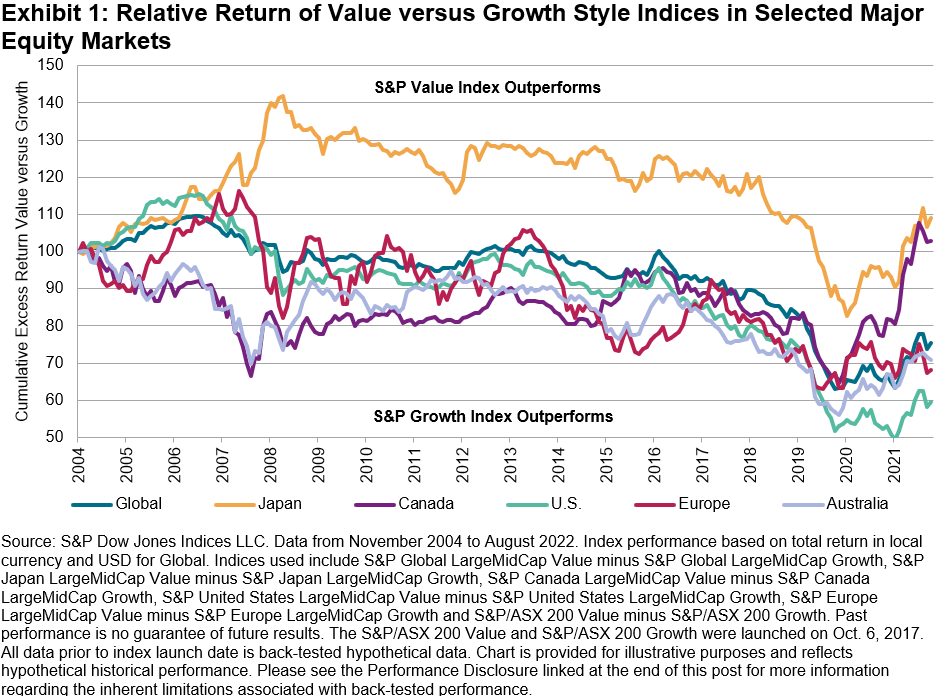
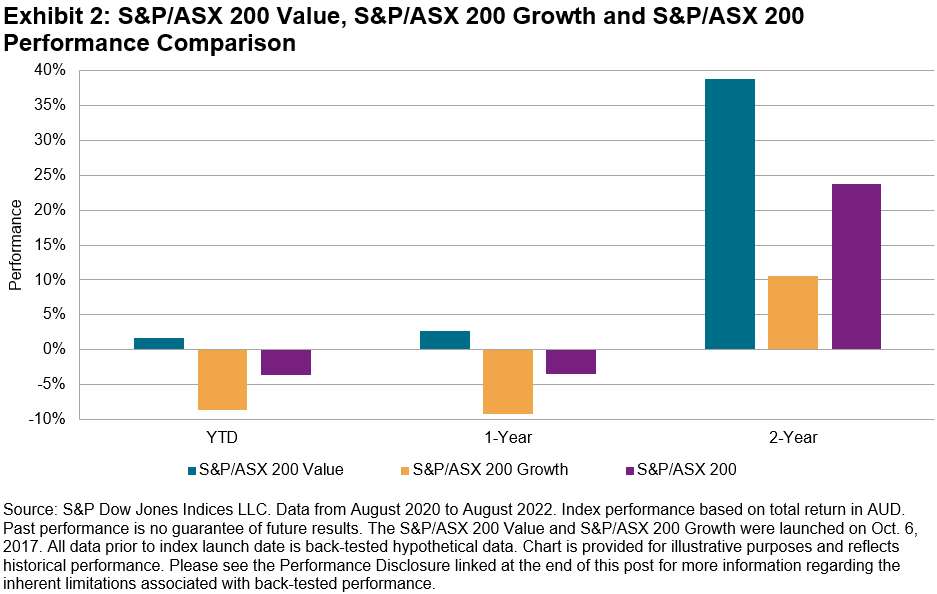
Value outperformed growth in 2021 across the board in developed markets. In Australia, value trumped growth by more than 7% and has accelerated its resurgence in 2022, outperforming growth by over 10% YTD and by more than 20% cumulatively over the past two years (as of Aug. 31, 2022).
Over the one-year period as of Aug. 31, 2022, value exhibited resilience in a falling market, with the S&P/ASX 200 Growth (-9.19%) and the broad market S&P/ASX 200 (-3.43%) declining, while the S&P/ASX 200 Value gained 2.64%. An outperformance spread of nearly 12%.
The S&P/ASX 200 Growth and S&P/ASX 200 Value consist of companies with pure growth and value characteristics, respectively, as well as companies within the broader S&P/ASX 200 categorized as “blend.” This style bias results in two distinctive indices from companies within the S&P/ASX 200. Exhibit 4 highlights the difference in sector weights between the value and growth approaches.1
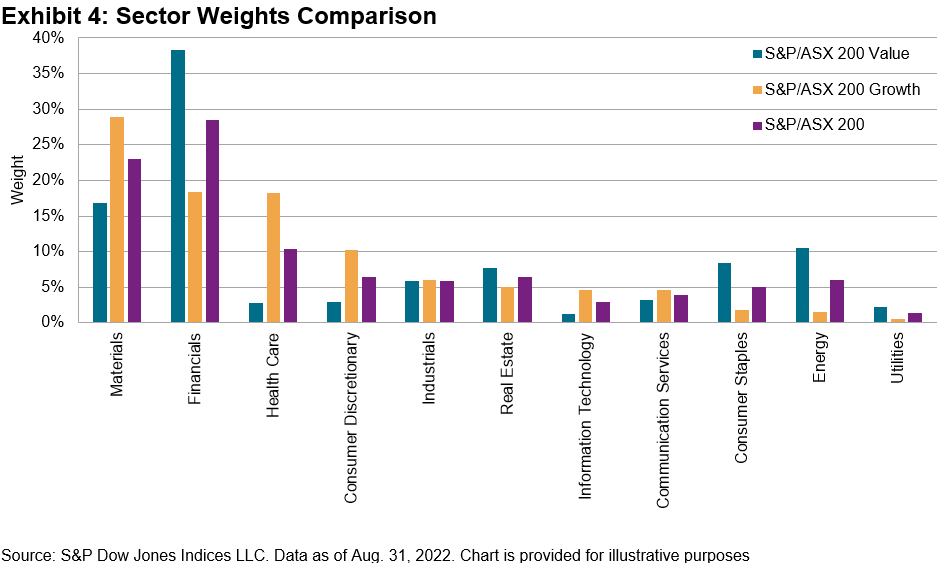
In the current market environment, we can see significant dispersion of returns among sectors, with the one-year difference as of Aug. 31, 2022, between the highest-performing sector (Energy 53.00%) versus the worst-performing sector (Information Technology -34.75%) at 87.75%. This spread is among the highest exhibited over one-year periods going back 10 years. The past 12 months have seen the outperformance of Energy over Materials, Consumer Staples over Consumer Discretionary and Financials over Health Care, and it has resulted in considerable relative gains for the value approach over the broad market.
As expected, the correlation between the growth and value investment styles has significantly lowered compared with longer-term averages. This also rings true in global markets, with value and growth indices in the U.S., Europe and Japan displaying similar dynamics over recent months — a value-led comeback, higher sector dispersion and lower correlation following a long period of growth outperformance.
Australian investors haven’t historically been as style aware with their domestic equity exposure compared to those in the U.S. and other developed markets. Given such distinctive performance characteristics, the S&P/ASX 200 Growth and S&P/ASX 200 Value offer a unique lens through which to evaluate market dynamics compared to the broad market S&P/ASX 200.
1 Please refer to the methodology document for S&P/ASX Indices for more information: S&P/ASX 200 Style Indices Methodology.
Disclosure: Copyright © 2022 S&P Dow Jones Indices LLC, a division of S&P Global. All rights reserved. This material is reproduced with the prior written consent of S&P DJI. For more information on S&P DJI please visit www.spdji.com. For full terms of use and disclosures please visit Terms of Use.
Editor’s Note: The summary bullets for this article were chosen by Seeking Alpha editors.


Be the first to comment