

Glida46/iStock via Getty Images
Vale (NYSE:VALE) is a Brazilian mining company that produces a well-diversified set of metals, including nickel, copper, cobalt, platinum, rhodium, ruthenium, iridium, gold, and silver. It is a company that proves to have slow and steady growth leading into 2026. As they must reduce debt when needed, this is a profitable company in the long run, no matter when a global slowdown occurs.
Fundamentals kicked into high gear since 2021
Growth
As you can see, there is a mixed story of these significant growth metrics, but since 2020, operating growth income and net income have gotten stronger. Therefore, it is essential to see the earnings price per share grow as it has increased over the last two years.
|
Unnamed: 0 |
2017 |
2018 |
2019 |
2020 |
2021 |
|
Period |
FY |
FY |
FY |
FY |
FY |
|
EBIT Growth |
0.550 |
0.094 |
-0.890 |
7.221 |
1.554 |
|
Operating income growth |
0.550 |
0.094 |
-0.890 |
7.221 |
1.554 |
|
Net income growth |
0.383 |
0.246 |
-1.245 |
3.900 |
3.598 |
|
EPS Growth |
0.377 |
0.245 |
-1.250 |
3.879 |
3.611 |
Source: Financial Modelling Prep
Enterprise
It is fair to say Vale has not crashed compared to other stocks in the basic materials category. Moreover, there have been no stock dilutions since 2017, which retains the quality of this stock. Finally, Vale reduced debt substantially last year.
|
2017 |
2018 |
2019 |
2020 |
2021 |
|
|
Stock price |
12.990 |
12.590 |
12.010 |
16.150 |
15.580 |
|
Number of shares |
5.195 B |
5.126 B |
5.128 B |
5.130 B |
5.130 B |
|
Add total debt |
24.967 B |
18.967 B |
19.367 B |
20.108 B |
13.782 B |
|
Minus cash and cash equivalents |
4.328 B |
5.784 B |
7.350 B |
13.487 B |
11.721 B |
|
Enterprise value |
88.126 B |
77.723 B |
73.608 B |
89.469 B |
81.985 B |
Source: Financial Modelling Prep
Estimate
These forward-looking metrics show guidance up to 2026. For a basic materials firm, the strength of the earnings per share starts in 2023. Also, the profits before income tax depreciation amortization strengthen with solid growth between 2023 and 2026.
|
YEARLY ESTIMATES |
2022 |
2023 |
2024 |
2025 |
2026 |
|
Revenue |
521,154 |
598,344 |
684,114 |
767,116 |
875,413 |
|
EPS |
0.02 |
2.25 |
3.74 |
5.27 |
7.40 |
|
P/E Ratio |
5,898.26 |
51.33 |
30.95 |
21.94 |
15.63 |
|
EBITDA |
– |
88,504 |
113,030 |
141,783 |
180,975 |
|
Net Profit |
523 |
24,549 |
38,754 |
55,436 |
77,838 |
|
EPS (Non-GAAP) ex. SOE |
0.53 |
2.19 |
3.76 |
5.34 |
7.54 |
|
EPS (GAAP) |
0.02 |
2.25 |
3.74 |
5.27 |
7.40 |
|
Total Assets |
455,317 |
515,053 |
595,453 |
652,473 |
816,119 |
Source: BusinessInsider
Risk Fairly Low for Long Term Investors
Sustainability
It is vital that large-cap stocks, especially those in mining, receive outperforming sustainability ratings. If the company’s ESG rating is not favorably rated, it will be hard to get funded by the two largest asset managers, Blackrock and Vanguard. Their large-cap competition will most likely have these outperforming ratings as well.
|
Unnamed: 0 |
Value |
|
Social score |
14.8 |
|
Peer count |
54 |
|
Governance score |
9.89 |
|
Total ESG |
30.28 |
|
Highest controversy |
3 |
|
ESG performance |
OUT_PERF |
|
Environment score |
5.59 |
Source: Yahoo Finance
Price Target
The pricing target from market analysts did not start until May 2021. This indicator helps understand the number of analysts tracking this stock based on interest from their stock research firm’s clientele. The critical highlight is how the target and actual prices are not far apart. More trading analysts should pay attention to the stock and the potential upward momentum in price as more folks invest in this possible hot stock.
price target vale (custom platform)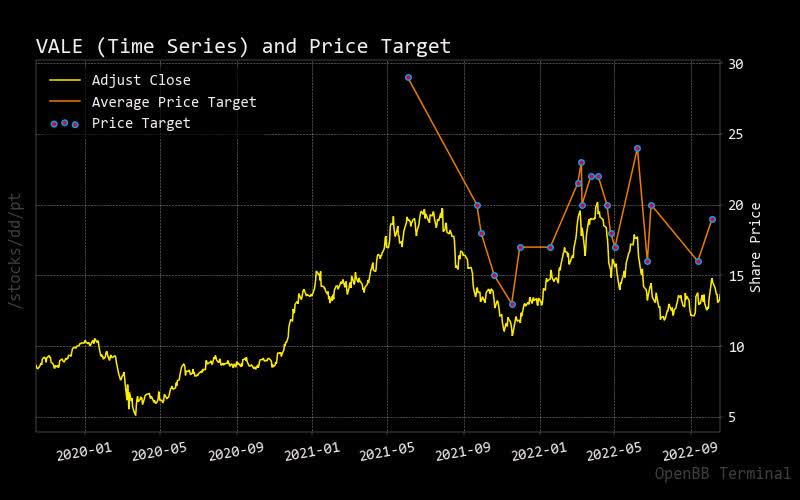
Shorting Volume vs. Trading Volume
Another important indicator is how shorting volume measures up against total volume. As you can see, shorting has been relatively consistent, with half of the total trading volume over the years. Trading volume could start to build with an expectation of a rise in stock price. One should see a reduction in trading volume with more longing volume, confirming an increase in price expectation.
Vale shows that approximately half of all trading volume is consistently shorted with competitors in its sector. It also shows no expectation of Vale’s stock price falling or sudden rise in stock price.
short vs trading volume vale (customer platform)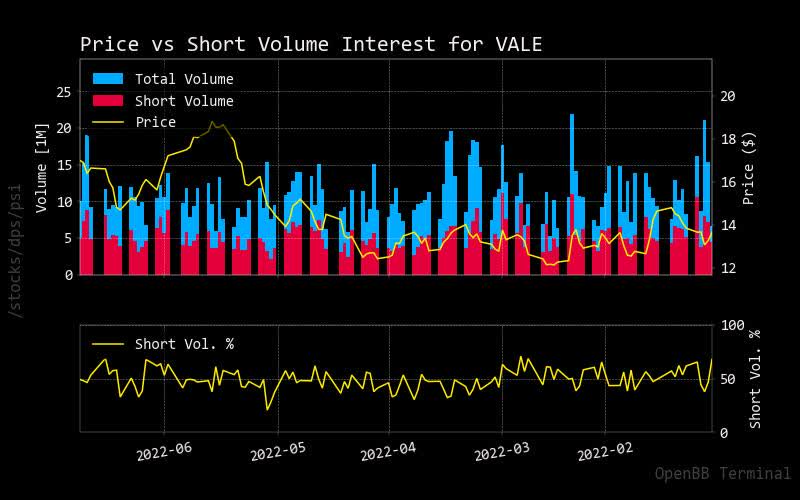
Recommendation
As shown before, common market analyst recommendations can be a factor in pricing. Of course, it is never 100% accurate, but an overwhelming number of analysts have a sell recommendation over daily to monthly time frames. As a result, there are concerns for short-term traders, including day traders but not investors who hold stocks over longer time horizons.
|
Interval |
RECOMMENDATION |
BUY |
SELL |
NEUTRAL |
|
One month |
SELL |
3 |
12 |
11 |
|
One week |
SELL |
3 |
13 |
10 |
|
One day |
SELL |
3 |
14 |
9 |
Source: Trading View
Technical Analysis Patience Will Show Optimal time For Investment
Fibonacci
The Fibonacci orange trend line shows that the price has more to move before a confirmed market entry of Vale stock can occur. Although this may take a while as we move into 2023, it could be expected that a market entry could occur sometime as the stock price starts to move above the Fibonacci trendline.
fibonacci vale (custom platform)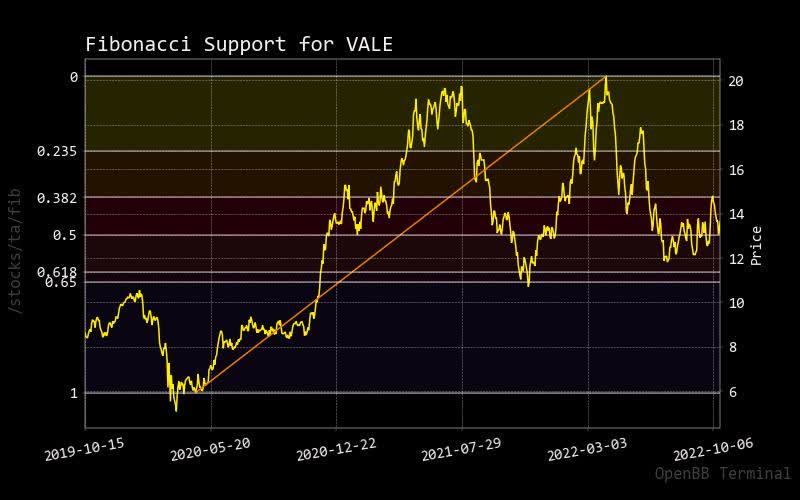
RSI
This indicator is used for critical technical analysis to show relative overbought or undersold stock conditions. As you can see, it oscillates between the two states where we need to wait until a market entry or exit can occur with the technical indicator assistance of the MACD line or Fibonacci trendline.
rsi vale (custom platform)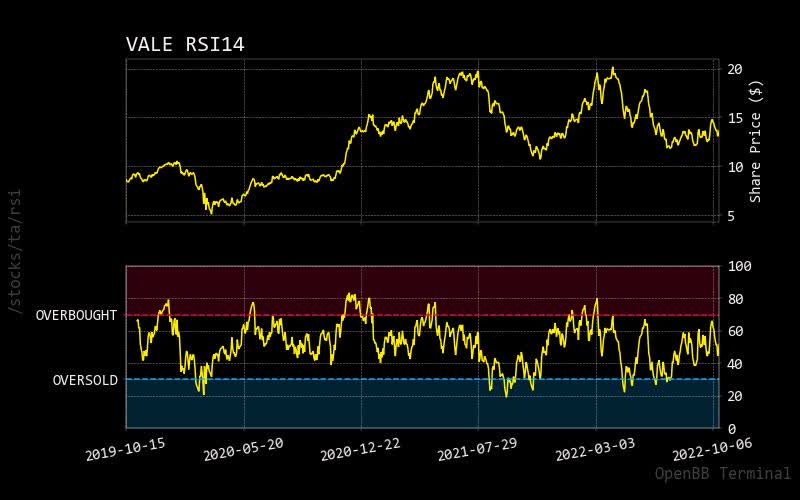
Prediction via AI with Short Term Slight Uptrend
Monte Carlo
Monte Carlo prediction paths show a slight trend up versus a downtrend. This indicates that the stock price of Vale is expected to enter an uptrend in the next few weeks. The normalized distribution is split evenly between the probability of the price moving up or down.
monte carlo vale (custom platform )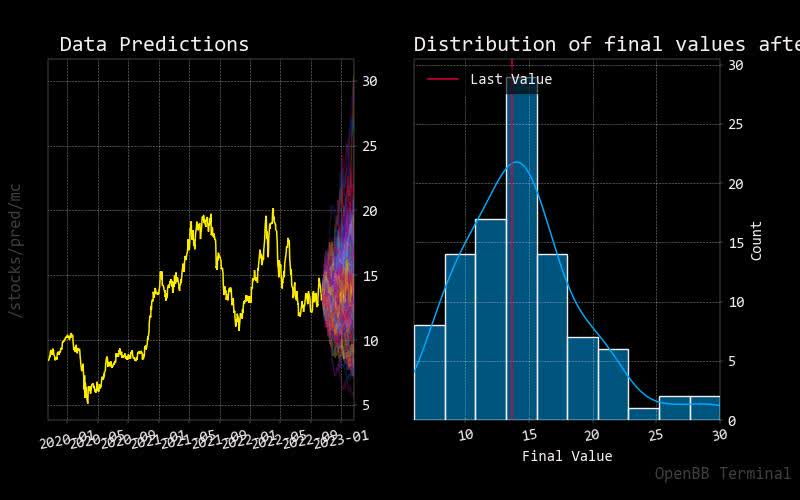
Regression
The 30-day red regression line forecasts hint at a flat condition which could be an accurate move based on other analysis techniques.
regression vale (custom platform )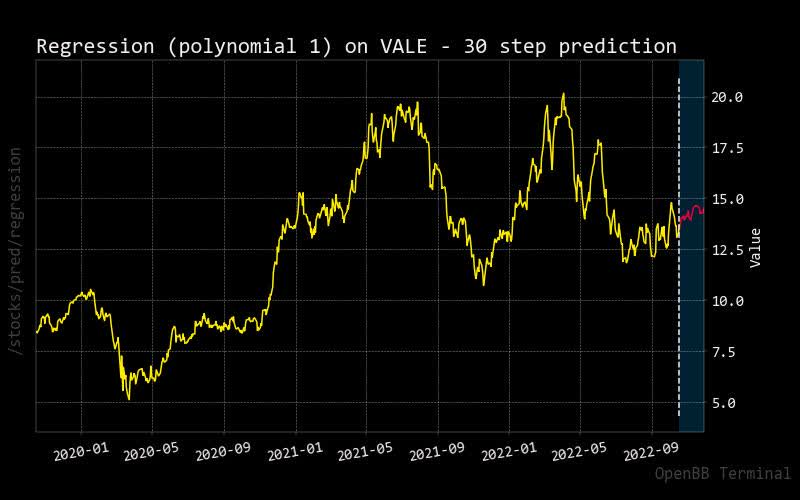
Conclusions results in a miner with confidence with steady profit
Unlike other miners who are pure players in metals like gold or copper, Vale has been a decent profit generator over a long time. This is an outstanding stock owned by buy-and-hold investors. As a result, I would give Vale a buy rating. I recommend looking for miners similar to Vale with a diverse mining portfolio to avoid the high risk of pure-play metal miners like gold or copper.
Be the first to comment