tomspix/iStock via Getty Images
Introduction
The American oil producer VAALCO Energy (NYSE:EGY) released its second quarter of 2022 results on August 10, 2022.
Note: This article is an update of my article published on July 16, 2022. I have followed EGY quarterly since April 2014 with 57 articles and counting.
1 – 2Q’22 production and revenue snapshot
Oil Production was 9,211 Bop/d during 2Q22 (10,587 WI Bop/d), up significantly over the same period a year earlier.
Revenues for 2Q22 were $127.51 million, with oil and gas revenues at $110.99 million. Oil averaged a whopping $113.38 in 2Q22.
EGY 2Q22 highlights (VAALCO Energy)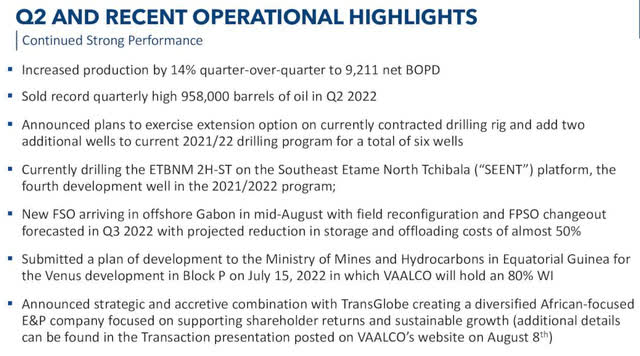
The company sold a record of 958K Barrels of oil this quarter.
EGY Quarterly Oil price history (Fun Trading)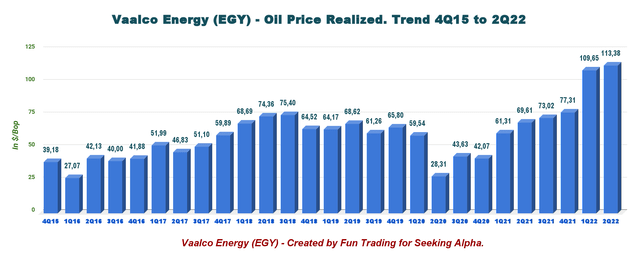
2 – Imminent Merger with TransGlobe Energy
On July 16, 2022, I wrote an article about this issue and why I am not favorable of this deal. I recommend reading my article for more details.
On July 14, 2022, VAALCO Energy and TransGlobe Energy Corporation (TGA) announced they had agreed to merge in an all-stock strategic business transaction valued at $307 million.
EGY TransGlobe VAALCO merger Presentation (VAALCO Energy)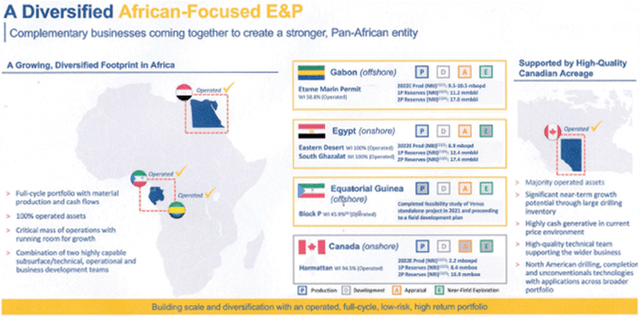
The merger will be potentially completed in Q3-Q4 2022.
EGY TGA Schedule (EGY Presentation)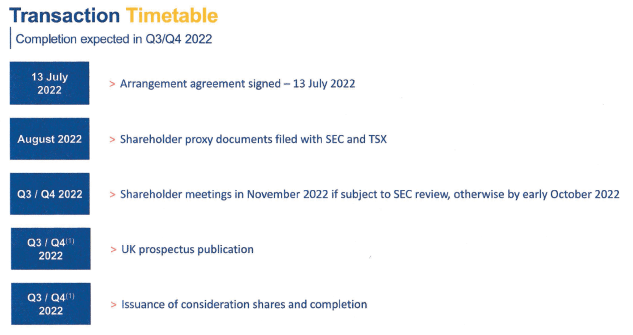
In short, the merger will result in VAALCO stockholders owning approximately 54.5% and TransGlobe shareholders owning about 45.5% of the Combined Company.
3 – Stock performance
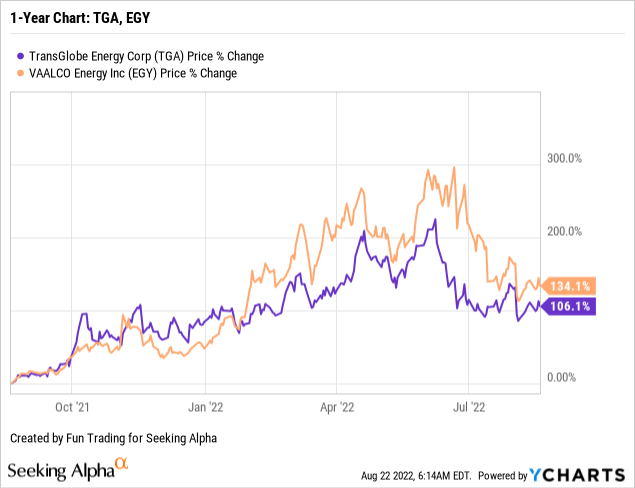
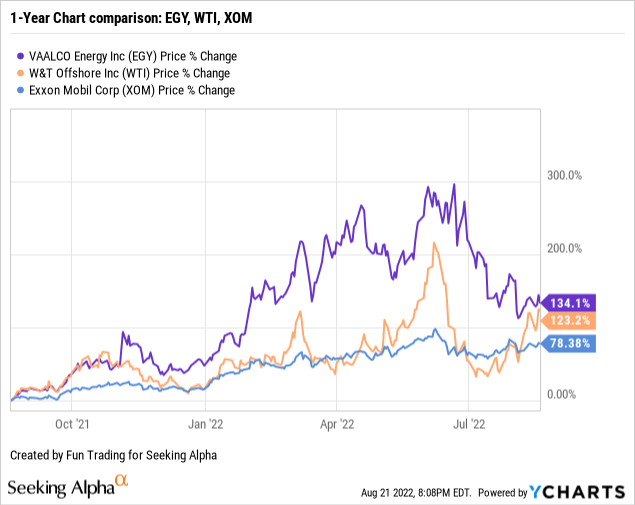
EGY is up 134% on a one-year basis, outperforming most of its peers. However, EGY has retraced significantly since June after announcing the TGA merger.
4 – Investment thesis
I have been in and out of EGY for many years but managed to build up a significant position at a very low price. The company offers essential gross and should be considered an excellent long-term play.
However, the oil sector is highly volatile and particularly unpredictable. Even though EGY presents an excellent profile and solid growth, it will not go up indefinitely without some pause or sporadic downsides.
Thus, I recommend using about 35%-45% of your position to trade EGY short-term LIFO. It has been my recommendation for many quarters.
Finally, the merger with TransGlobe is a problematic issue regarding valuation, and I will need more time to evaluate the impact of this merger.
VAALCO Energy – 2Q’22 Balance Sheet (Preliminary data available) – The Raw Numbers
| VAALCO Energy | 2Q21 | 3Q21 | 4Q21 | 1Q22 | 2Q22 |
| Total Oil and Gas Revenues in $ million | 53.14 | 63.95 | 56.38 | 68.66 | 110.99 |
| Total Revenues EGY in $ million | 47.02 | 55.90 | 65.20 | 77.60 | 127.51 |
| Net income In $ million | 5.88 | 31.72 | 34.36 | 12.16 | 15.10 |
| EBITDA $ million | 25.08 | 27.32 | 30.05 | 45.17 | 81.91 |
| EPS diluted in $/share | 0.10 | 0.53 | 0.58 | 0.21 | 0.25 |
| Operating cash flow in $ million | 11.42 | 33.56 | 3.40 | -0.76 | 69.77 |
| CapEx in $ million | 7.75 | 4.16 | 8.10 | 23.15 | 37.13 |
| Free Cash Flow in $ million | 3.67 | 29.40 | -4.70 | -23.91 | 32.64 |
| Total cash $ million | 22.88 | 52.84 | 48.68 | 18.94 | 53.06 |
| Total Debt and Op. Lease liability (current and non-current) In $ million | 0 | 0 | 0 | 0 | 0 |
| Share Outstanding diluted in millions | 58.57 | 58.92 | 59.00 | 59.18 | 59.36 |
| Quarterly Dividend $/share | 0 | 0 | 0 | 0.0325 | 0.0325 |
| Oil Production | 2Q21 | 3Q21 | 4Q21 | 1Q22 | 2Q22 |
| Oil Production in Boep/d average (“NRI”) | 8,018 | 7,694 | 7,554 | 8,051 | 9,211 |
| Quarterly oil Production K Boe | 642 | 741 | 695 | 725 | 958 |
| Oil price realized $/ Oz | 69.61 | 73.02 | 77.31 | 109.65 | 113.38 |
Data Source: Company 10Q filing.
Analysis: Revenues, Total Debt, Cash, and Preliminary Oil Production
1 – Total revenues were $127.51 million in 2Q’22
EGY Quarterly revenues history (Fun Trading) 1.1 – Quarterly Revenues The chart above shows the massive progress in revenues. Revenues for the second quarter of 2022 were $127.51 million compared to $53.14 million for 2Q21. Net income was $15.10 million or $0.25 per share compared to $5.88 million in 2Q21.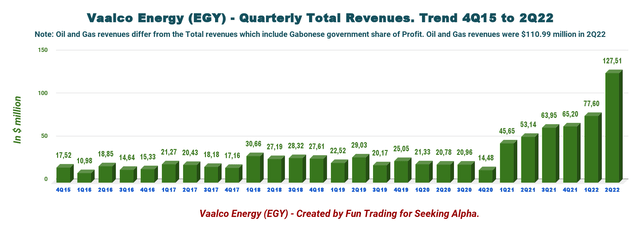
The adjusted net income was $30.7 million in 2Q22, or $0.52 per share, up from $21.12 million a year ago. The Adjusted EBITDAX totaled $60.85 million in 2Q22, an increase of 82% compared with $33.53 million in 2Q21.
George Maxwell, VAALCO’s Chief Executive Officer, said in the conference call:
We had a very strong second quarter, which included record sales volumes of almost 1 million barrels. We also benefited from substantial high Brent pricing over $113 per barrel. This combination allowed us to generate significant cash flow, execute our accretive growth strategy and fully fund our capital commitments. We continue to pay out dividends to our shareholders and with a debt-free balance sheet, we are clearly in a very strong financial position.
1.2 Reserves P1 and P2 increased to 11.2 MMBO
On March 3, 2022, EGY increased year-end 2021 SEC proved reserves by 250% to 11.2 MMBO and increased year-end 2P CPR reserves by 88% to 19.5 MMBO.
EGY 2021 Reserves (VAALCO Energy Presentation)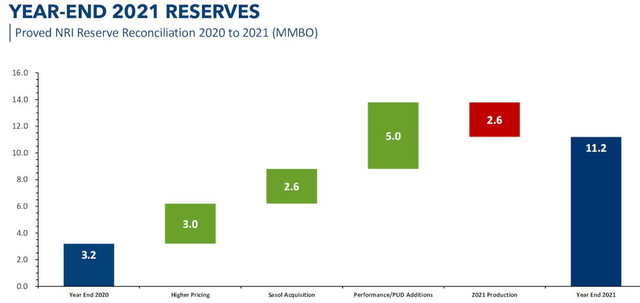
2 – Free cash flow is $32.64 million in 2Q22
EGY Quarterly Free cash flow (Fun Trading)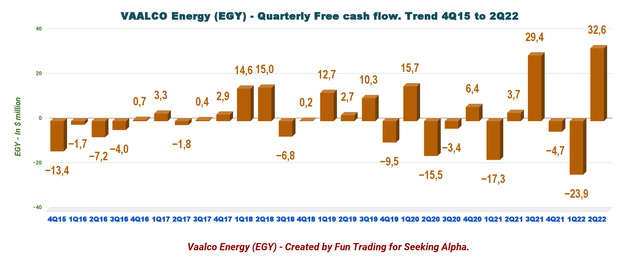
Note: The generic free cash flow is the cash for operating activities minus CapEx.
The trailing 12-month free cash flow for VAALCO is $33.43 million. EGY recorded a second-quarter FCF of $32.64 million.
The company funded $37.13 million cash in CapEx during 2Q22 with cash on hand and cash from operations of $69.77 million. The CapEx was primarily related to costs associated with the 2021/2022 drilling program and the FSO conversion and field reconfiguration investments.
The company announced a quarterly dividend of $0.0325 per share, or a yield of 2.56%.
3 – The company is debt-free and has a cash position of $53.06 million in 2Q’22
EGY Quarterly Cash versus Debt history (Fun Trading) Unrestricted cash and cash equivalents totaled $53.06 million as of June 30, 2022, down from $19.25 million in 1Q21. The company has no debt. The cash is up 64.3% sequentially.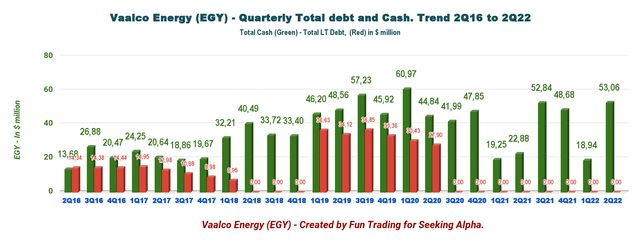
4 – Oil-equivalent production and other considerations
4.1 – Daily oil production NRI
EGY Quarterly Daily production NRI History (Fun Trading)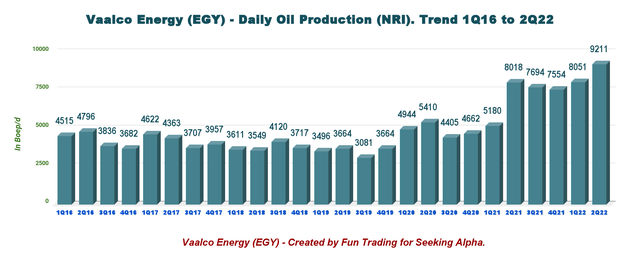
Production for the second quarter of 2022 was 9,211 NRI Bop/d* (or 10,587 working interest WI Bop/d), up 14.9% from the same quarter a year ago and up 14.4% sequentially. VAALCO sold 958K Bo in 2Q22.
Consequently, VAALCO is guiding 3Q22 sales to be between 8,000 and 8,700 barrels of oil per day. EGY 3Q22 Guidance (VAALCO Energy Presentation)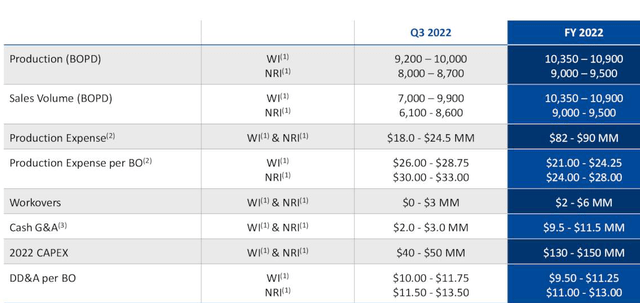
Note*: The production indicated is NRI, which means Net Revenue Interest. It is the total revenue interest that EGY owns in Gabon’s oil and gas lease. The company also reveals the production in WI (working interest), which is higher.
EGY Quarterly Production and price per Bo history (Fun Trading) The oil price realized in the second quarter of 2022 was a whopping $113.38, significantly higher than a year ago.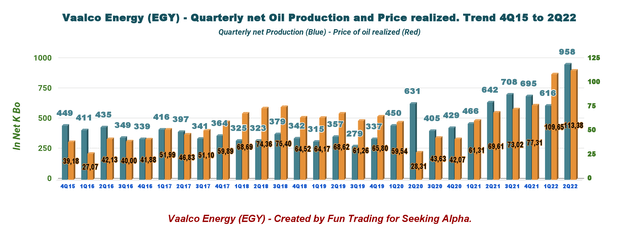
4.2 – New drilling campaign 2022 is ongoing, with the fourth well being drilled now.
EGY Drilling program (VAALCO Energy)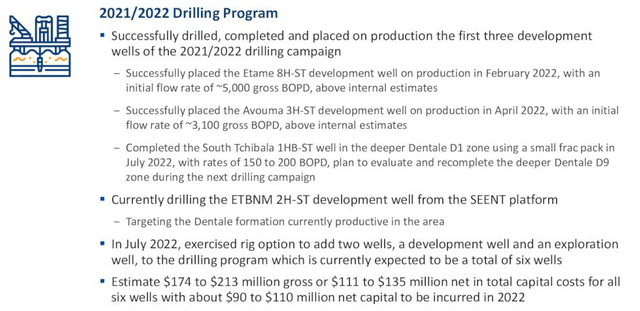
On July 7, 2022, VAALCO Energy announced that
4.3 – The current FPSO charter expires in September 2022 and will replace a new lower-cost FSO solution.
Replacement of the existing Floating Production, Storage, and Offloading unit (“FPSO”) proceeds on schedule, and the new Floating Storage and Offloading (“FSO”) vessel arrived offshore Gabon in mid-August.
CEO George Maxwell said in the press release on July 7, 2022:
The FPSO replacement and full field reconfiguration plans are progressing in-line with our expectations and we look forward to benefiting from the associated cost savings in Q4 2022 and beyond, once those activities have been completed. These activities are expected to save approximately $20-25 million gross per year in operational costs through 2030 resulting in rapid payback and a material impact on production margins and free cash flow going forward.
4.4 – Equatorial Guinea is proceeding with a complete development plan. (Updated from the preceding article.)
VAALCO will have a 45.9% WI in Block P Offshore Equatorial Guinea once the Ministry of Mines and Hydrocarbons approves the new amendment to the PSC. CEO George Maxwell said in the conference call:
In July, we submitted a plan of development in Equatorial Guinea for Block P. We look forward to receiving approval from the Minister of Mines and Hydrocarbons and once the development plan is approved, we expect to add new 2P reserves for the discovery on Block P.
EGY Equatorial Guinea (EGY Presentation) EGY TA Chart (Fun Trading)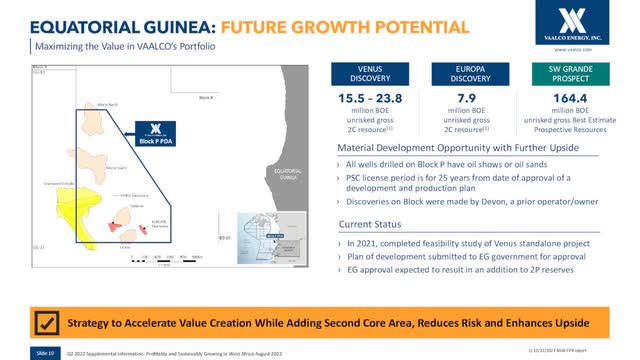
Technical analysis and commentary
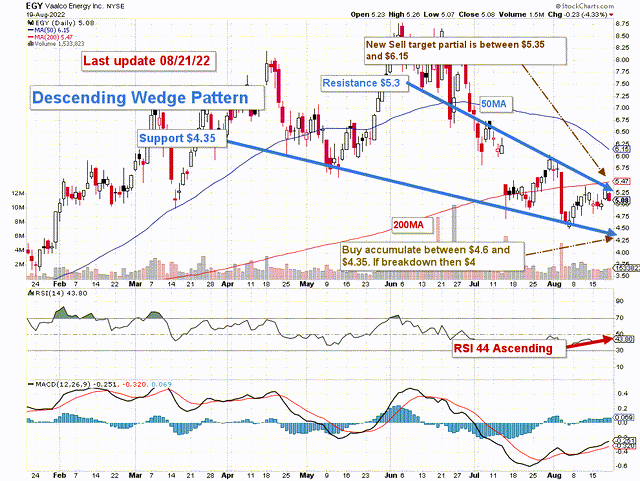
Note: The chart is adjusted for dividends.
EGY forms a descending (falling) wedge pattern with resistance at $5.3 and support at $4.35 with potential lower support at $4. A falling wedge pattern is viewed as a bullish signal in general.
The general strategy that I usually promote in my marketplace, “The gold and oil corner,” is to keep a core long-term position and use about 35%-45% to trade LIFO while waiting for a higher final price target for your core position between $9 and $11.
However, the new merger with TGA is a new subject that could change my long-term target depending on the long-term effect of the merger that I see on the negative side now. I will reevaluate my long-term target after the merger is completed.
If you adopt a short-term strategy to complement your investment, I recommend accumulating EGY below $4.60 with a potential low of $4. Conversely, It is reasonable to take partial profits between $5.35 and $6.15.
Oil prices are solid, but they have retraced significantly from the preceding quarter and may drop even more due to the FED’s action and the risk of a recession that could hamper oil demand.
So watch oil prices like a hawk.
Note: The LIFO method is prohibited under International Financial Reporting Standards (IFRS), though it is permitted in the United States to generally accepted accounting principles (GAAP). Therefore, only US traders can apply this method. Those who cannot trade LIFO can use an alternative by setting two different accounts for the same stocks, one for the long term and one for short-term trading.
Warning: The TA chart must be updated frequently to be relevant. It is what I am doing in my stock tracker. The chart above has a possible validity of about a week. Remember, the TA chart is a tool only to help you adopt the right strategy. It is not a way to foresee the future. No one and nothing can.
Author’s note: If you find value in this article and would like to encourage such continued efforts, please click the “Like” button below as a vote of support. Thanks.


Be the first to comment