

AscentXmedia/iStock via Getty Images
V.F. Corporation (NYSE:VFC) is a fashion and outdoor equipment company which owns well-known brands like Vans, The North Face, Timberland, Dickies and, since late-2020, also Supreme. I covered the company in late-January when it was still trading in the mid-$60 range, and concluded that I see no urgency to invest in the stock at that level. Mostly due to fears of a recession, VFC’s share price has continued to decline but seemed to find a bottom in the mid-$40 range. At this level, it looks to be a great bargain and a lot of risk appears to be priced into the stock. Also, the company currently pays a quarterly dividend of $0.50 per share, which translates to a juicy 4.4% yield at the current share price of $45. As a dividend aristocrat, with almost 50 years of consecutive dividend increases, the payout seems to be virtually guaranteed to continue to grow.
So – what’s not to like and why am I still hesitant to own this seemingly obvious bargain?
A Plethora Of Impairment Charges
Charges related to the impairment of goodwill and other intangible assets, as well as losses associated with the sale of businesses are more the rule rather than the exception at VFC (Figure 1). Since fiscal 2010, which ended December 31, 2010, such charges amounted to $1.4 billion in total. Note that since 2018, the company’s fiscal year ends with the end of the first quarter, which gives rise to the somewhat awkward axis label.
When VFC acquires another company, the cash outflow is accounted for as a cash flow from investing, and a potential future impairment charge is accounted for as a non-cash charge and therefore added back into cash flows from operations. VFC is a holding company, which typically grows through the acquisition of fashion and outdoor equipment brands. Therefore, I take such charges into consideration when calculating VFC’s long-term normalized free cash flow (nFCF).
Figure 1: VFC’s historical charges related to the impairment of goodwill and other intangible assets, as well as business disposal related losses (own work, based on the company’s fiscal 2010 to 2022 10-Ks)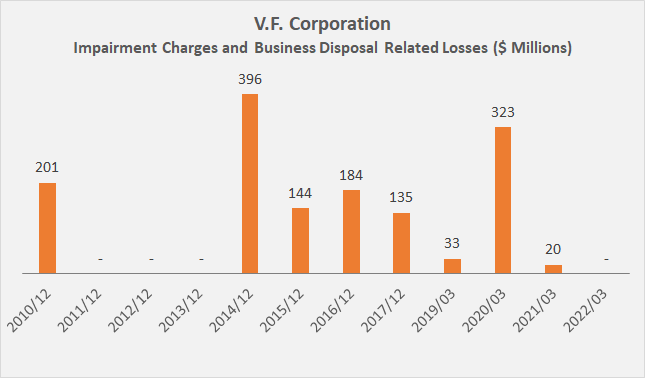
Generous Stock-Based Compensation
According to VFC’s cash flow statement, stock-based compensation expenses amounted to $960 million from fiscal 2010 through fiscal 2022 (ended April 2, 2022), or 6% to 12% of pre-compensation nFCF on an annualized basis (Figure 2). It could rightly be argued that stock-based compensations typically result in lower actual expenses due to dilution compensation than they were originally recognized. Nevertheless, I still consider the position material and therefore take it into account in my calculation of VFC’s nFCF. In case you are interested in this topic, I recently published a dedicated article on this topic.
Figure 2: VFC’s historical stock-based compensation expenses (own work, based on the company’s fiscal 2010 to 2022 10-Ks)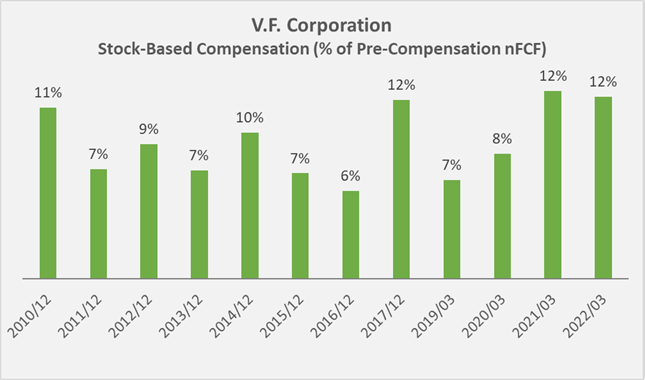
Potentially Lacking Conviction Of Insiders
It can be argued that insider transactions should not be overemphasized. While selling company stock can be a sign of a lack of conviction, insiders may also have a need for liquidity at times and understandably need to sell shares for this purpose. Therefore, I do not overinterpret these transactions, as long as they are not excessive. Insiders buying company stock at low valuations can represent a bullish signal, but I try not to overinterpret these transactions either, especially when they constitute comparatively small amounts.
That being said, I analyzed form 4 filings of VFC’s insiders with the SEC and noticed several purchases in 2022. Director Carucci bought 10,000 shares worth $453,858 and Director McMullen purchased shares worth $647,670 in four transactions on Feb. 03, Mar. 03, May 25 and May 31. In principle, I interpret this as a bullish signal, also because the volume of the transactions does not smell of window dressing purchases.
However, when analyzing insider transactions over the last decade, the picture is far less pleasing. Of the transactions recorded since October 2014, 99% have been sales, most of which have been sales after the exercise of options (Figure 3).
Figure 3: Transactions by VFC insiders since October 2014 (own work, based on the related form 4 filings with the SEC since October 2014)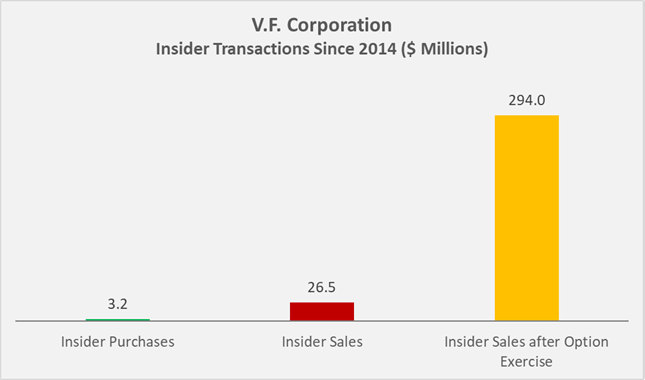
Taken together, I find it difficult to conclude that insiders are bullish on the company, given the significant insider selling in recent years, even though I acknowledge that the majority were sales after option exercises.
It also seems worth mentioning that VFC has been repurchasing its own stock quite regularly, thereby reducing the shares outstanding by 1.1% per year on average. Since fiscal 2010, VFC spent $6.2 billion on share buybacks. I did not notice an inverse correlation between share repurchases and insider sales. Notwithstanding the perfectly understandable need for liquidity, I prefer that insiders sell shares when valuations are high, while at the same time, the company should not engage in buybacks – at least not to a significant extent.
VFC’s Free Cash Flow Went Nowhere Over The Last Decade
In the end, it all boils down to cold, hard cash. Therefore, I evaluate my existing and potential new investments not on the basis of conventional earnings but instead nFCF, thereby taking into account stock-based compensation expenses and recurring impairment and restructuring charges. Moreover, when investigating businesses with considerable working capital requirements with large fluctuations, I take these movements into account as well. Finally, I think it is also important to look at absolute numbers rather than per-share data, as these can mask a stagnant business due to the boosting effect of share buybacks.
Between fiscal 2010 and fiscal 2022, the company generated $12.8 billion in FCF, whereas this amount is reduced to $10.4 billion when accounting for the aforementioned positions. Figure 4 shows that VFC’s nFCF since fiscal 2010 went nowhere. To be fair, however, it should be mentioned that VFC spun off Kontoor Brands Inc. (KTB), which began trading as a separate company in 2019. Existing shareholders at the time received one share of KTB for every seven shares of VFC, so the spun-off earnings power was certainly significant.
Figure 4: VFC’s normalized free cash flow, taking into account stock-based compensation expenses, impairment charges and movements in working capital (own work, based on the company’s fiscal 2010 to fiscal 2022 10-Ks and the full-year earnings release from May 19, 2022)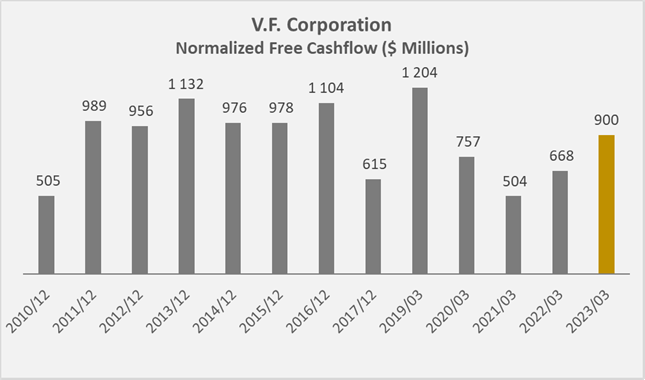
However, unlike nFCF, sales grew at a compound annual growth rate (CAGR) of 4.2% over the last twelve years. Evidently, VFC’s cash flow margin declined, which I find somewhat concerning. The reason for this decline is not found in VFC’s brand portfolio, because the company was able to improve its gross margin from 46.7% in fiscal 2010 to 54.5% in fiscal 2022. Apparently, VFC retains its most profitable brands and sells the laggards, which is a good sign indeed. However, in contrast to increasing gross margin, selling, general and administrative (SG&A) expenses increased disproportionately and peaked at 46% of net sales in fiscal 2021 (Figure 5). Management began cutting costs such that SG&A expenses decreased to 41% of net sales in fiscal 2022 and are expected to remain at that level in fiscal 2023, on projected sales growth of 7%.
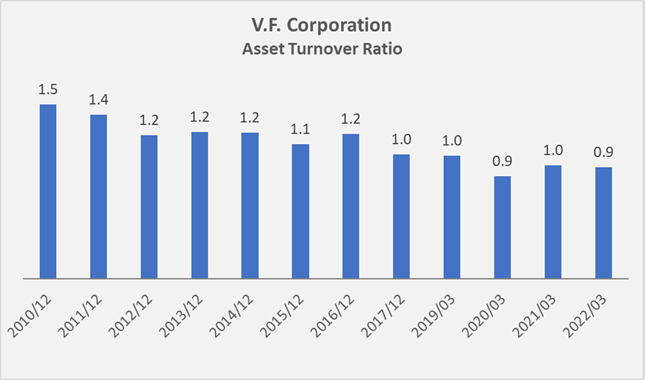
Another sign of declining operating profitability is VFC’s asset turnover ratio, which declined from 1.5 in fiscal 2010 to 1.0 in fiscal 2017, and has not recovered since (Figure 6).
Figure 5: Historical SG&A expenses of VFC, in percent of net sales (own work, based on the company’s fiscal 2010 to 2022 10-Ks and the full-year earnings release from May 19, 2022) Figure 6: Historical asset turnover ratio of VFC (own work, based on the company’s fiscal 2009 to 2022 10-Ks)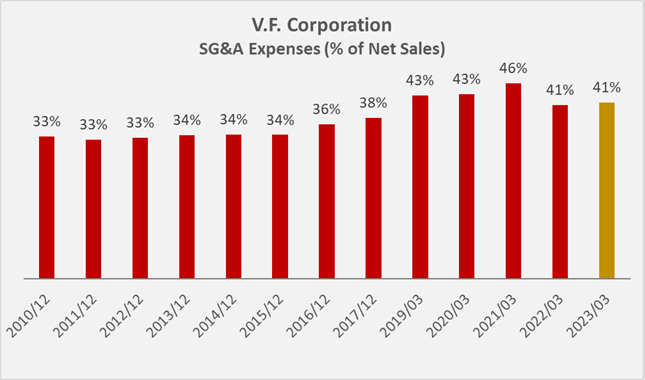
In terms of working capital management, VFC has typically delivered a good performance over the last decade. However, a year before the spinoff of KTB, the company’s cash conversion cycle increased to over 100 days (Figure 7). Apparently, the company is paying its suppliers increasingly faster, which is rarely seen these days, especially among larger corporations. In theory, this could be seen as a sign of a competitive weakness, but I would not overinterpret this metric due to its still reasonable magnitude and the ongoing difficult situation. The fiscal 2022 cash conversion cycle should not necessarily be interpreted as a sign of improvement – the company turned-over its inventory much faster that year and this likely has to do with resolving supply chain issues and markdown of inventory.
Assessing VFC’s performance since the spinoff of KTB is arguably a difficult task, considering the still noticeable consequences of the government-mandated lockdowns in 2020 (and even today in some places such as China, which is an important growth driver for VFC). It does not seem entirely fair to describe VFC’s working capital management as consistently poor when it is largely a consequence of recent events. Also, inventory management over the long term has been very stable at VFC – and I consider an important indicator of sound working capital management.
Figure 7: VFC’s historical cash conversion cycle (own work, based on the company’s fiscal 2009 to 2022 10-Ks)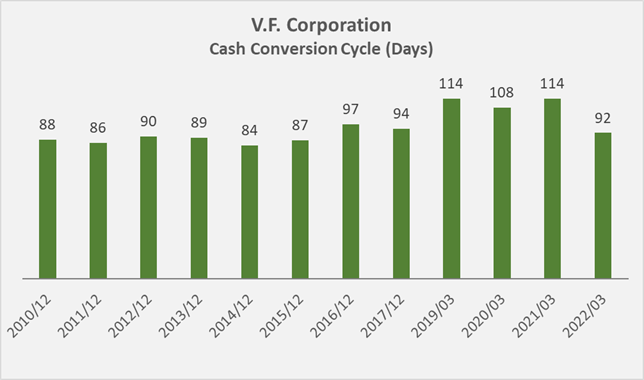
Acknowledging that VFC continues to navigate difficult waters, the company’s declining profitability and lack of nFCF growth – particularly in recent years – should not be overemphasized. However, current investors and potential new investors should monitor the development of key metrics, such as those discussed above, critically and on an ongoing basis.
VFC’s indebtedness should also be closely monitored, as the company continues to grow through acquisitions and has been increasing its leverage quite significantly over the last decade. For example, the acquisition of Supreme in late-2020 for an aggregate base purchase price of $2.1 billion was mostly funded by debt. Also, the pandemic-related lockdowns took their toll on the company’s balance sheet (Figure 8). The company’s debt remains investment grade-rated, even though S&P Global downgraded VFC over the acquisition of Supreme in December 2020. Interest coverage is acceptable at around six times pre-interest nFCF.
Figure 8: VFC’s historical net debt to nFCF ratio (own work, based on the company’s fiscal 2010 to 2022 10-Ks and the full-year earnings release from May 19, 2022)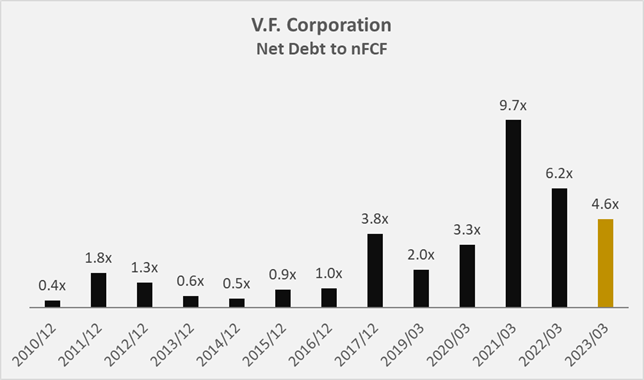
A Soon-To-Be Dividend King With Little Room For Maneuver
As a soon-to-be dividend king, VFC definitely can be described as a shareholder-friendly company. It currently pays $2 per share on an annual basis, which translates to a yield of 4.4%. However, dividend growth has slowed considerably, which is another sign of lackluster cash flow generation capabilities (Figure 9). The payout ratio has been uncomfortably high in recent years, with the company paying out more than its entire nFCF in dividends in fiscal 2017, 2020, 2021 and 2022.
Looking ahead, I doubt the company will break its growth streak, but anything beyond 2% or 3% per year over the next few years seems unduly optimistic to me.
It should also not be forgotten that over the last decade, VFC has returned more cash to shareholders than it actually generated. Since fiscal 2010, the company spent $6.2 billion on buybacks and $6.7 billion on dividends, whereas it only generated $10.4 billion in nFCF. It could rightly be argued that stock-based compensations typically result in lower actual expenses due to dilution compensation than they were originally recognized. However, even when ignoring stock-based compensations and impairment charges altogether, VFC’s free cash flow was just able to cover the cash returns to shareholders since fiscal 2010.
Figure 9: VFC’s historical dividend growth track record (own work, based on the company’s fiscal 2010 to 2022 10-Ks and own estimates)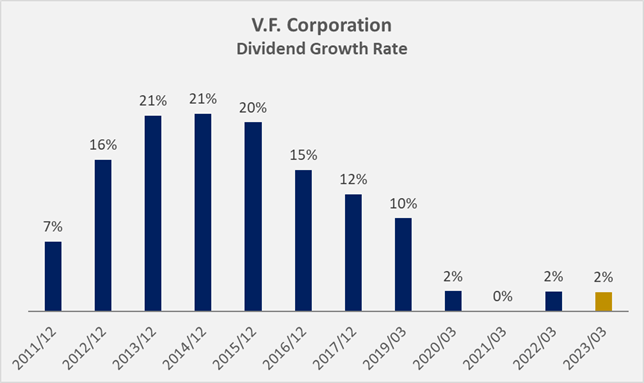
The Bottom Line
The previous sections have painted a picture of a company that lacks cash flow growth, may lack insider conviction, does not manage its working capital optimally, and needs to improve its cost controls further. But there are also positive things to report about VFC.
Personally, I have always admired VFC’s brand portfolio. And even though this is a very subjective observation, Dickies, Timberland and Vans each look back on a multi-decade history of success. The North Face is certainly more than a fashion label, considering the high quality and functionality of the outdoor equipment. Personally, I would prefer to see VFC diversify more into the outdoor equipment business, which I believe to be in a secular uptrend. However, I do realize that competitors like Mammut, Salewa, Patagonia, Scarpa or La Sportiva are most likely not for sale. For example, Mammut Sports Group AG from Switzerland has been acquired by private equity firm Telemos Capital in 2021.
Second, even though VFC is not experiencing cash flow growth, it remains a highly profitable company, which is a testament to its economic moat and the brands’ competitive advantage. Over the last decade, VFC generated returns in excess of its weighted average cost of capital (WACC), as can be learned from Figure 10. The only noticeable – but understandable – exception was fiscal 2021.
Figure 10: VFC’s historical (cash) return on invested capital, compared to its weighted average cost of capital, employing an equity risk premium of 6% (own work, based on the company’s fiscal 2010 to 2022 10-Ks)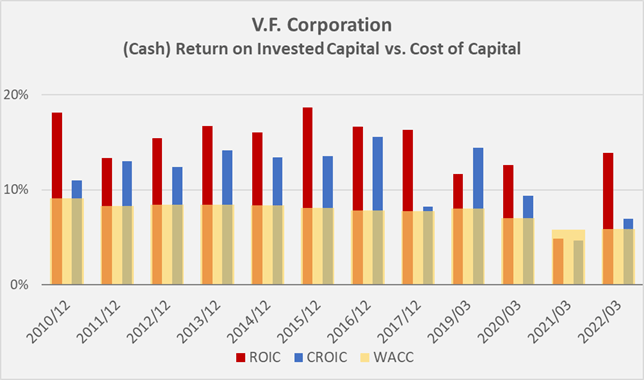
Finally, there is the dividend. I do not want to sound like a yield chaser but a dividend yield of 4.4% in this market is certainly compelling. And even though the Federal Reserve has begun hiking rates, I will let you decide as to how long it can continue and at what point it will reverse the course. With a dividend growth rate currently well below the rate of inflation, a point can be made that VFC is a lackluster dividend growth investment. However, with such a high starting yield, investors will likely find a 2% increase per year acceptable, especially if they are close to retirement or already retired. Taking into account the almost 50-year track record, it is reasonable to assume that the company will get its act together and return to sustainable FCF growth at some point – the brand portfolio certainly offers the right basic condition. Near-term, the company might face additional challenges due to consumers’ lower discretionary income, but ultimately, VFC’s brands certainly possess pricing power.
So ultimately, it comes down to valuation. At $45, the stock is cheap compared to its historical valuations (Table 1).
Table 1: Valuation metrics obtained for VFC on June 21, 2022 (taken from VFC’s stock quote page on Seeking Alpha)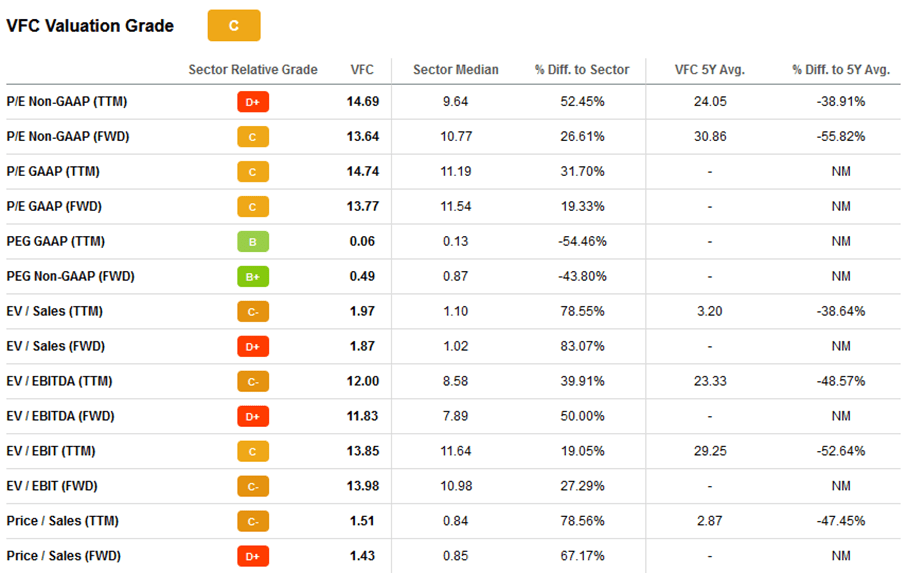
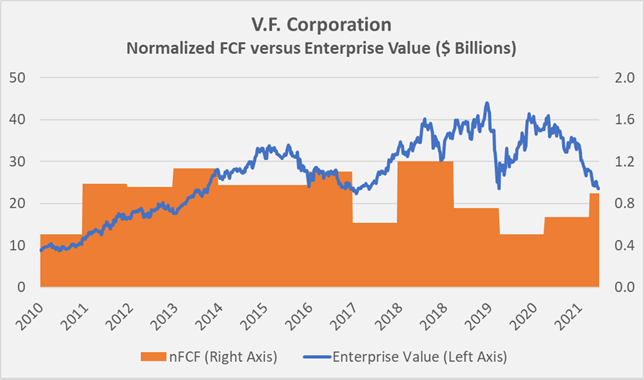
However, it is important to remember that these historical valuations are based on what is (or was) probably the strongest bull market in recent history. There is certainly a lot of risk priced into the stock and I would much rather own VFC at $45 than at $65, let alone at $80+. A P/E ratio of 15 is not expensive for this business. However, I see VFC as a turnaround investment with quite a few uncertainties and headwinds. And in terms of normalized free cash flow, I think I made the point that VFC rightly trades at the level that it seems to constantly revisit since 2013. In this context, Figure 11 and Figure 12 show VFC’s share price and enterprise value in comparison to nFCF, respectively.
Therefore, I still cannot get my head around investing in this, what I consider a good company at its core, currently lacking in execution quality, but with potential for a turnaround. Given the oversold chart picture, VFC could also be called a speculative buy. However, as a long-term investor, I would like to see further signs of operational improvement before considering an investment in VFC – even if this means that I have to pay a higher price.
I am curious to read your thoughts in the comments below. Thanks for reading.
Figure 11: Overlay of VFC’s share price and normalized free Figure 12: Overlay of VFC’s enterprise value and normalized free cash flow per share (own work, based on the company’s fiscal 2010 to 2022 10-Ks and the weekly closing share price of VFC)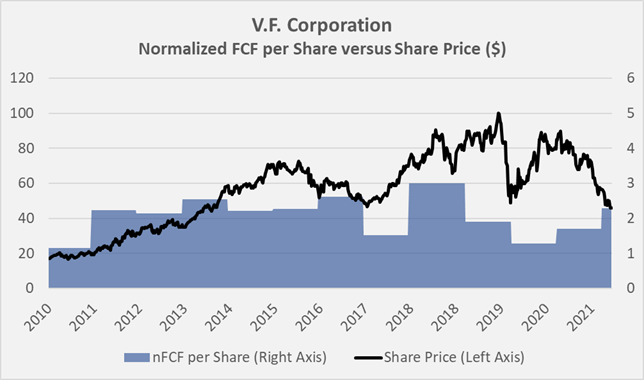
Be the first to comment