

Moussa81/iStock via Getty Images
This article was coproduced with Dividend Sensei.
“Fortunes are made in bear markets.” – Todd Sullivan
2022 has been a difficult year for most investors because the highest inflation in 40 years has triggered what some are calling the bond-pocalypse:
-
2-year yields are up almost 1% in less than two weeks;
-
the fastest increase since the mid-1980s.
Stocks have plunged into a bear market, and recently nothing has been spared the carnage, not commodities, not stocks, not gold or silver, not treasuries, and most certainly not crypto (inflation hedge? I think not).
But let’s not forget that for all the terror brought on by bear markets, they also create incredible opportunities to, as Buffett says,
“Be greedy when others are fearful.”
Is inflation done rising?
According to JPMorgan, the commodities futures markets are pricing in a peak inflation rate of 9.2% in September.
Is the Fed done hiking?
Not by a long shot. The bond market is now pricing in a terminal Fed Funds rate of 4% in March of 2023.
Are we headed for a recession?
70% of economists now expect one in 2023 and so do 75% of Fortune 500 CEOs.
But guess what?
Stocks don’t bottom because bad news stops coming, but because the bad news gets priced in.
Whether stocks bottom at -25% as Goldman and Citi expect, or -30% as Morgan Stanley expect, or -40% in a severe recessionary bear market (Deutsche Bank, Bridgewater, and Soc Gen), there is only so far the world’s best blue-chips can fall.
So whether the bottom comes in the next week, or the next year, it’s very valuable to have a bear market watchlist at the ready, so you can buy when blue-chip bargains are raining from the sky.
So let me share with you the four reasons why V.F. Corporation (NYSE:VFC) is one of my favorite bear market recommendations right now.
I can’t tell you when the market will stop falling, but I can tell you with 80% confidence that anyone buying today is likely to be very happy with the result in 5+ years.
Reason One: V.F. Corp Is The Complete Package
Here is the bottom line up front about VFC.
Reasons To Potentially Buy VFC Today
-
98% quality low-risk 13/13 Ultra SWAN dividend king
-
11th highest quality company on the Master List (98th percentile)
-
100% dividend safety score
-
50-year dividend growth streak
-
4.4% very safe yield
-
0.5% average recession dividend cut risk
-
1.0% severe recession dividend cut risk
-
39% undervalued (potential Ultra Value buy)
-
Fair Value: $75.54 (21.9 PE)
-
13.2X forward earnings vs 18X to 22.5X historical
-
12.0X cash-adjusted earnings
-
A- negative outlook credit rating =2.5% 30-year bankruptcy risk
-
75th industry percentile risk management consensus = Good
-
8% to 14% CAGR margin-of-error growth consensus range
-
11.1% CAGR median growth consensus
-
12% to 14% management guidance
-
5-year consensus total return potential: 15% to 21% CAGR
-
base-case 5-year consensus return potential: 18% CAGR (3X S&P consensus)
-
consensus 12-month total return forecast: 28% (highly conservative, 16.4X earnings)
-
Fundamentally Justified 12-Month Returns: 69% CAGR
VFC is in a 45% bear market that’s not justified by its fundamentals.
VFC Long-Term Growth Outlook Is Intact
|
Metric |
2021 Growth Consensus |
2022 Growth Consensus |
2023 Growth Consensus |
2024 Growth Consensus |
2025 Growth Consensus |
2026 Growth Consensus |
|
Sales |
-10% |
28% |
6% |
7% |
7% |
7% |
|
Dividend |
2% |
2% |
2% |
3% |
12% |
11% (54-Year Streak) |
|
EPS |
-51% |
143% |
6% |
12% |
8% |
9% |
|
Operating Cash Flow |
53% |
-34% |
53% |
34% |
NA |
NA |
|
Free Cash Flow |
94% |
-39% |
64% |
36% |
NA |
NA |
|
EBITDA |
-22% |
68% |
-17% |
10% |
NA |
NA |
|
EBIT (operating income) |
-39% |
136% |
-1% |
11% |
NA |
NA |
(Source: FAST Graphs, FactSet)
Look beyond the recession and you can see a steadily growing company with accelerating dividend growth.
Rolling Returns Since August 1985
VFC is a consistent market beater (13% to 16% annual returns) over the last 37 years but from bear market lows it’s capable of returns as strong as 22% per year for the next 15 years.
VFC 2025 Consensus Total Return Potential
FAST Graphs FAST Graphs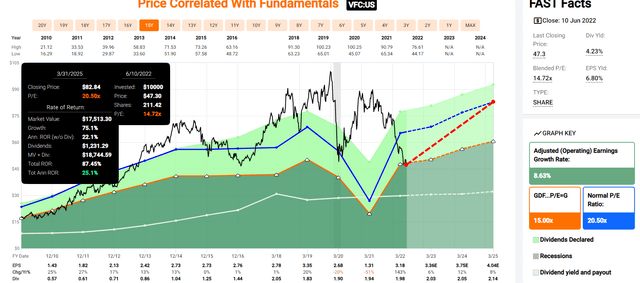
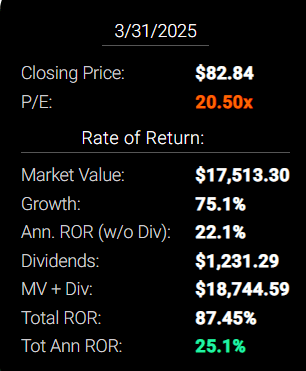
If VFC grows as analysts expect by 2025 and returns to historical mid-range fair value, it could deliver 87% total returns or 25% annually.
-
Buffett-like returns from an anti-bubble blue-chip bargain hiding in plain sight
VFC 2028 Consensus Total Return Potential
FAST Graphs FAST Graphs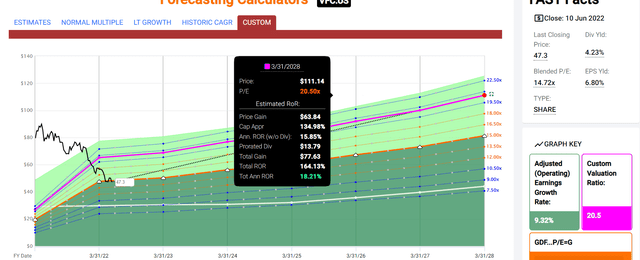
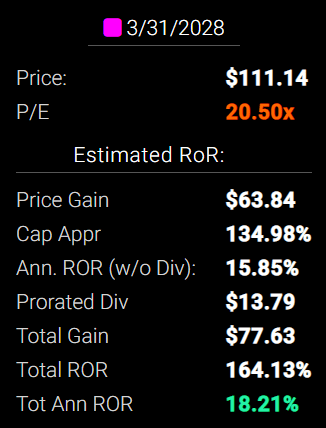
By 2027 if VFC grows as expected (9.3% CAGR) and returns to historical mid-range fair value (20.5X earnings), it could deliver 164% total returns or 18% annually.
-
about 3X the S&P 500 consensus
-
Buffett-like return potential
VFC Long-Term Consensus Total Return Potential
|
Investment Strategy |
Yield |
LT Consensus Growth |
LT Consensus Total Return Potential |
Long-Term Risk-Adjusted Expected Return |
Long-Term Inflation And Risk-Adjusted Expected Returns |
Years To Double Your Inflation & Risk-Adjusted Wealth |
10-Year Inflation And Risk-Adjusted Expected Return |
|
V.F. Corp (Management Guidance) |
4.4% |
13% |
17.4% |
17.4% |
14.9% |
4.8 |
4.02 |
|
V.F. Corp |
4.4% |
11.10% |
15.5% |
10.9% |
8.4% |
8.6 |
2.24 |
|
Nasdaq |
1.0% |
13.9% |
14.9% |
10.4% |
8.0% |
9.0 |
2.15 |
|
Dividend Aristocrats |
2.4% |
8.5% |
10.9% |
7.6% |
5.2% |
14.0 |
1.65 |
|
S&P 500 |
1.7% |
8.5% |
10.2% |
7.1% |
4.7% |
15.4 |
1.58 |
(Sources: Morningstar, FactSet, YCharts)
-
Analysts expect VFC to significantly outperform almost every investment strategy as well as the dividend aristocrats and S&P 500 over the long-term.
-
management guidance is for even stronger returns, potentially 17.4% over the long-term.
A Dividend Growth Powerhouse
|
Portfolio |
1986 Income Per $1,000 Investment |
2022 Income Per $1,000 Investment |
Annual Income Growth |
Starting Yield |
2021 Yield On Cost |
|
V.F. Corp |
$41 |
$2,204 |
11.70% |
4.1% |
220.4% |
(Source: Portfolio Visualizer Premium)
VFC has delivered almost 12% annual income growth for investors for 36 years, turning a 4.1% yield (lower than today) into a 220% yield on cost.
What about the future?
|
Analyst Consensus Income Growth Forecast |
Risk-Adjusted Expected Income Growth |
Risk And Tax-Adjusted Expected Income Growth |
Risk, Inflation, And Tax Adjusted Income Growth Consensus |
|
16.0% |
11.2% |
9.5% |
7.0% |
(Source: DK Research Terminal, FactSet)
Analysts expect 16% income growth from VFC in the future, which adjusted for the risk of it not growing as expected, inflation, and taxes are 7% real expected income growth.
Now compare that to what they expect from the S&P 500.
|
Time Frame |
S&P Inflation-Adjusted Dividend Growth |
S&P Inflation-Adjusted Earnings Growth |
|
1871-2021 |
1.6% |
2.1% |
|
1945-2021 |
2.4% |
3.5% |
|
1981-2021 (Modern Falling Rate Era) |
2.8% |
3.8% |
|
2008-2021 (Modern Low Rate Era) |
3.5% |
6.2% |
|
FactSet Future Consensus |
2.0% |
5.2% |
(Sources: S&P, FactSet, Multipl.com)
What about a 60/40 retirement portfolio?
-
0.5% consensus inflation, risk, and tax-adjusted income growth.
In other words, VFC is expected to generate 3.5X faster real income growth than the S&P 500 and 14X faster income growth than a 60/40.
What inflation-adjusted returns do analysts expect in the future?
Inflation-Adjusted Consensus Return Potential: $1,000 Initial Investment
|
Time Frame (Years) |
7.6% CAGR Inflation-Adjusted S&P Consensus |
8.4% Inflation-Adjusted Aristocrats Consensus |
13.0% CAGR Inflation-Adjusted VFC Consensus |
Difference Between Inflation Adjusted VFC Consensus Vs S&P Consensus |
|
5 |
$1,445.67 |
$1,493.29 |
$1,844.88 |
$399.21 |
|
10 |
$2,089.97 |
$2,229.92 |
$3,403.59 |
$1,313.62 |
|
15 |
$3,021.42 |
$3,329.92 |
$6,279.22 |
$3,257.81 |
|
20 |
$4,367.98 |
$4,972.54 |
$11,584.43 |
$7,216.45 |
|
25 |
$6,314.67 |
$7,425.45 |
$21,371.90 |
$15,057.23 |
|
30 |
$9,128.95 |
$11,088.36 |
$39,428.64 |
$30,299.69 |
(Source: DK Research Terminal, FactSet)
Even if VFC only grows as analysts expect for 10 years, that’s a nearly 3.5X inflation-adjusted return.
|
Time Frame (Years) |
Ratio Aristocrats/S&P Consensus |
Ratio Inflation-Adjusted VFC Consensus Vs S&P Consensus |
|
5 |
1.03 |
1.28 |
|
10 |
1.07 |
1.63 |
|
15 |
1.10 |
2.08 |
|
20 |
1.14 |
2.65 |
|
25 |
1.18 |
3.38 |
|
30 |
1.21 |
4.32 |
(Source: DK Research Terminal, FactSet)
Which is 63% more than the S&P 500 and about 55% more than the dividend aristocrats.
-
while you enjoy a very safe yield that’s nearly 3X higher.
VFC Investment Decision Score
Dividend Kings Dividend Kings
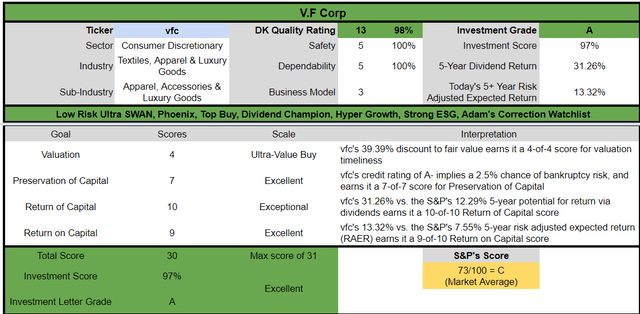
For anyone comfortable with its risk profile, VFC has:
-
39% discount vs 6% market premium = 33% better valuation
-
4.4% yield vs 1.7% yield (and a much safer yield at that) 2.5X the market’s yield
-
potentially 50% higher long-term return potential than S&P 500 overtime
-
about 2X better risk-adjusted expected return over the next five years
-
31% of your investment repaid in the first five years in consensus dividends
Reason Two: VFC Is One Of The Best Companies On Earth
There are many ways to measure safety and quality, and I factor in pretty much all of them.
The Dividend Kings’ overall quality scores are based on a 253-point model that includes:
-
Dividend safety
-
Balance sheet strength
-
Credit ratings
-
Credit default swap medium-term bankruptcy risk data
-
Short and long-term bankruptcy risk
-
Accounting and corporate fraud risk
-
Profitability and business model
-
Growth consensus estimates
-
Management growth guidance
-
Historical earnings growth rates
-
Historical cash flow growth rates
-
Historical dividend growth rates
-
Historical sales growth rates
-
Cost of capital
-
GF Scores
-
Long-term risk-management scores from MSCI, Morningstar, FactSet, S&P, Reuters’/Refinitiv, and Just Capital
-
Management quality
-
Dividend-friendly corporate culture/income dependability
-
Long-term total returns (a Ben Graham sign of quality)
-
Analyst consensus long-term return potential.
In fact, it includes over 1,000 fundamental metrics, including the 12 rating agencies we use to assess fundamental risk.
-
credit and risk management ratings make up 41% of the DK safety and quality model
-
dividend/balance sheet/risk ratings make up 82% of the DK safety and quality model.
How do we know that our safety and quality model works well?
During the two worst recessions in 75 years, our safety model predicted 87% of blue-chip dividend cuts, the ultimate baptism by fire for any dividend safety model.
How does VFC score on our comprehensive safety and quality models?
Dividend Safety
|
Rating |
Dividend Kings Safety Score (149 Point Safety Model) |
Approximate Dividend Cut Risk (Average Recession) |
Approximate Dividend Cut Risk In Pandemic Level Recession |
|
1 – unsafe |
0% to 20% |
over 4% |
16+% |
|
2- below average |
21% to 40% |
over 2% |
8% to 16% |
|
3 – average |
41% to 60% |
2% |
4% to 8% |
|
4 – safe |
61% to 80% |
1% |
2% to 4% |
|
5- very safe |
81% to 100% |
0.5% |
1% to 2% |
|
VFC |
100% |
0.5% |
1.00% |
|
Risk Rating |
Low Risk (71st industry percentile consensus) |
A- stable outlook credit rating 2.5% 30-year bankruptcy risk |
20% OR LESS Max Risk Cap Recommendation |
Long-Term Dependability
|
Company |
DK Long-Term Dependability Score |
Interpretation |
Points |
|
Non-Dependable Companies |
21% or below |
Poor Dependability |
1 |
|
Low Dependability Companies |
22% to 60% |
Below-Average Dependability |
2 |
|
S&P 500/Industry Average |
61% (58% to 70% range) |
Average Dependability |
3 |
|
Above-Average |
71% to 80% |
Very Dependable |
4 |
|
Very Good |
81% or higher |
Exceptional Dependability |
5 |
|
VFC |
100% |
Exceptional Dependability |
5 |
Overall Quality
|
VFC |
Final Score |
Rating |
|
Safety |
100% |
5/5 very safe |
|
Business Model |
60% |
3/3 wide moat |
|
Dependability |
100% |
5/5 exceptional |
|
Total |
98% |
13/13 Ultra SWAN Dividend King |
|
Risk Rating |
3/3 Low Risk |
|
|
20% OR LESS Max Risk Cap Rec |
5% Margin of Safety For A Potentially Good Buy |
How high quality is VFC?
It’s the 11th highest quality company on the Master List, 98th percentile.
How impressive is that?
The DK 500 Master List includes the world’s highest quality companies including:
-
All dividend champions
-
All dividend aristocrats
-
All dividend kings
-
All global aristocrats (such as BTI, ENB, and NVS)
-
All 13/13 Ultra Swans (as close to perfect quality as exists on Wall Street)
-
50 of the world’s best growth stocks.
In other words, even among the world’s best companies, VFC is higher quality than 98% of them.
Why I Trust V.F. Corp And So Can You
In 2019, VFC announced guidance for the next five years (still in effect).
-
7% to 8% sales growth
-
12% to 14% EPS growth
-
14% to 16% CAGR total returns
-
back then VFC yielded 2%
-
now it yields almost twice as much
-
total return guidance now: 16.4% to 18.4% CAGR
-
on par with the greatest investors in history, like John Templeton
-
15.8% CAGR returns from 1953 to 1992
VFC Earnings Update
“VF Is Facing Logistical and Other Challenges, but Its Brands Provide a Competitive Advantage” – Morningstar
“VF revenue of $11.8 billion increased 27%, which represents high single-digit organic growth relative to pre-pandemic levels. We achieved this growth despite continued headwinds from COVID impacting Asia-Pacific and the emergence of new challenges, including geopolitical tensions and acceleration in inflation, and lower consumer sentiment globally.
We generated record sales for five of our brands, representing over 70% of our revenue and highlighted by incredible growth at The North Face. The group’s diversified and broad-based performance reflects the strength of our brands and the outstanding efforts of our teams across all core areas of the organization…
The North Face revenue grew 32% for the year, surpassing the key $3 billion milestone for the first time with broad-based double-digit growth across all regions in the year and fourth quarter. Business in EMEA passed the $1 billion mark for the first time. Globally, we continue to see strong growth across channels and categories with momentum in both on-mountain and off-mountain product…
Consumer engagement remains a key focus with The North Face loyalty program growing to over 13 million members globally and representing nearly half of our D2C (direct-to-consumer) revenue…
Timberland grew revenue by 20% in fiscal ‘22, representing growth above pre-pandemic levels… The brand is achieving more balanced growth with apparel being the strongest category in Q4 and up to 20% of quarterly sales…
We grew Dickies revenue by 19% to $838 million for the year while also driving strong profit growth and margin expansion…
Altra accelerated strongly in fiscal ‘22 across channels and geographies, growing by 57% versus fiscal ‘21, up 84% versus fiscal ‘20…
Smartwool also continued to gain momentum in fiscal ‘22, with revenue up 40%, representing strong double-digit growth across both the Americas and EMEA…
Now on to Vans, which despite growing by 19% over the full year, did not deliver on our initial expectations. During the year, the brand achieved double-digit growth in EMEA; 30% growth in Progression footwear styles; and further growth of Vans Family, which passed 22 million global members…
Finally, on Supreme. The brand’s performance was softer than planned, reflecting a significant impact from supply chain disruption. That said, the brand’s full price brick-and-mortar business rose by 35%…
In addition to growing revenue by 27%, we again drove strong execution throughout the P&L. We expanded gross margins by 150 basis points to 54.8% and operating margins by over 500 basis points to 13.1%, comparable to pre-pandemic levels, and grew EPS by 143%…
We returned a total of $244 million to shareholders during the quarter, including dividends of $194 million for a total of over $1.1 billion returned to shareholders during the fiscal year.” – CEO, Q4 conference call (emphasis added).
Despite major supply chain challenges, VFC’s core brands are thriving and its newer brands are growing at 30+%.
-
the company remains well-positioned to keep winning market share in the $500 billion apparel market
VFC is doing well overseas, where nearly 50% of sales now come from.
Asia remains a challenging location, with supply chains crimped by China’s ongoing lockdowns.
But, overall, the VFC thesis appears to be intact and analysts raised their growth estimates for the company by 3% following earnings.
Quantitative Analysis: The Math Backing Up The Investment Thesis
Ben Graham recommended combining qualitative (the story) analysis with quantitative analysis looking at the past, present, and likely future.
VFC Credit Ratings
|
Rating Agency |
Credit Rating |
30-Year Default/Bankruptcy Risk |
Chance of Losing 100% Of Your Investment 1 In |
|
S&P |
A- Negative |
2.50% |
40.0 |
|
Moody’s |
Baa1 (BBB+ equivalent) |
5.00% |
20.0 |
|
Consensus |
A- stable |
3.75% |
26.7 |
(Sources: S&P, Moody’s)
VFC has an A-credit rating from S&P, and Moody’s will likely upgrade their rating in the next few years.
On June 7th, S&P revised its outlook on VFC to negative from stable, indicating a 33% chance of a downgrade to BBB+.
“U.S.-based VF Corp. will likely have to increase debt by more than $845 million to pay the assessed tax in order to appeal an unfavorable decision from the U.S. Tax Court regarding its post-acquisition restructuring of Timberland Co. in September 2011.
The Tax Court decision states that the full value of the Timberland intellectual property (‘IP’) should have been taxable upon the date of transfer to Switzerland and not annually as VF has paid. The company intends to appeal this outcome and if the decision is reversed, the company would receive a refund of the assessed tax along with accrued interest.
We revised the outlook to negative from stable to reflect elevated leverage above our prior expectations combined with the company’s acquisitive growth strategy, which has become somewhat less conservative. At the same time, we affirmed the ‘A-‘ issuer credit rating and all issue-level ratings on the company.
The negative outlook indicates we could lower the ratings within the next two years if the company does not sustain leverage in the low-2x area. This could occur if the company pursues an acquisition while its leverage is elevated in the high-2x from paying the required tax assessment in response to the unfavorable decision.” – S&P (emphasis added).
S&P wants to see debt/EBITDA in the low 2s to maintain the A- credit rating.
VFC Leverage Consensus Forecast
|
Year |
Debt/EBITDA |
Net Debt/EBITDA (3.0 Or Less Safe According To Credit Rating Agencies) |
Interest Coverage (8+ Safe) |
|
2020 |
2.38 |
1.53 |
18.94 |
|
2021 |
5.66 |
4.84 |
5.84 |
|
2022 |
2.99 |
2.28 |
11.82 |
|
2023 |
2.82 |
2.09 |
12.95 |
|
2024 |
2.56 |
1.89 |
15.18 |
|
2025 |
2.08 |
1.72 |
16.46 |
|
Annualized Change |
-2.66% |
2.40% |
-2.77% |
(Source: FactSet Research Terminal)
VFC tool on a lot of debt in the pandemic as did many companies. But leverage has rapidly declined and is expected to keep trending lower.
Based on analyst consensus estimates, VFC should regain its A-stable outlook within the next two years.
VFC Balance Sheet Consensus Forecast
|
Year |
Total Debt (Millions) |
Cash |
Net Debt (Millions) |
Interest Cost (Millions) |
EBITDA (Millions) |
Operating Income (Millions) |
|
2020 |
$3,838 |
$1,369 |
$2,469 |
$71 |
$1,613 |
$1,345 |
|
2021 |
$5,721 |
$816 |
$4,894 |
$127 |
$1,011 |
$742 |
|
2022 |
$5,421 |
$1,276 |
$4,145 |
$131 |
$1,816 |
$1,549 |
|
2023 |
$5,504 |
$1,467 |
$4,077 |
$136 |
$1,953 |
$1,761 |
|
2024 |
$5,443 |
$1,626 |
$4,004 |
$133 |
$2,123 |
$2,019 |
|
2025 |
$4,853 |
$1,202 |
$4,023 |
$140 |
$2,334 |
$2,304 |
|
2026 |
NA |
NA |
NA |
$130 |
$2,600 |
NA |
|
2027 |
NA |
NA |
NA |
$110 |
$2,784 |
NA |
|
Annualized Growth |
4.80% |
-2.57% |
10.26% |
6.45% |
8.11% |
11.37% |
(Source: FactSet Research Terminal)
Even including the pandemic, VFC is growing its cash flows at impressive rates.
VFC Bond Profile
-
$3.2 billion in liquidity
-
well-staggered debt maturities (little problem refinancing maturing bonds)
-
100% unsecured bonds (maximum financial flexibility)
-
bond investors are so confident in VFC’s long-term energy transition plan they are willing to lend to it for 15.4 years at 5.7% (rising as rates rise)
-
1.93% average borrowing cost
-
-0.54% inflation-adjusted borrowing costs vs 15.4% returns on capital
-
VFC’s borrowing costs are so low that adjusted for inflation, it’s being paid to borrow to grow its business.
VFC Credit Default SWAPs: Real-Time Fundamental Risk Analysis From The Bond Market
FactSet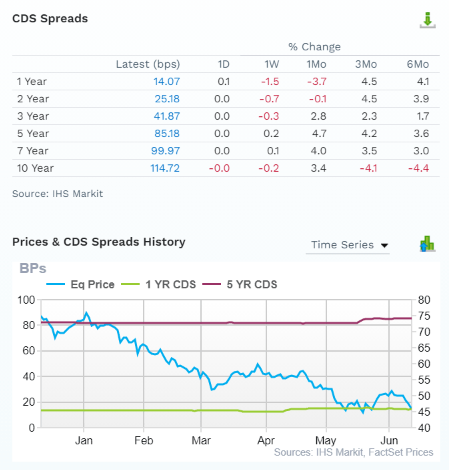
Credit default SWAPs are the insurance policies bond investors take out against default:
-
they represent real-time fundamental risk assessment from the “smart money” on Wall Street
-
VFC’s fundamental risk has been rock steady for six months
-
while the price fell off a cliff
-
analysts, rating agencies, and the bond market all agree
-
VFC’s thesis is intact
-
25 analysts, 7 rating agencies, and the bond market make up our VFC expert consensus
-
how we track fundamental risk in real-time
-
to ensure high-probability/low-risk investment recommendations.
VFC GF Score: The Newest Addition To The DK Safety And Quality Model
The GF Score is a ranking system that has been found to be closely correlated to the long-term performances of stocks by back testing from 2006 to 2021.” – GuruFocus
GF Score takes five key aspects into consideration. They are:
-
Financial Strength
-
Profitability
-
Growth
-
Valuation
-
Momentum
VFC’s decent score of 63/100 GF score confirms overall strong fundamentals though short-term challenges including its supply chain woes in Asia.
VFC Profitability: Wall Street’s Favorite Quality Proxy
Historically VFC has maintained profitability in the top 30% of its peers.
VFC Trailing 12-Month Profitability Vs Peers
|
Metric |
TTM |
Industry Percentile |
Major Apparel Companies More Profitable Than VFC (Out Of 1,075) |
|
Gross Margins |
54.51% |
85.46 |
156 |
|
Operating Margin |
13.78% |
81.56 |
198 |
|
Net Margin |
11.71% |
81.84 |
195 |
|
Return On Equity |
40.52% |
94.89 |
55 |
|
Return On Assets |
10.19% |
83.07 |
182 |
|
Returns On Invested Capital |
12.76% |
78.68 |
229 |
|
Return On Capital (Greenblatt) |
48.23% |
91.78 |
88 |
|
Return On Capital Employed |
15.70% |
71.84 |
303 |
|
Average |
21.84% |
83.38 |
179 |
(Source: GuruFocus Premium)
In the last year, VFC’s profitability has soared to the top 16% of its industry.
Adjusting for the natural cyclicality of this industry, VFC’s industry-leading profitability has been stable for over 30 years, confirming a wide and stable moat.
VFC Profit Margin Consensus Forecast
|
Year |
FCF Margin |
EBITDA Margin |
EBIT (Operating) Margin |
Net Margin |
Return On Capital Expansion |
Return On Capital Forecast |
|
2020 |
5.0% |
15.4% |
12.8% |
10.2% |
1.24 |
|
|
2021 |
10.8% |
10.9% |
8.0% |
5.6% |
TTM ROC |
48.23% |
|
2022 |
5.2% |
15.3% |
13.1% |
10.5% |
Latest ROC |
25.04% |
|
2023 |
7.1% |
15.7% |
14.1% |
10.4% |
2025 ROC |
60.05% |
|
2024 |
9.6% |
15.9% |
15.1% |
10.8% |
2025 ROC |
31.17% |
|
2025 |
11.5% |
16.5% |
16.3% |
11.2% |
Average |
45.61% |
|
2026 |
NA |
17.2% |
0.0% |
11.4% |
Industry Median |
10.57% |
|
2027 |
NA |
17.3% |
0.0% |
11.6% |
VFC/Industry Median |
4.32 |
|
Annualized Growth |
18.07% |
1.66% |
4.90% |
1.88% |
Vs S&P |
3.12 |
|
Annualized Growth (Post Pandemic) |
30.59% |
2.39% |
7.58% |
2.01% |
(Source: FactSet Research Terminal)
VFC’s margins are expected to recover from the pandemic and keep growing to record highs.
Return on capital is annual pre-tax profit/operating capital (the money it takes to run the business). ROC is Greenblatt’s gold standard proxy for quality and “moatiness.”
-
S&P 500 ROC is 14.6%
-
for each $1 it takes to run the average S&P company they generate $0.146 in annual pre-tax profit
-
it takes about 6.5 years for new investments to pay for themselves
For VFC ROC was 48% in the last year and is expected to remain stable over the coming years.
-
for every $1 it takes to run VFC it is currently generating $0.48 in annual pre-tax profit
-
investments take about 2 years to pay for themselves
By the definition of one of the greatest investors in history, VFC is about 4X higher quality than its peers and 3X higher quality than the S&P 500.
Reason Three: An Amazing Long-Term Growth Runway
VFC has a $500 billion growth market and currently has a 1% market share. That creates a decades-long growth runway that analysts expect the company to successfully take advantage of.
VFC Medium-Term Growth Consensus Forecast
|
Year |
Sales |
Free Cash Flow |
EBITDA |
EBIT (Operating Income) |
Net Income |
|
2020 |
$10,489 |
$527 |
$1,613 |
$1,345 |
$1,072 |
|
2021 |
$9,239 |
$1,000 |
$1,011 |
$742 |
$514 |
|
2022 |
$11,842 |
$613 |
$1,816 |
$1,549 |
$1,248 |
|
2023 |
$12,472 |
$883 |
$1,953 |
$1,761 |
$1,295 |
|
2024 |
$13,344 |
$1,284 |
$2,123 |
$2,019 |
$1,440 |
|
2025 |
$14,148 |
$1,631 |
$2,334 |
$2,304 |
$1,579 |
|
2026 |
$15,138 |
NA |
$2,600 |
NA |
$1,728 |
|
2027 |
$16,129 |
NA |
$2,784 |
NA |
$1,878 |
|
Annualized Growth |
6.34% |
25.35% |
8.11% |
11.37% |
8.34% |
|
Annualized Growth (Post Pandemic) |
6.37% |
38.57% |
8.92% |
14.15% |
8.52% |
|
Cumulative Over The Next 3 Years |
$39,964 |
$3,798 |
$6,410 |
$6,084 |
$4,314 |
(Source: FactSet Research Terminal)
VFC’s growth is expected to be very strong now that the pandemic is ending.
Growth rates with and without the pandemic are similar.
VFC’s dividend growth is expected to start accelerating in 2024 and boom in 2025 as its payout ratio comes down.
VFC Dividend Growth Consensus Forecast
|
Year |
Dividend Consensus |
EPS Consensus |
EPS Payout Ratio |
Retained (Post-Dividend) Earnings |
Buyback Potential |
Debt Repayment Potential |
|
2022 |
$1.98 |
$3.18 |
62.3% |
$466 |
2.62% |
8.6% |
|
2023 |
$2.02 |
$3.34 |
60.5% |
$512 |
2.88% |
9.3% |
|
2024 |
$2.07 |
$3.75 |
55.2% |
$652 |
3.67% |
11.8% |
|
2025 |
$2.13 |
$4.10 |
52.0% |
$764 |
4.30% |
14.0% |
|
2026 |
$2.45 |
$4.45 |
55.1% |
$776 |
4.37% |
16.0% |
|
2027 |
$2.68 |
$4.88 |
54.9% |
$854 |
4.80% |
17.6% |
|
Total 2022 Through 2027 |
$13.33 |
$23.70 |
56.2% |
$4,023.56 |
22.63% |
73.10% |
|
Annualized Rate |
6.24% |
8.94% |
-2.48% |
12.89% |
12.89% |
15.41% |
(Source: FactSet Research Terminal)
Credit rating agencies consider 60% a safe payout ratio for this industry.
VFC normally maintains a very safe 40% payout ratio (30% to 50% historical range).
Analysts expect the payout ratio to return to safe levels by 2024 and fall to 55% by 2027.
$4.0 billion in consensus post-dividend retained earnings is enough to pay off 73% of current debt or buy back 23% of shares at current valuations.
VFC’s historical buybacks over the past decade have been at a 1.3% rate.
|
Time Frame (Years) |
Net Buyback Rate |
Shares Remaining |
Net Shares Repurchased |
Each Share You Own Is Worth X Times More (Not Including Future Growth And Dividends) |
|
5 |
1.3% |
93.67% |
6.33% |
1.07 |
|
10 |
1.3% |
87.73% |
12.27% |
1.14 |
|
15 |
1.3% |
82.18% |
17.82% |
1.22 |
|
20 |
1.3% |
76.97% |
23.03% |
1.30 |
|
25 |
1.3% |
72.10% |
27.90% |
1.39 |
|
30 |
1.3% |
67.53% |
32.47% |
1.48 |
(Source: DK Research Terminal, YCharts)
1.3% annual net buybacks may not sound like much, but it adds up over time.
Over the next 30 years, it could mean 33% fewer shares and a 50% increase in the intrinsic value for remaining shares not counting future EPS and dividend growth.
VFC Long-Term Growth Outlook
-
10% to 11.1% growth consensus range (five sources)
-
the median estimate from all 25 analysts is 11.1%
-
management guidance 12% to 14%
How accurate are analyst forecasts for this company?
-
Smoothing for outliers historical analyst margins-of-error are 20% to the downside and 20% to the upside
-
margin-of-error adjusted growth guidance range: 8% to 14% CAGR (including management guidance)
-
70% statistical probability that VFC grows 8% to 14% over time
-
excluding the pandemic, VFC’s historical growth rate is about 10.6% CAGR
Management and analysts think slightly faster growth is likely thanks to VFC’s strong brand building and great direct-to-consumer execution.
Reason Four: VFC Is A Wonderful Company At A Wonderful Price
For 20 years tens of millions of investors have paid between 18 and 22.5X earnings for VFC.
-
91% statistical probability that its intrinsic value is within this range
|
Metric |
Historical Fair Value Multiples (15-Years) |
2021 |
2022 |
2023 |
2024 |
2025 |
12-Month Forward Fair Value |
|
25- Year Average Yield |
2.47% |
$77.33 |
$80.97 |
$80.97 |
$85.83 |
$95.95 |
|
|
Earnings |
20.50 |
$55.76 |
$67.65 |
$74.62 |
$82.41 |
$89.38 |
|
|
Average |
$64.80 |
$73.71 |
$77.67 |
$84.09 |
$92.55 |
$75.54 |
|
|
Current Price |
$45.78 |
||||||
|
Discount To Fair Value |
29.35% |
37.89% |
41.06% |
45.56% |
50.53% |
39.39% |
|
|
Upside To Fair Value (NOT Including Dividends) |
41.54% |
61.02% |
69.65% |
83.67% |
102.16% |
65.00% (69.4% including dividend) |
|
|
2022 EPS |
2023 EPS |
2021 Weighted EPS |
2022 Weighted EPS |
12-Month Forward EPS |
12-Month Average Fair Value Forward PE |
Current Forward PE |
|
|
$3.30 |
$3.64 |
$1.78 |
$1.68 |
$3.46 |
21.9 |
13.2 |
I estimate VFC’s historical fair value at 21.9X earnings and today it trades at 13.2.
-
12X cash-adjusted earnings
|
Analyst Median 12-Month Price Target |
Morningstar Fair Value Estimate |
|
$56.78 (16.4X earnings) |
$66.00 (19.0X earnings) |
|
Discount To Price Target (Not A Fair Value Estimate) |
Discount To Fair Value |
|
19.37% |
30.64% |
|
Upside To Price Target (Not Including Dividend) |
Upside To Fair Value (Not Including Dividend) |
|
24.03% |
44.17% |
|
12-Month Median Total Return Price (Including Dividend) |
Fair Value + 12-Month Dividend |
|
$58.78 |
$68.00 |
|
Discount To Total Price Target (Not A Fair Value Estimate) |
Discount To Fair Value + 12-Month Dividend |
|
22.12% |
32.68% |
|
Upside To Price Target (Including Dividend) |
Upside To Fair Value + Dividend |
|
28.40% |
48.54% |
Morningstar’s DCF model estimates VFC at the lower end of its historical fair value range and analysts expect it to trade at 16.4X in 12-months.
-
for a 28% total return
-
though nearly 70% would be justified if VFC grows as expected and returns to fair value
|
Rating |
Margin Of Safety For Low-Risk 13/13 Ultra SWAN quality companies |
2022 Price |
2023 Price |
12-Month Forward Fair Value |
|
Potentially Reasonable Buy |
0% |
$73.71 |
$77.67 |
$75.54 |
|
Potentially Good Buy |
5% |
$70.03 |
$73.78 |
$71.76 |
|
Potentially Strong Buy |
15% |
$62.66 |
$66.02 |
$64.21 |
|
Potentially Very Strong Buy |
25% |
$52.52 |
$58.25 |
$56.65 |
|
Potentially Ultra-Value Buy |
35% |
$47.91 |
$50.48 |
$49.10 |
|
Currently |
$45.78 |
37.89% |
41.06% |
39.39% |
|
Upside To Fair Value (Not Including Dividends) |
61.02% |
69.65% |
65.00% |
For anyone comfortable with its risk profile VFC is a potential Ultra Value Buy.
Risk Profile: Why V.F. Corp Isn’t Right For Everyone
There are no risk-free companies, and no company is right for everyone. You have to be comfortable with the fundamental risk profile.
What Could Cause VFC’s Investment Thesis To Break
-
safety falls to 40% or less
-
balance sheet collapses (highly unlikely, about 2.5% to 5% probability according to rating agencies)
-
major failed acquisition
-
a collapse of brand power
-
growth outlook falls to less than 5.6% for seven years
-
VFC’s role in my portfolio is to deliver long-term 10+% returns with minimal fundamental risk
-
8+% total return requirement for defensive sectors
-
10+% for non-defensive (cyclical) sectors – like financials
How long it takes for a company’s investment thesis to break depends on the quality of the company.
|
Quality |
Years For The Thesis To Break Entirely |
|
Below-Average |
1 |
|
Average |
2 |
|
Above-Average |
3 |
|
Blue-Chip |
4 |
|
SWAN |
5 |
|
Super SWAN |
6 |
|
Ultra SWAN |
7 |
|
100% Quality Companies (MSFT, LOW, and MA) |
8 |
These are my personal rule of thumb for when to sell a stock if the investment thesis has broken.
VFC is highly unlikely to suffer such catastrophic declines in fundamentals.
VFC’s Risk Profile Summary
“The COVID-19 outbreak has, at times, disrupted the store operations of VF and its partners and impacted its supply chain. There has also been a general increase in input costs as the economy recovers.
VF does not have a history of developing its own brands, so its ability to find deals is a risk. VF has struggled to find attractive acquisitions in recent years. The company missed overall revenue growth targets for 2013-17 because it failed to find a suitable deal.
Now, it faces competition for acquisitions from the many SPACs that have come public. Vans, Supreme, and other VF brands have greatly benefited from the athleisure fashion trend. As we forecast activewear will produce 53% of VF’s fiscal 2022 operating profit, any slowdown in athleisure would affect VF’s overall profitability.
VF is exposed to some U.S. retailers (especially department stores) with minimal or no sales growth due to declining store visitation. Wholesale customers like Macy’s, J.C. Penney, Kohl’s, and others may downsize as sales shift from physical stores to online. While VF has plans for e-commerce expansion, more company-owned branded stores, and international growth, there is no guarantee that sales lost at physical stores will be recovered in other channels.
Moreover, store closings often mean deep discounting and sales to discount outlets, which can reduce prices and damage brand integrity. We forecast sales growth in the low single digits for the U.S. wholesale channel. Our fair value estimate and medium uncertainty and narrow moat ratings on VF are not significantly affected by environmental, social, and governance (‘ESG’) risks.
Like many apparel manufacturers, VF has faced criticism over human rights, wages, and health and safety standards for factory workers in its supply chain, as well as the environmental impact of clothing production. VF, though, outsources its production and is, therefore, only indirectly exposed to these issues.” – Morningstar (emphasis added).
V.F. Corp’s Risk Profile Includes
-
economic cyclicality risk: sales could suffer in a recession
-
M&A risk: the lifeblood of the VF’s long-term growth strategy
-
margin compression risk: over 1,000 major rivals globally
-
disruption risk from digital commerce: DTC is doing well but could suffer from wholesale sales declines if retail partners close stores
-
labor retention risk (tightest job market in over 50 years and finance is a high-paying industry) – rising wage pressures
-
currency risk (growing over time due to international expansion)
-
inflation risk: supply chain disruption and higher input costs have recently hurt margins
-
shifting consumer taste risk: activewear has been red hot (VANs), but if consumer tastes shift then management growth guidance could fall short
How do we quantify, monitor, and track such a complex risk profile? By doing what big institutions do.
Long-Term Risk Analysis: How Large Institutions Measure Total Risk
-
see the risk section of this video to get an in-depth view (and link to two reports) of how DK and big institutions measure long-term risk management by companies
VFC Long-Term Risk Management Consensus
|
Rating Agency |
Industry Percentile |
Rating Agency Classification |
|
MSCI 37 Metric Model |
81.0% |
AA Industry Leader, Stable Trend |
|
Morningstar/Sustainalytics 20 Metric Model |
87.4% |
12.8.6/100 Low-Risk |
|
Reuters’/Refinitiv 500+ Metric Model |
89.8% |
Good |
|
S&P 1,000+ Metric Model |
28.0% |
Poor, Stable Trend |
|
Just Capital 19 Metric Model |
88.9% |
Very Good |
|
FactSet |
50.0% |
Average, Positive Trend |
|
Morningstar Global Percentile (All 15,000 Rated Companies) |
95.2% |
Exceptional |
|
Just Capital Global Percentile (All 954 Rated US Companies) |
83.3% |
Very Good |
|
Consensus |
75% |
Low-Risk, Good Risk-Management, Stable Trend |
(Sources: Morningstar, MSCI, FactSet, JUST Capital, Reuters, S&P)
VFC’s Long-Term Risk Management Is The 134th Best In The Master List (73rd Percentile)
|
Classification |
Average Consensus LT Risk-Management Industry Percentile |
Risk-Management Rating |
|
S&P Global (SPGI) #1 Risk Management In The Master List |
94 |
Exceptional |
|
Strong ESG Stocks |
78 |
Good – Bordering On Very Good |
|
V.F. Corp |
75 |
Good |
|
Foreign Dividend Stocks |
75 |
Good |
|
Ultra SWANs |
71 |
Good |
|
Low Volatility Stocks |
68 |
Above-Average |
|
Dividend Aristocrats |
67 |
Above-Average |
|
Dividend Kings |
63 |
Above-Average |
|
Master List average |
62 |
Above-Average |
|
Hyper-Growth stocks |
61 |
Above-Average |
|
Monthly Dividend Stocks |
60 |
Above-Average |
|
Dividend Champions |
57 |
Average |
(Source: DK Research Terminal)
VFC’s risk-management consensus is in the top 23% of the world’s highest quality companies and similar to that of such other blue-chips as
-
T. Rowe Price (TROW) – dividend aristocrat
-
Novo Nordisk (NVO) – global aristocrat
-
Fresenius Medical Care (FMS) – global aristocrat
-
Royal Bank of Canada (RY)
-
Texas Instruments (TXN)
-
Northrup Grumman (NOC)
The bottom line is that all companies have risks, and VFC is good at managing theirs.
How We Monitor VFC’s Risk Profile
-
25 analysts
-
2 credit rating agencies
-
7 total risk rating agencies
-
32 experts who collectively know this business better than anyone other than management
-
the bond market provides real-time fundamental risk-assessments
“When the facts change, I change my mind. What do you do sir?” – John Maynard Keynes
There are no sacred cows at iREIT or Dividend Kings. Wherever the fundamentals lead we always follow. That’s the essence of disciplined financial science, the math behind retiring rich and staying rich in retirement.
Bottom Line: V.F. Corp Is A 4.4% Yielding Dividend Aristocrat Bargain You Don’t Want To Miss
It might seem crazy to recommend a consumer discretionary now when everyone is convinced a recession is coming soon.
But let me assure you there is a method to my madness;)
While 70% of economists expect a MILD recession in 2023, 30% still think the Fed will succeed in its goal of a softish landing.
That includes blue-chip economist teams at Goldman Sachs and Morgan Stanley (among the 16 most accurate economist teams in the world according to Market Watch data).
Could VFC fall more? Absolutely, the entire market could POTENTIALLY fall another 24% before bottoming according to the blue-chip economist consensus.
But if we avoid recession, then VFC at its dirt-cheap valuation could take off like a rocket.
Why?
-
VFC is one of the world’s safest, most dependable, and highest quality companies on earth
-
11th highest quality on the Master List
-
4.4% very safe yield
-
15.5% CAGR long-term return consensus
-
17.4% CAGR long-term total return guidance
-
39% discount to fair value = potential very strong buy
-
12.0X cash-adjusted earnings
-
164% consensus return potential over the next six years, 18% CAGR, 3X more than the S&P 500
-
about 2X better risk-adjusted expected returns of the S&P 500 over the next six years.
Because VFC is a classic Buffett-style fat pitch.
It literally represents one of the world’s best companies, the most dependable sources of safe and growing yield on the planet.
And today it trades at private equity-like 12X cash-adjusted earnings.
I’m not a market timer, my goal isn’t to try to help you score a quick 10%, 20%, or even 30% gain (though VFC is fundamentally potentially capable of 70% gains in the next year).
My goal is to highlight the kinds of companies that can make you hundreds or even thousands of percent gains over years and decades.
I’m not trying to help you score a quick buck, I’m trying to help you retire in safety and splendor.
And based on the best available facts today, I can say with 80% confidence that anyone buying VFC for the long-term isn’t just going to be glad they did in 5+ years, they’ll likely feel like a stock market genius.
Be the first to comment