

Japanese Yen Talking Points
USD/JPY trades to fresh weekly high (110.65) amid an unexpected rise in the US Consumer Price Index (CPI), and fresh remarks from Chairman Jerome Powell may sway the exchange rate as the central bank head is scheduled to testify in front of Congress over the coming days.
USD/JPY Rebound Takes Shape Ahead of Fed Chairman Powell Testimony
USD/JPY extends the series of higher highs and lows from earlier this week despite the weakness in longer-dated Treasury yields, and the exchange rate may continue to appreciate ahead of the semi-annual Congressional testimony with Chairman Powell as a growing number of Fed officials show a greater willingness to scale back monetary support.
It remains to be seen if Chairman Powell will strike a hawkish tone in front of US lawmakers as “variousparticipants mentioned that they expected the conditions for beginning to reduce the pace of asset purchases to be met somewhat earlier than they had anticipated at previous meetings,” and the Federal Open Market Committee (FOMC) may start to layout a tentative exit strategy as the central bank pledges to “provide notice well in advance of an announcement to reduce the pace of purchases.”
In turn, USD/JPY may continue to retrace the decline from the monthly high (111.66) if Chairman Powell prepares Congress for a looming shift in monetary policy, but more of the same from the central bank head may undermine the recent rebound in the exchange rate as the “the Committee’s standard of substantial further progress was generally seen as not having yet been met.”
Until then, recent price action raises the scope for a larger recovery in USD/JPY as it carves a series of higher highs and lows, but the rebound in the exchange rate has spurred a shift in retail sentiment like the behavior seen earlier this year.
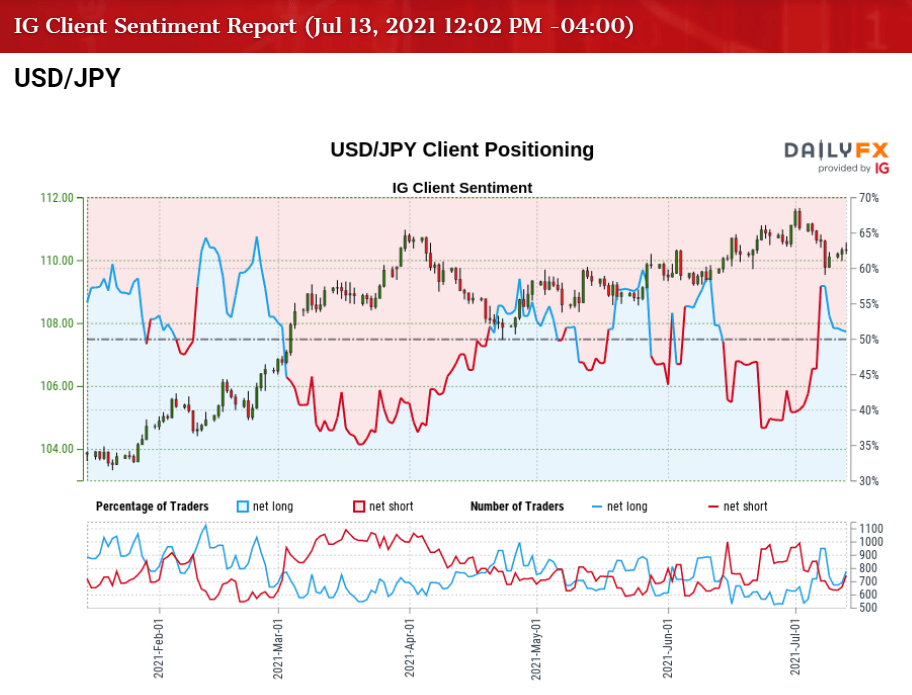
The IG Client Sentiment report shows 49.41% of traders are currently net-long USD/JPY, with the ratio of traders short to long standing at 1.02 to 1.
The number of traders net-long is 6.77% lower than yesterday and 5.79% lower from last week, while the number of traders net-short is 5.16% higher than yesterday and 8.72% lower from last week. The decline in net-long interest has helped to fuel a shift in retail sentiment as retail traders turn net-short USD/JPY once again in July, while the drop in net-short position comes as the exchange rate trades to a fresh weekly high (110.65).
With that said, a further appreciation in USD/JPY may fuel the recent flip in retail sentiment to largely mimic the behavior from earlier this year, and the decline from the yearly high (111.12) may turn out to be a correction in the broader trend as the exchange rate bounces back from the 50-Day SMA (109.83).
USD/JPY Rate Daily Chart
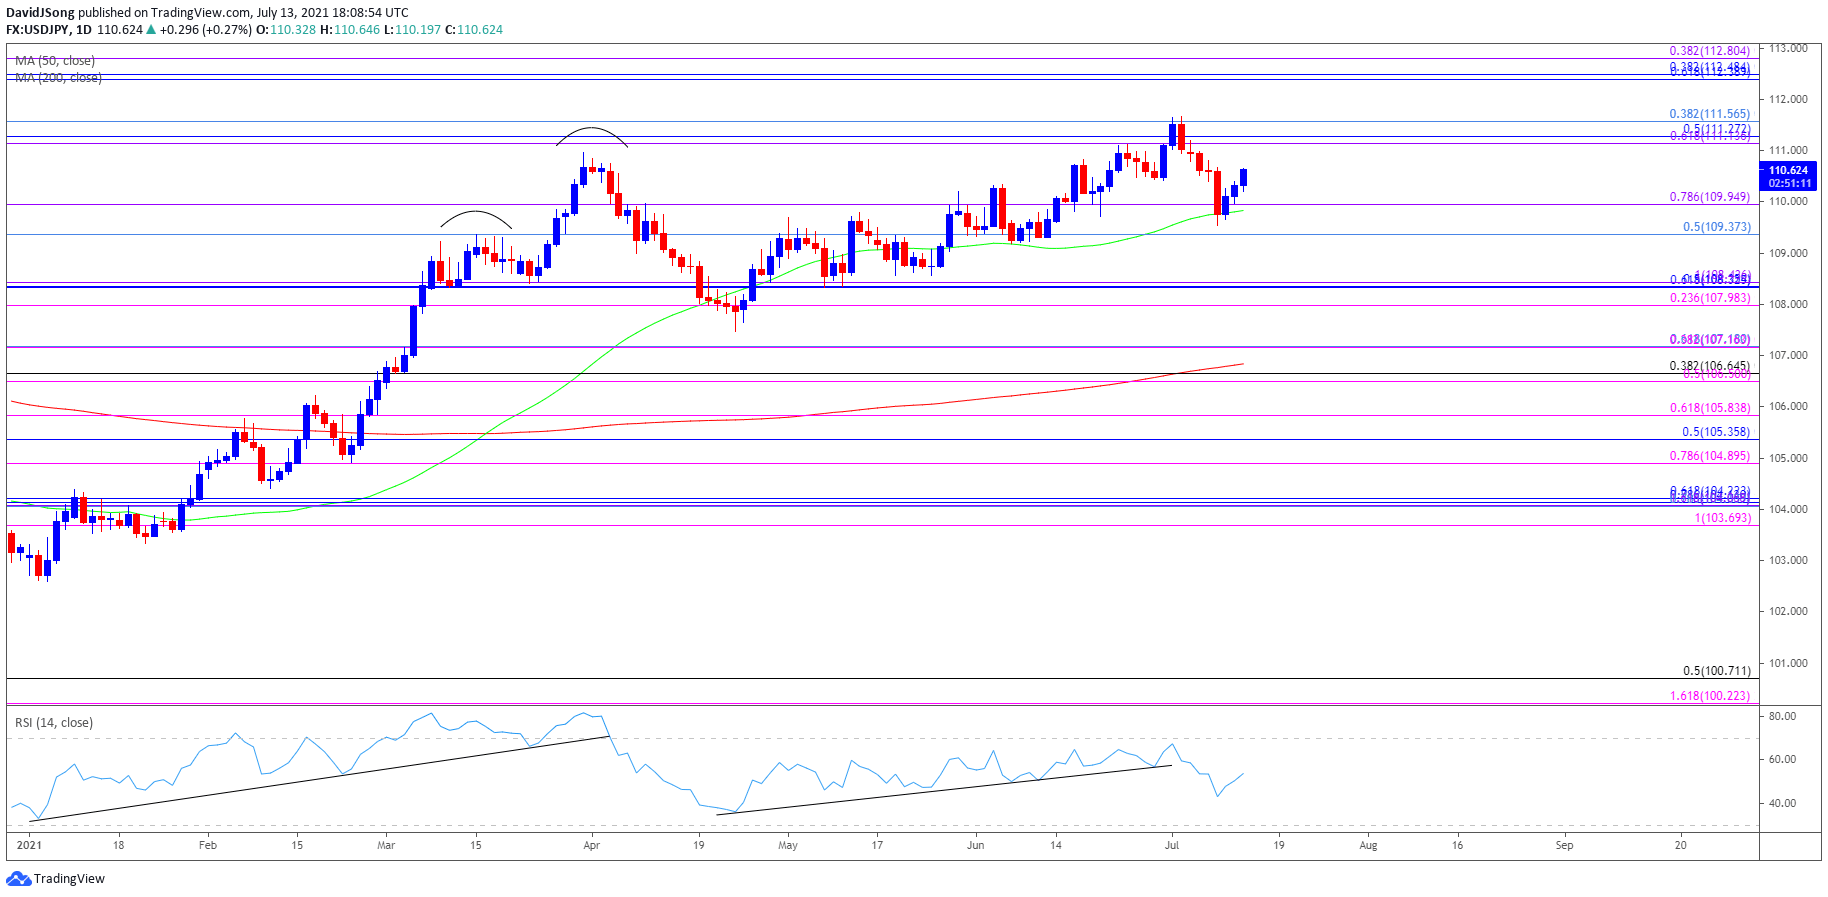
Source: Trading View
- USD/JPY approached pre-pandemic levels as a ‘golden cross’ materialized in March, with a bull flag formation unfolding during the same period as the exchange rate traded to a fresh yearly high (110.97).
- The Relative Strength Index (RSI) showed a similar dynamic as the indicator climbed above 70 for the first time since February 2020, but the pullback from overbought territory has negated the upward trend from this year, which briefly pushed USD/JPY below the 50-Day SMA (109.83) for the first time since January.
- Nevertheless, USD/JPY reversed ahead of the March low (106.37) to largely negate the threat of a head-and shoulders formation, with the exchange rate climbing back above the moving average to trade to a fresh yearly high (111.12) in June.
- A similar scenario seems to have taken shape in July as the exchange rate extends the rebound from the monthly low (109.53), with the failed attempt to break/close below the 109.40 (50% retracement) to 110.00 (78.6% expansion) region bringing the Fibonacci overlap around 111.10 (61.8% expansion) to 111.60 (38.2% retracement) back on the radar.
- Need a break/close above the Fibonacci overlap around 111.10 (61.8% expansion) to 111.60 (38.2% retracement) to open up the February 2020 high (112.23), with the next area of interest comes in around 112.40 (61.8% retracement) to 112.80 (38.2% expansion).
— Written by David Song, Currency Strategist
Follow me on Twitter at @DavidJSong
Be the first to comment