

Japanese Yen Talking Points
USD/JPY extends the decline from the monthly high (112.08) even though the update to the US Personal Consumption Expenditure (PCE) report warns of sticky inflation, and the exchange rate may face a larger pullback during the first full week of October amid the failed attempt to test the 2020 high (112.23).
USD/JPY Correction Takes Shape amid Failure to Test 2020 High
USD/JPY slipped to a fresh session low (110.96) despite an unexpected uptick in the PCE, but the fresh data prints may keep the Federal Reserve on track to scale back its emergency tools as the better-than-expected ISM Manufacturing survey reinforces expectations for a robust recovery.
As a result, Chairman Jerome Powell and Co. may come under pressure to normalize monetary sooner rather than later as the Summary of Economic Projections (SEP) reflect expectations for a stronger recovery, and the diverging paths between the FOMC and Bank of Japan (BoJ) may keep USD/JPY afloat as speculation for a looming shift in Fed policy lifts US Treasury yields.
In turn, USD/JPY may stage additional attempts to test the 2020 high (112.23) ahead of the next FOMC interest rate decision on November 3, but a further appreciation in the exchange rate may fuel the tilt in retail sentiment like the behavior seen earlier this year.

The IG Client Sentiment report shows 27.83% of traders are currently net-long USD/JPY, with the ratio of traders short to long standing at 2.59 to 1.
The number of traders net-long is 4.88% lower than yesterday and 4.70% lower from last week, while the number of traders net-short is 8.08% lower than yesterday and 39.71% higher from last week. The decline in net-long position comes as USD/JPY extends the decline from the monthly high (112.08), while the rise in net-short interest has fueled the crowding behavior as 36.11% of traders were net-long the pair last week.
With that said, the limited reaction to the slew of US data prints may generate a larger pullback in USD/JPY as the Relative Strength Index (RSI) reveres ahead of overbought territory, but the exchange rate may stage further attempts to test the 2020 high (112.23) as speculation for a looming shift in Fed policy lifts US yields.
USD/JPY Rate Daily Chart
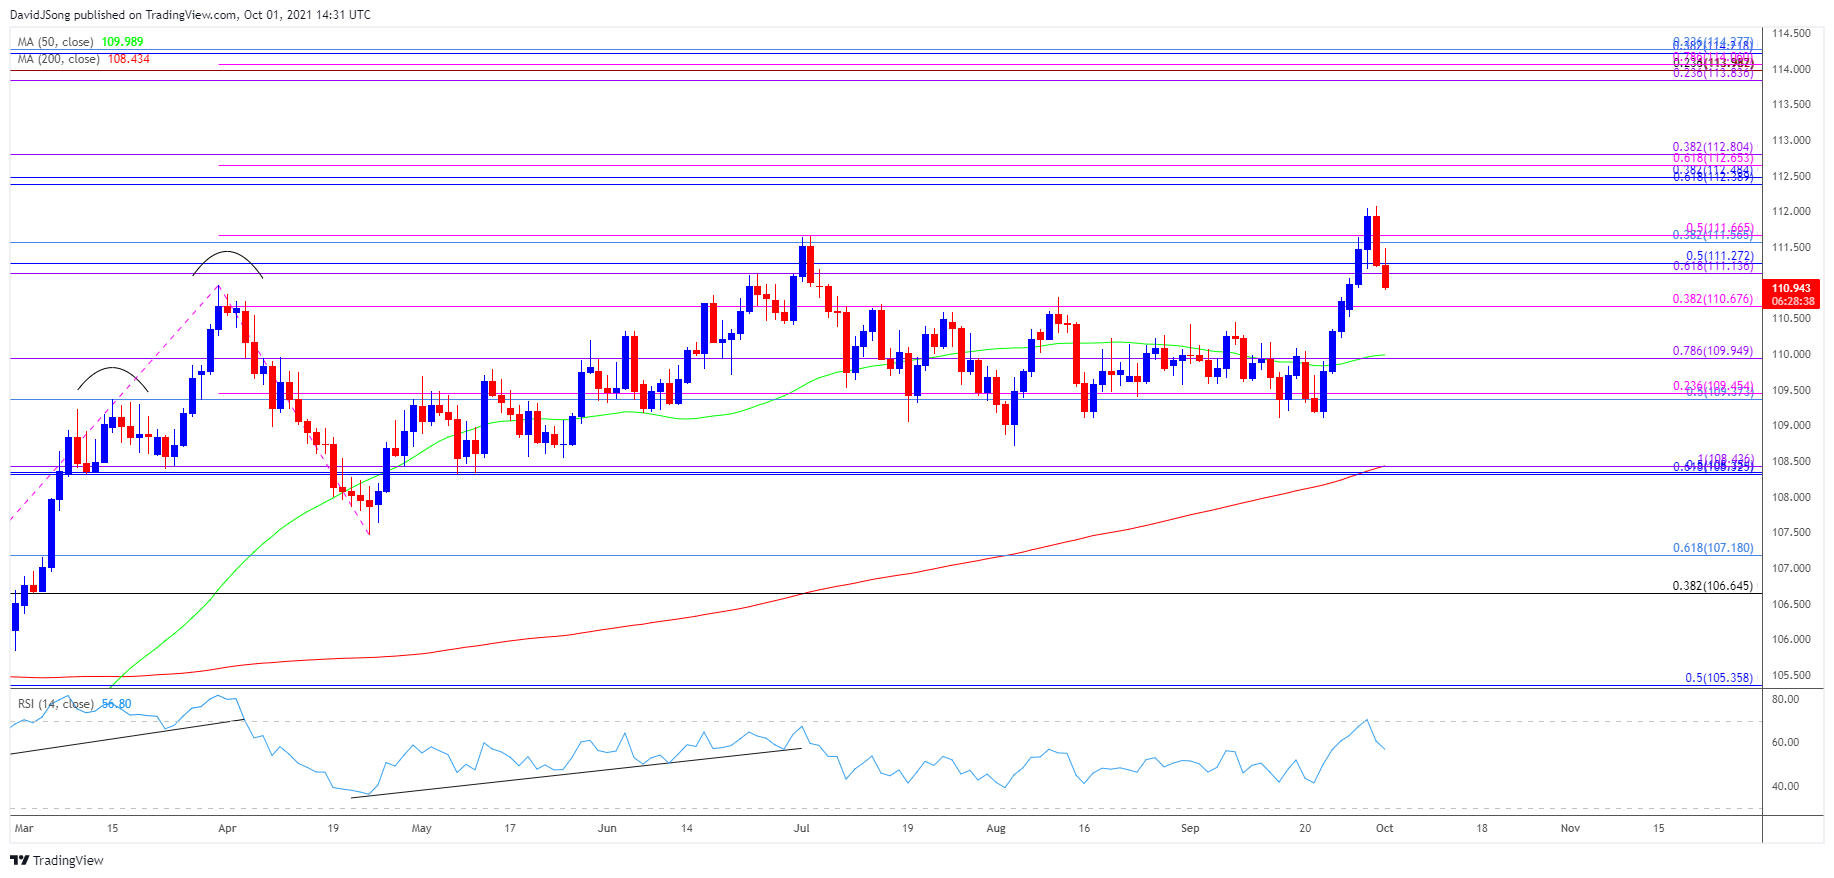
Source: Trading View
- Keep in mind, USD/JPY negated the threat of a head-and-shoulders formation as it pushed to a fresh yearly high (111.66) in July, with the Relative Strength Index (RSI) offering a similar development as it established an upward trend during the same period.
- However, the RSI snapped the bullish formation as USD/JPY struggled to hold above the 50-Day SMA (109.99), with the exchange rate trading within a defined range as the moving average struggled to retain a positive slope.
- Nevertheless, USD/JPY cleared the July high (111.66) in September as it pushed to a fresh yearly high (112.08), but the exchange rate appears to staged failed attempt to test the 2020 high (112.23) as the RSI reverses ahead of overbought territory.
- Lack of momentum to hold above the Fibonacci overlap around 111.10 (61.8% expansion) to 111.60 (38.2% retracement) may push USD/JPY back towards the 110.70 (38.2% expansion) region, with the next area of interest coming around 109.40 (50% retracement) to 110.00 (78.6% expansion).
- Need a break above the 2020 high (112.23) to open up the overlap around 112.40 (61.8% retracement) to 112.80 (38.2% expansion), with the next area of interest coming in around 113.80 (23.6% expansion) to 114.30 (23.6% retracement).
— Written by David Song, Currency Strategist
Follow me on Twitter at @DavidJSong
Be the first to comment