

USD/JPY ANALYSIS
- Yen’s brief pullback may be coming to an end as ‘risk-off’ fades.
- This week’s U.S. labor data sets up promising run-up to NFP’s.
- Bearish IG Client Sentiment (IGCS)opposing fundamentals.
JAPANESE YENFUNDAMENTAL BACKDROP
RISK AVERSION SLOWS FAVORING USD
Taking away from the Yen’s safe-haven appeal is the recent deal struck by Democrats and Republicans to raise the U.S. debt ceiling. Leading up to the deal, markets were concerned about a potential default by the U.S. government on current debt obligations which could have caused significant ripple effects across global markets. That being said, JPY bulls took the opportunity to claw back some lost gains. This short-term lull in USD/JPY price action may be coming to an end as global markets become more risk seeking.
Japan’s Finance Minister Shunichi Suzuki has also made a noteworthy announcement that he will be closely monitoring the currency should and large fluctuations ensue. He alluded to the 112.40 handle as a point of concern should prices reach this level (April 2019 high).
POSITIVE U.S. JOBS DATA AHEAD OF FRIDAY’S NFP
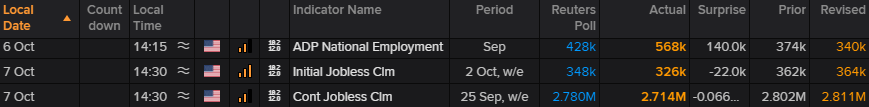
U.S. ADP employment change yesterday and initial jobless claims data today both printed better than forecasts (see results below) which has had added to the underlying bullish dollar mentions.
Source :Refinitiv
This is not entirely evident on the USD/JPY daily chart just yet as markets await the key Non-Farm Payroll (NFP) announcement tomorrow. Either way I believe the Fed has little option but to reduce asset purchases (tapering) as the current inflationary environment is not as “transitory” as initially thought.
USD/JPY ECONOMIC CALENDAR

Source: DailyFX economic calendar
USD/JPY TECHNICAL ANALYSIS
USD/JPY Daily Chart:

Chart prepared by Warren Venketas, IG
In late September, we saw USD/JPY breaking out of the symmetrical triangle pattern (black) in conjunction with the bullish Exponential Moving Average (EMA) crossover – 20-day crossing EMA above 50-day EMA.
The 111.00 support level remains firm and is unlikely to be broken through should fundamentals hold as expected. If prices do retrace towards 111.00 bulls may see this as an attractive long entry zone. It seems only a matter of time before resistance levels are broken through.
The Relative Strength Index (RSI) has pulled back off overbought levels which could open up room for further upside to potentially challenge 2020 highs.
Key resistance levels:
- 112.42 – 50% Fibonacci level
- 112.23
- 111.66
Key support levels:
- 111.00
- 20-day EMA (purple)
IG CLIENT SENTIMENT FAVORS USD/JPY BEARS SHORT-TERM
IGCS shows retail traders are currently net long on USD/JPY, with 65% of traders currently holding long positions (as of this writing). At DailyFX we take a contrarian view on sentiment which suggests near-term downside on the pair.
— Written by Warren Venketas for DailyFX.com
Contact and follow Warren on Twitter: @WVenketas
Be the first to comment