

matejmo
Since printing this year’s high on January 3, at 1.3685 USDCAD failed to continue higher and has trended lower as the Loonie strengthened on a higher current account balance which was positive for September 2022 as a percentage of GDP.
The current account balance for the United States was a deficit of 3.6% to GDP in the same month. And while the current account for Canada is expected to turn negative again in the coming months, forecasts are below a deficit of 1% to GDP.
Whereas forecasts for the US current account deficit remain above a deficit of 3%. Balance of payments is not the only factor and interest rates possibly play a larger role. However, interest rates are expected to increase in Canada along the lines of the Fed tightening policy.
More importantly, bond yields are very similar in Canada and the US. So, in my opinion, the interest rate factor is minimal among two highly developed and similar economies. And other factors such as expectations on inflation and current account balance will have a greater influence on the FX rate.
TradingView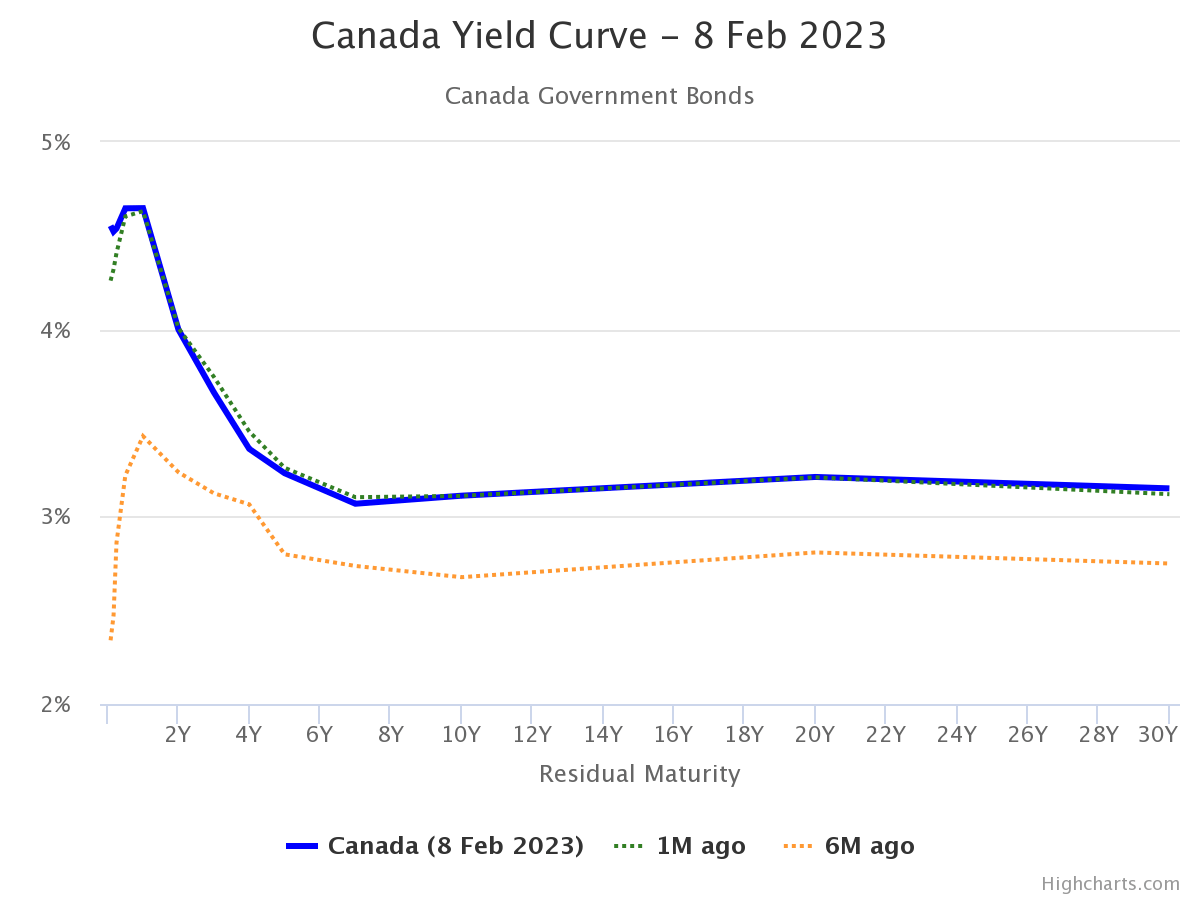
The chart above shows the yield curve for Canadian bonds and treasuries. Below we have the same curve for US bonds and treasuries. The spread between the two curves is minimal and is likely not to be a big driver of the FX rate on this currency pair.
TradingView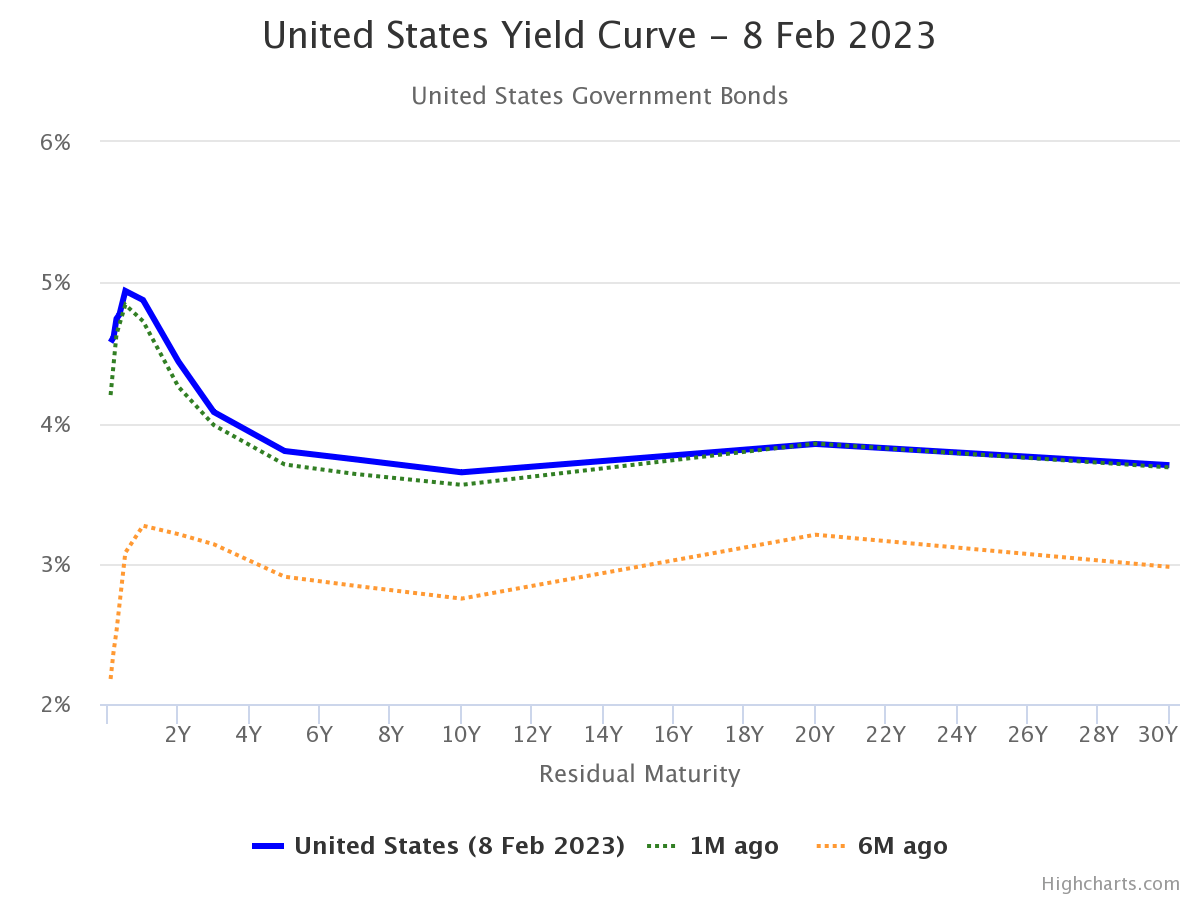
Inflation also has a big role in FX rates, since higher inflation rates will lead central banks to take a tougher stance on their monetary tightening policies. Canada has experienced a slightly lower inflation rate than the US over the past months.
However, Canadians are expecting inflation to grow to 7.18% by January 2024. That’s a sharp contrast to US data that show expectations of 5.2% inflation in one year. Inflation expectations can be self-fulfilling and lead to higher inflation.
The annual GDP growth rate is another factor that influences the FX rate. The latest data shows an annual GDP growth rate for Canada at 3.9% while the US rate is 1% over the same period for the previous year.
However, the annualized growth rate for Q4 2022 was 2.9% for both economies. The fundamental data in terms of GDP growth and interest rates are fairly aligned for both currencies. I would see demand for CAD coming from commercial trade and financial investment flows.
As we have seen above the current account balance favors Canada which has a surplus and is expected to have a smaller deficit to GDP in the next 2 quarters.
Technical View
Let’s have a look at the technical analysis of USDCAD from short, medium, and long-term viewpoints. The daily chart below shows the currency pair on a daily chart. We can see that price action attempted a break above the Ichimoku cloud between the end of 2022 and the beginning of 2023.
TradingView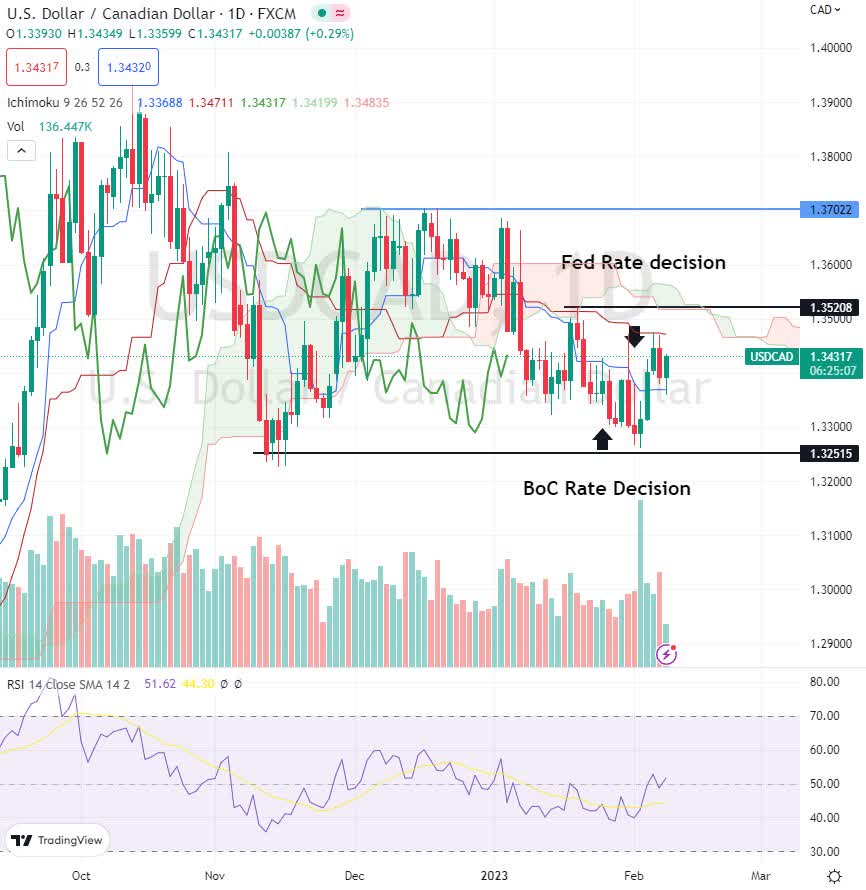
The two attempts to break through the cloud on December 7 and 16 then gave way to a bear market. Price action has been below the cloud since January 9, indicating a short-term bear trend. Daily candles have been posting lower highs and lows since January 3.
We can also see that the central bank decisions in Canada and the US didn’t have a great impact on the current trend. Although the Fed hike did send the dollar higher, it still remains to be seen if the bear trend will be turned.
The RSI is just above 50 and well above its moving average indicating more bullish momentum may be on its way. However, the RSI hasn’t made it anywhere near 70 or 30 recently. These are levels that indicate a bullish and bearish trend respectively.
Resistance & Support
The first resistance level would be in the zone of 1.3520, which is a recent high that ended its run on the bottom of the cloud. And which also coincides with the cloud over the next days.
If that level is broken I would expect more resistance at the 1.3702 level, which is where the USDCAD tried to break above the cloud.
The next support level, if the market continues to trend lower, would be at the 1.3251 level which is a low touched 4 times back in November 2022.
The weekly chart below shows price action above the cloud and an ongoing bullish trend. We can see the formation of a triangle (blue lines) that has formed over the past 17 candles. With both sides of the triangle having been touched twice.
Presumably, the third touch will lead to a breakout of the pattern, whether higher or lower. As the triangle has formed on a rally the most likely event is a break upwards. However, for the next medium-term trend to establish price action needs to break either side of the triangle first.
TradingView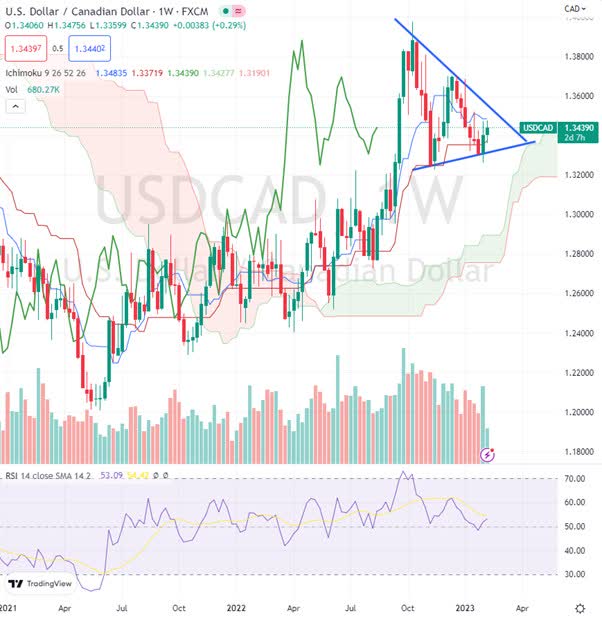
The monthly chart below is more in line with my expectations for a stronger Loonie in the coming months. Price action has been in a wide range since April 2015. The channel for the sideways trend is set by two touches on the low at the 1.2056 zone and two touches on the high at the 1.4116 zone.
TradingView
That’s a very wide channel, but it’s still a sideways pattern. The current leg of action started after touching the low of the channel in May 2021. However, the last 6 candles have found resistance at the top side of the Ichimoku cloud.
Failure to break the cloud to the upside should lead to further lows, where the market may meet resistance on the blue line. A break of that line on the monthly chart could lead to price action finding support at the 1.2334 level and then the next support at 1.2056.
Final Takeaway
I see the Loonie strengthening due to a better current account balance to GDP, and an economy that is recovering more quickly compared to last year. Interest rates are pretty much parallel with a small favor to US dollar bills.
However, that was probably factored in and was why the FX rate reached previous highs. I see a mix of signals on the technical side, but due to my fundamental skew, I would forecast a break to the downside of the triangle on the weekly chart and more downside price action in the coming month.
Be the first to comment