

USD/ZAR ANALYSIS
- South African GDP surpasses estimates
- Subdued bond yields
- USD/ZAR remains within rectangle pattern
- Short-term downside likely to extend
RAND FUNDAMENTAL BACKDROP
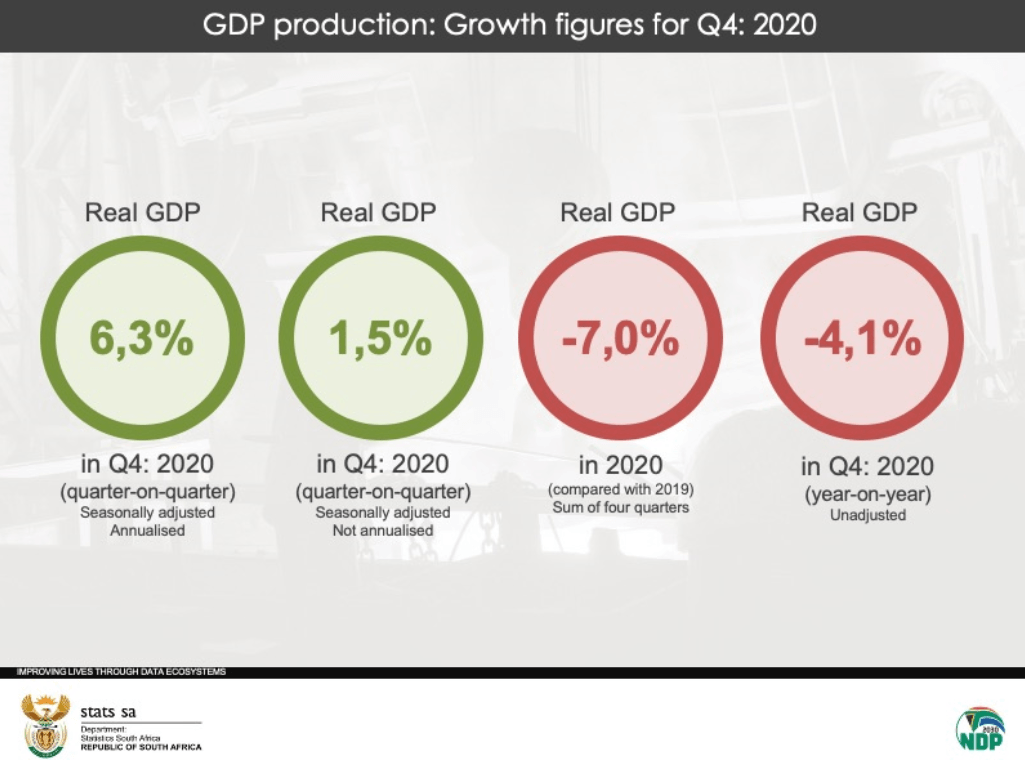
SOUTH AFRICAN Q4: 2020 GDP BEATS ESTIMATES
Source: Stats SA

Source: DailyFX economic calendar
SA GDP figures improved on estimates both YoY and QoQ as seen in the images above with the largest contributors to positive growth coming from transport, trade and manufacturing respectively.
U.S. treasury yields (see chart below) which have plagued the Rand of recent, has eased this morning resulting in a slight pullback on the USD/ZAR pair. While expectations are that U.S. treasury yields have more room to climb, the short-term outlook may be that markets will need some time to digest the recent upsurge. This could be attractive to Rand bulls which could lead to short-term ZAR strength, while two major South African commodity exports – Spot Gold and Platinum have also made a comeback today supporting the local currency.
USD/ZAR VS U.S. 10Y T-NOTE YIELD
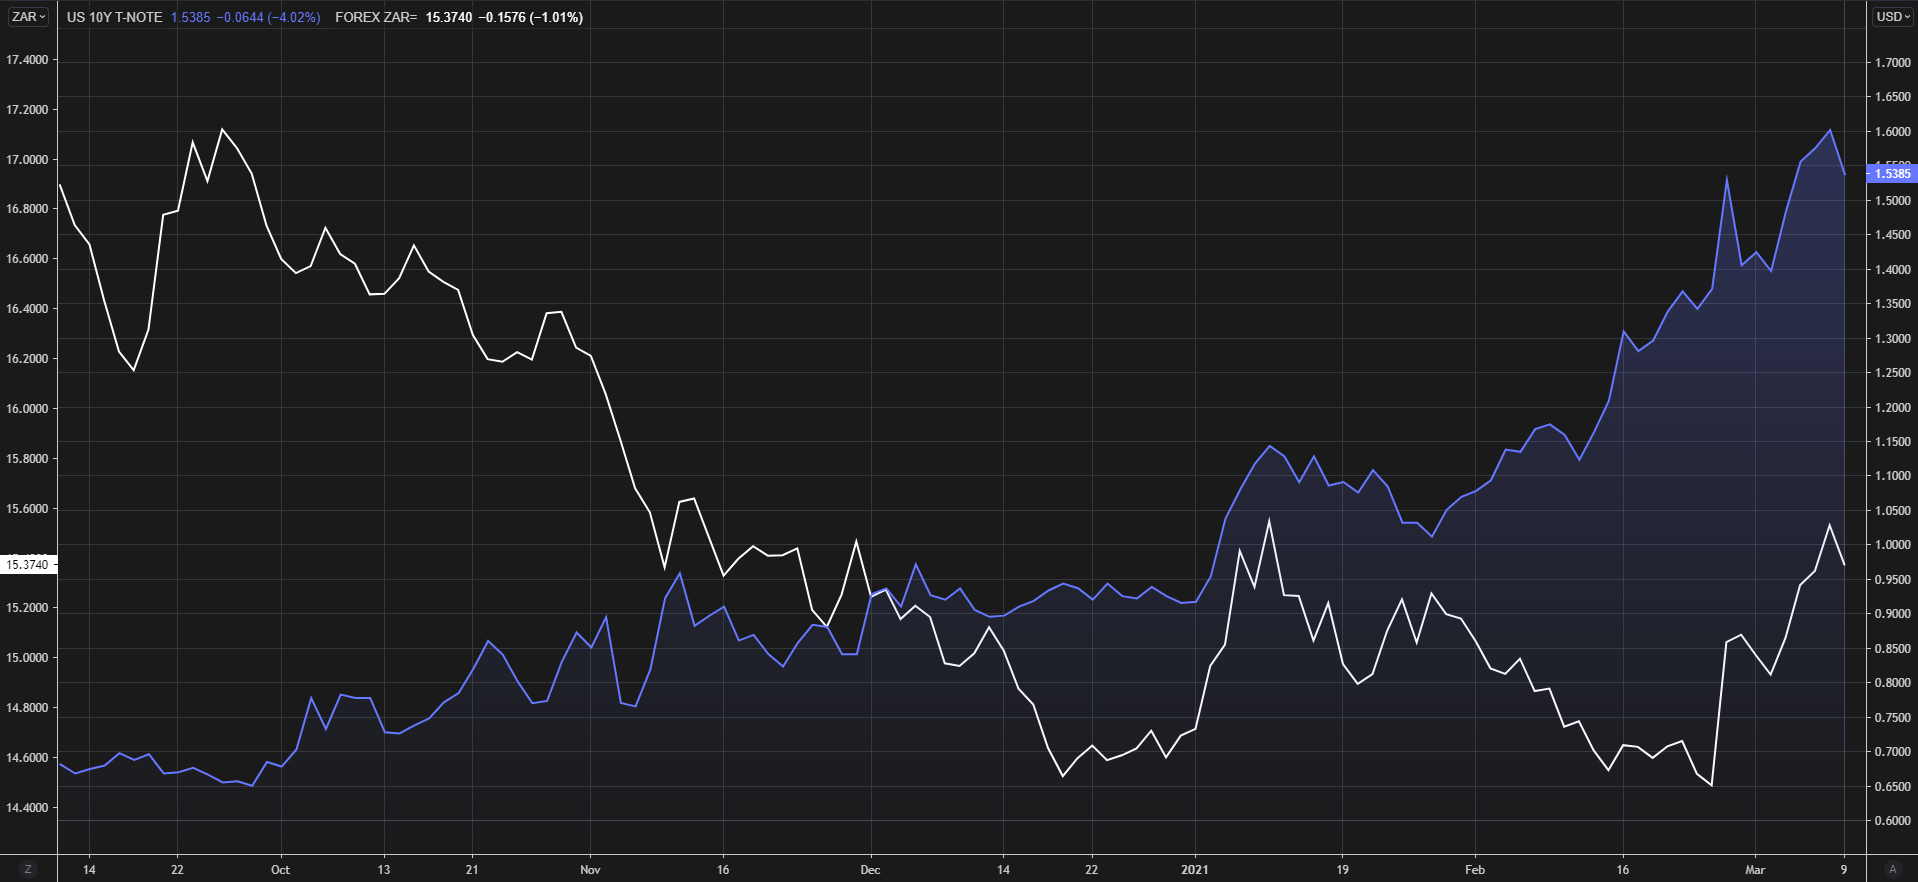
Chart prepared by Warren Venketas, Refinitiv
ECONOMIC ANNOUNCEMENTS
Tomorrow U.S. inflation data is scheduled which will likely result in short-term volatility around USD crosses. Should actual data deviate considerably from forecasts, there could be significant price fluctuations on USD/ZAR.
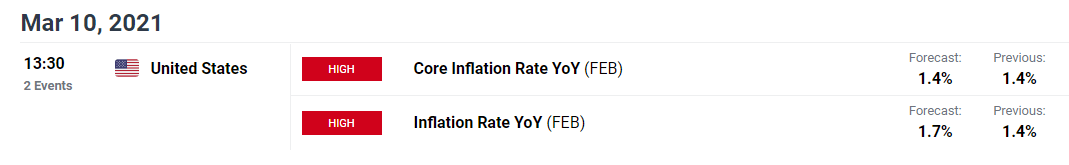
Source: DailyFX economic calendar

Recommended by Warren Venketas
Trading Forex News: The Strategy
TECHNICAL ANALYSIS
USD/ZAR WEEKLY CHART
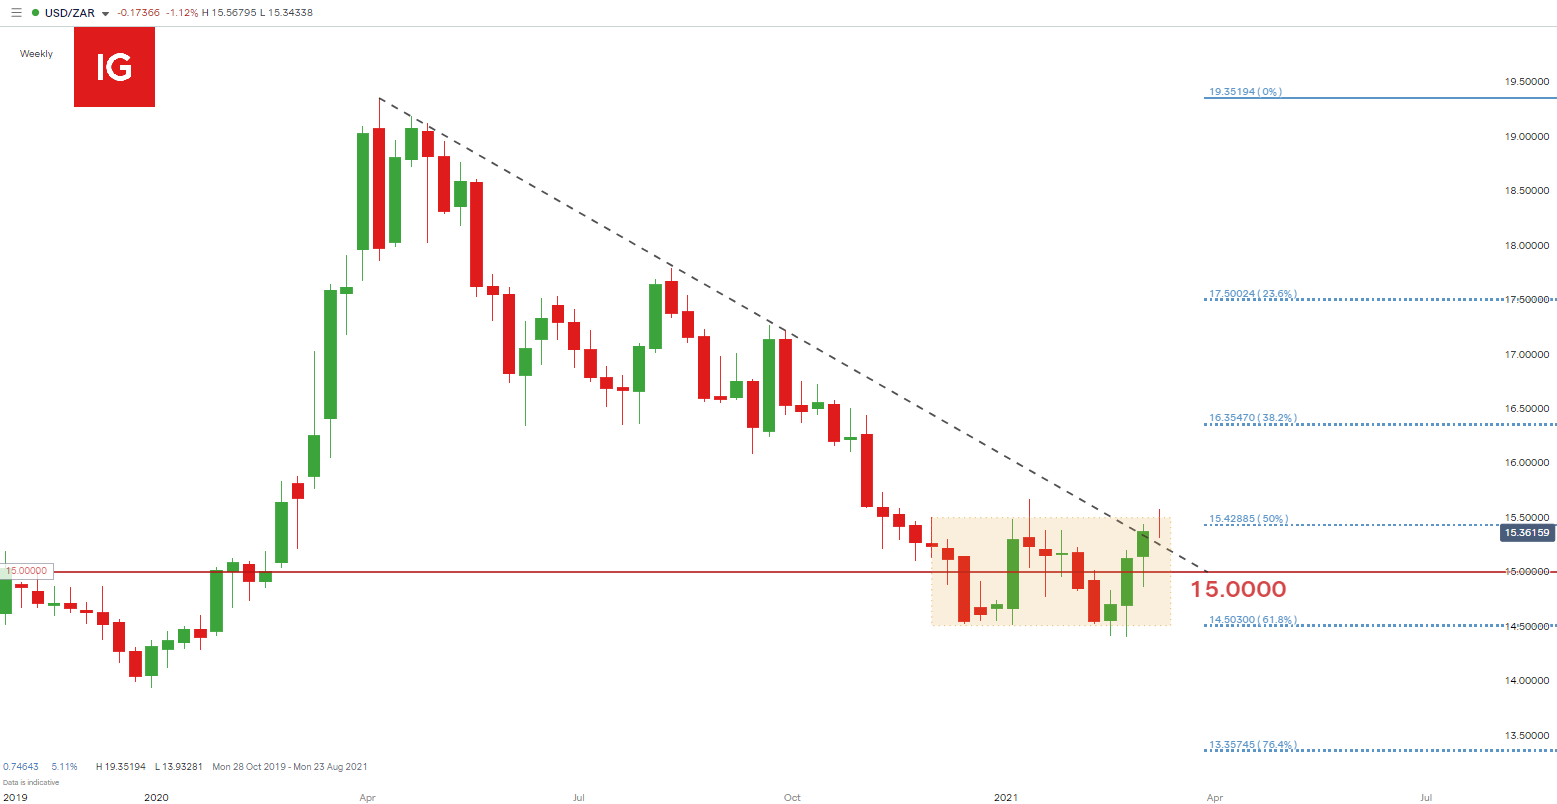
Chart prepared by Warren Venketas, IG
The weekly rectangle consolidation pattern (yellow) that I have mentioned previously has now reached topside resistance. Price action did push above this zone but soon fell back within the rectangle which does not constitute an upside breakout.
This being said, the long-term trendline resistance (dashed black line) has been temporarily broken but confirmation will only be established once the candle closes at the end of the week.
Discover the basic building blocks of Fibonacci and how it can be applied in Financial markets!
USD/ZAR DAILY CHART
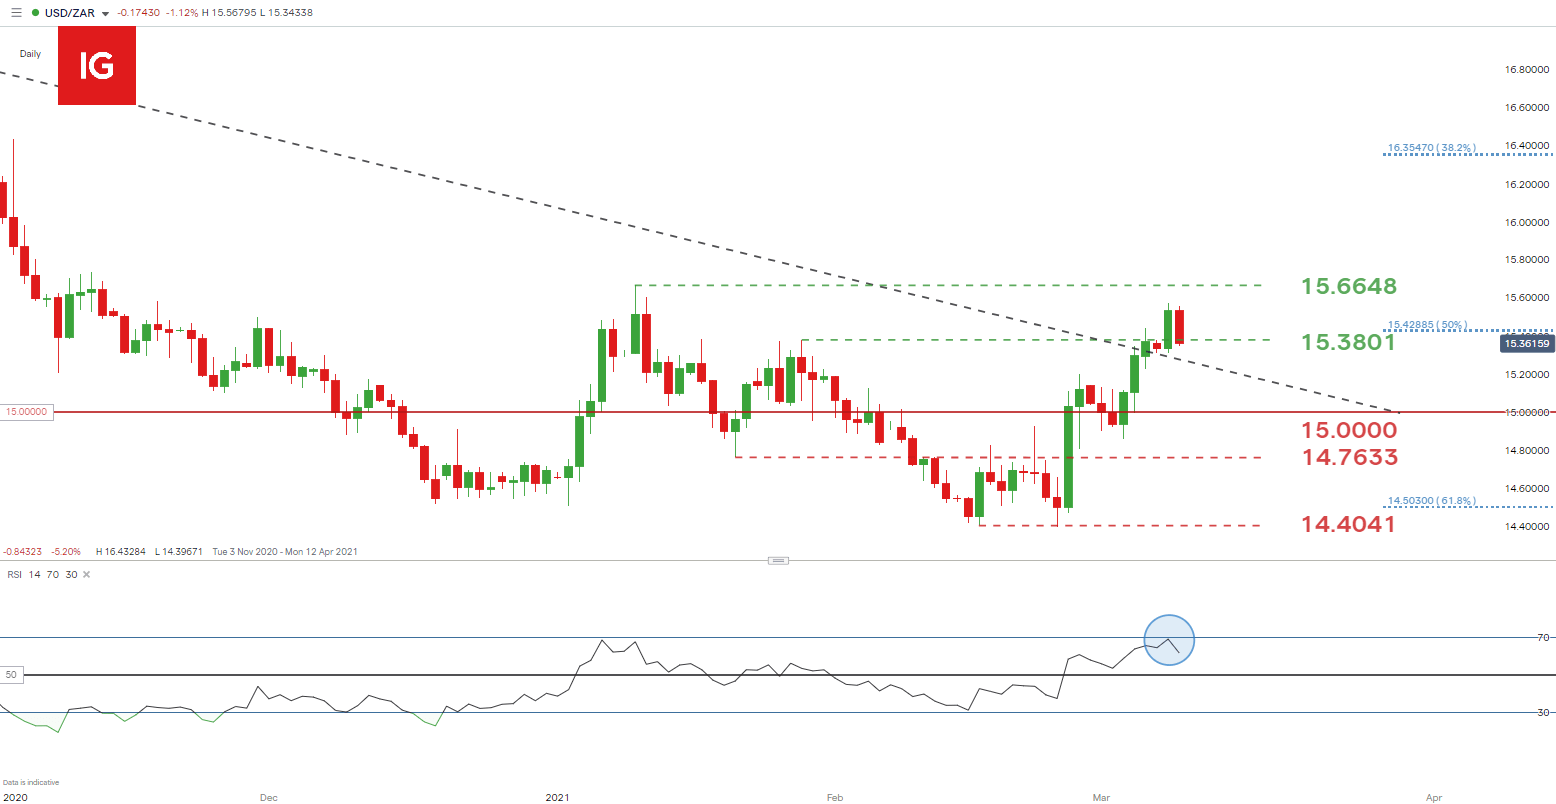
Chart prepared by Warren Venketas, IG
Post GDP announcement, the Rand did appreciate marginally against the U.S. Dollar. With no other important data throughout the day markets may further digest the positive news in a delayed manner which may result in additional Rand strength later in the day.
The Relative Strength Index (RSI) is exhibiting slowing upside momentum as it approaches overbought territory (blue). This is consistent with the weekly chart but allows for clearer short-term key levels. The January swing high at 15.6648 will now serve as initial resistance.
From the more likely bearish perspective, should price action hold below the 15.3801resistance levelthe 15.0000 psychological support zone could be in focus once more.
Starts in:
Live now:
Mar 16
( 17:03 GMT )

Keep up to date with price action setups!
Trading Price Action
USD/ZAR: KEY TECHNICAL POINTS TO CONSIDER
- Weekly: Rectangle pattern
- Daily: January 11 swing high – 15.6648
- 15.3801 resistance
- 15.0000 support
- Price trading above trendline resistance on weekly
- RSI bullish momentum slowing
— Written by Warren Venketas for DailyFX.com
Contact and follow Warren on Twitter: @WVenketas
Be the first to comment