

mikkelwilliam/E+ via Getty Images
Background
Avoid the pitfalls! I run an algorithm which, at its core, provides signals to constrain drawdowns while enhancing returns by preserving capital for the rebounds. Those rebounds are typically extremely profitable, and riding the upside with unimpaired capital provides dramatic CAGR improvement over most cycles. But I don’t trade in a vacuum. There is value in perspective on markets and strategies, and this market begs for perspective.
Over the last 12 months, trading SPDR S&P 500 Trust ETF (SPY) with the algorithm has produced a (0.6%) loss compared to (13.1%) for a buy-and-hold strategy. But the obvious question is, “why bother?”
This market is fraught with risk. Some risks, like volatile prices, are quantifiable, but larger than normal. But there are also “quantum risks.” These are not true black swans because they are foreseeable, known unknowns as opposed to black swans which are unknown unknowns. Quantum risks include a potential major bankruptcy threatening the financial system, China’s military adventurism, etc.
Over the last year, dropping the Nasdaq early, incorporating option hedges, and exchanging fixed-income positions for floating-rate treasuries have been beneficial strategies. I’ve limited equity trading to SPY and (SPXL) with some options protection, and I’ve been running far-smaller-than-normal commitments. So, impacts from this universal bear market (stocks and bonds) have been minimized, but it will still go into the books as a waste of time and effort.
The Questions
I’m not one to expect the recent past to be repeated in coming months, but numerous factors indicate that, at least for a few more months, risks exceed reward potential. So, there is an elephant in the room, and it can be expressed in five parts . . .
- Why trade equities in a material way if risks exceed reward potential?
- What threshold equity-trading return would constitute adequate compensation for current risk conditions?
- I still expect to see capitulation; how might we position while we wait?
- If there is no capitulation, and equities simply drift higher from some not-so-obvious bottom, what is the risk of missing out if positions have been scaled back near term?
- Is this environment transient or is it a ten-year regime change?
Taking them one at a time:
1. Why trade equities in a material way if risks exceed reward potential?
This question answers itself. But the implicit dilemma is how much trading is adequate to be there when the bottom is identified. I’ll get to that at the end of this article.
2. What threshold equity-trading return would constitute adequate compensation for current risk conditions?
My gut says a 20% annual return would be commensurate with the risks, and I think that is highly unlikely even with a strong trading algorithm. For the last 12 months, my algorithm is about 12 percentage points better than a buy and hold (“B&H”) strategy using SPY. So, if B&H stock gains returned to their normal 9% annual price growth, that 20% threshold would be attainable, but I see that as unlikely.
3. I still expect to see capitulation; how might we position while we wait?
Including the 2020 COVID stock collapse, returns for the full 2020 year mushroomed to 55% using the algorithm. Unmanaged, SPY gained about 16%.
So, until recently I had been of the opinion that it was worth trading material equity positions relying on EZV buy-sell signals and modulated-commitment algorithms. I’ve been trading up to 30% of my portfolio using 3X-leveraged SPXL with covered calls for mitigation. This year I’ve lost minimally on 30% of my portfolio doing that, so on a full-portfolio basis the cost has been very small. But something has changed now. Floating-rate treasuries now yield about 3% and rising; I use (TFLO) and (USFR), which comprise most of the remainder of my portfolio. (VRIG) is a similar floating-rate exchange-traded fund (“ETF”), but with corporate credits and higher yield. If you look into these, be sure to look at the trend in dividends; one year ago they paid almost nothing, but monthly yields have risen with general rate structures.
So, for any $1 million tranche, I’m comparing a $30,000 (and rising) opportunity for risk-free gain versus equity returns that, while enhanced, are unlikely to compensate for risk conditions. That imbalance favors a smaller equity commitment, but not zero. The bottom will only be identifiable if I’m in the game.
4. If there is no capitulation, and equities simply drift higher from some not-so-obvious bottom, what is the risk of missing out if positions have been scaled back near term?
I see minimal exposure to missing out. I’ve got numerous metrics that will provide fair warning if markets make a gradual return to health. The most obvious indications will come from the algorithm itself, but there is another thing.
I track the algorithm’s effectiveness by tallying gains and losses on all ‘buy’ or ‘sell’ intervals. During ‘buy’ intervals, when I’m holding equities, gains can run during healthy times. During “sell” intervals, I typically hold a small inverse position, and for the unused funds, I make a choice between IEF and TFLO depending on prevailing correlations. So, typically buy intervals earn material gains and sell intervals may gain minimally or lose minimally except on severe downturns when gains can be material.
Here is a graph of the 63-day average gain or loss of all intervals since mid-2008. This chart excludes any inverse positions. Individual interval results are tallied upon the occurrence of a closing signal: buy intervals end with a sell signal and vice versa.
Average Buy & Sell Interval Returns (Michael Gettings; Data Sources: Fidelity, CBOE, Barchart.com)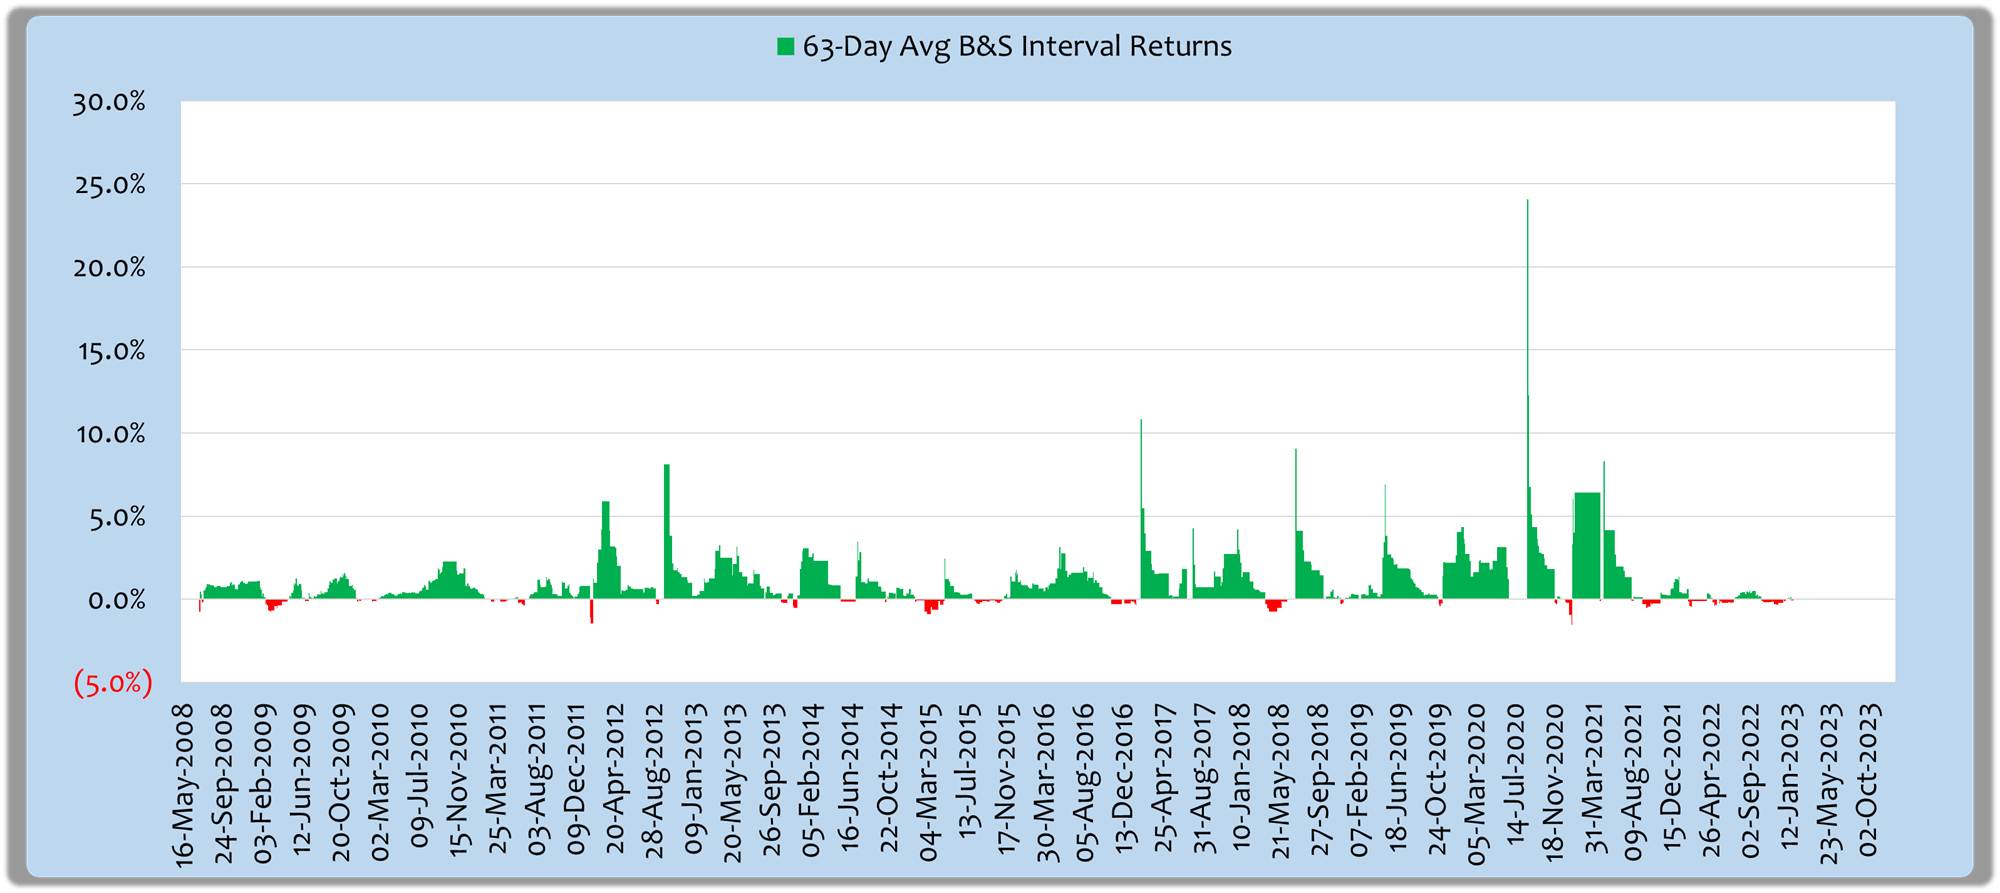
Note, these are averages of all algorithm-driven buy or sell intervals ending over 63 trading days or one calendar quarter. The individual intervals could range from a few days to months in a healthy market. The average ‘buy’ interval is 16 days; sell intervals average about 4 days, so the average gains and losses reflect short durations where a 5% gain is large. Over the 14 years modelled using SPY, compound growth has been 20%-plus; it’s been 22% since the service’s inception.
I observe two important phenomena here. First, gains can be large, but losses small; such is the core aim of the algorithm.
The second observation is important to this discussion, and it goes to the lack of a healthy market from late 2021 through 2022. Both gains and losses have been muted on the right side of the chart. Losses are muted by design, but the small gains are a result of this market environment where price trends exhibit very little follow through.
In short, pitfalls have been largely avoided, but there has been extraordinarily little upside to be captured.
So, when the day comes that I see healthy metrics from the algorithm in conjunction with a market environment that exhibits some follow through, a large commitment will be appropriate. If capitulation comes first, as I expect, then all the better. In fact, a capitulation event will, by itself, indicate follow through as the price collapse will earn material returns when inverse positions are included.
5. Is this environment transient or is it a ten-year regime change?
Usually when people ask that question, it reflects stagflation concerns like the late ’70s when prices languished for a decade. This is what people think of when they recall the ’70’s stagflation:
S&P During ’70’s Stagflation (Source: Macrotrends.net)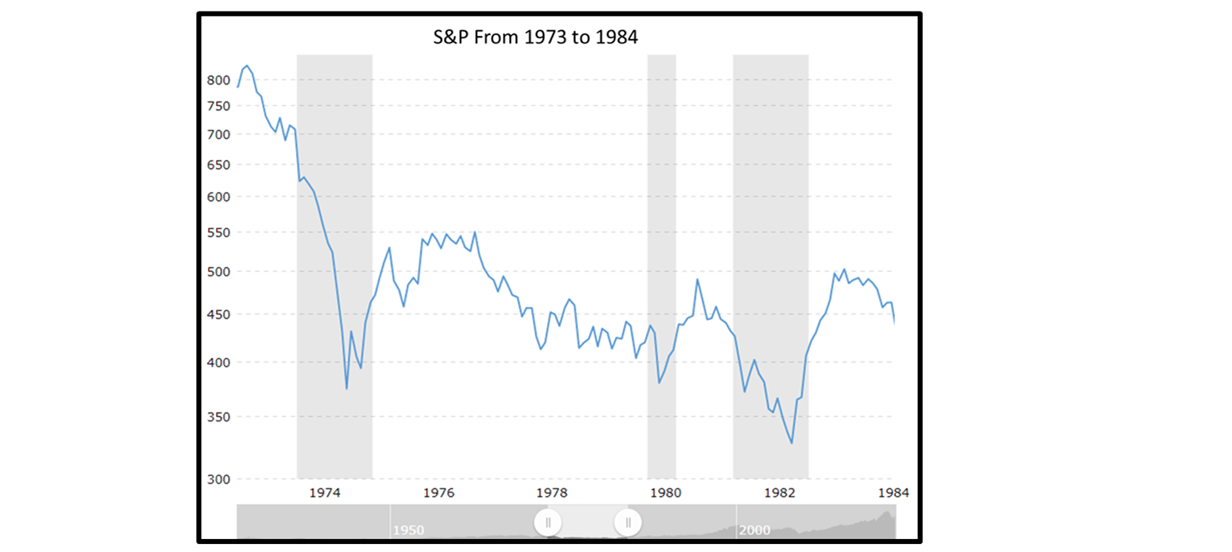
But look at the annual granularity. This chart shows annual returns beginning with the oil embargo through 1984.
S&P 500 Index – Historical Chart (Macrotrends.net:)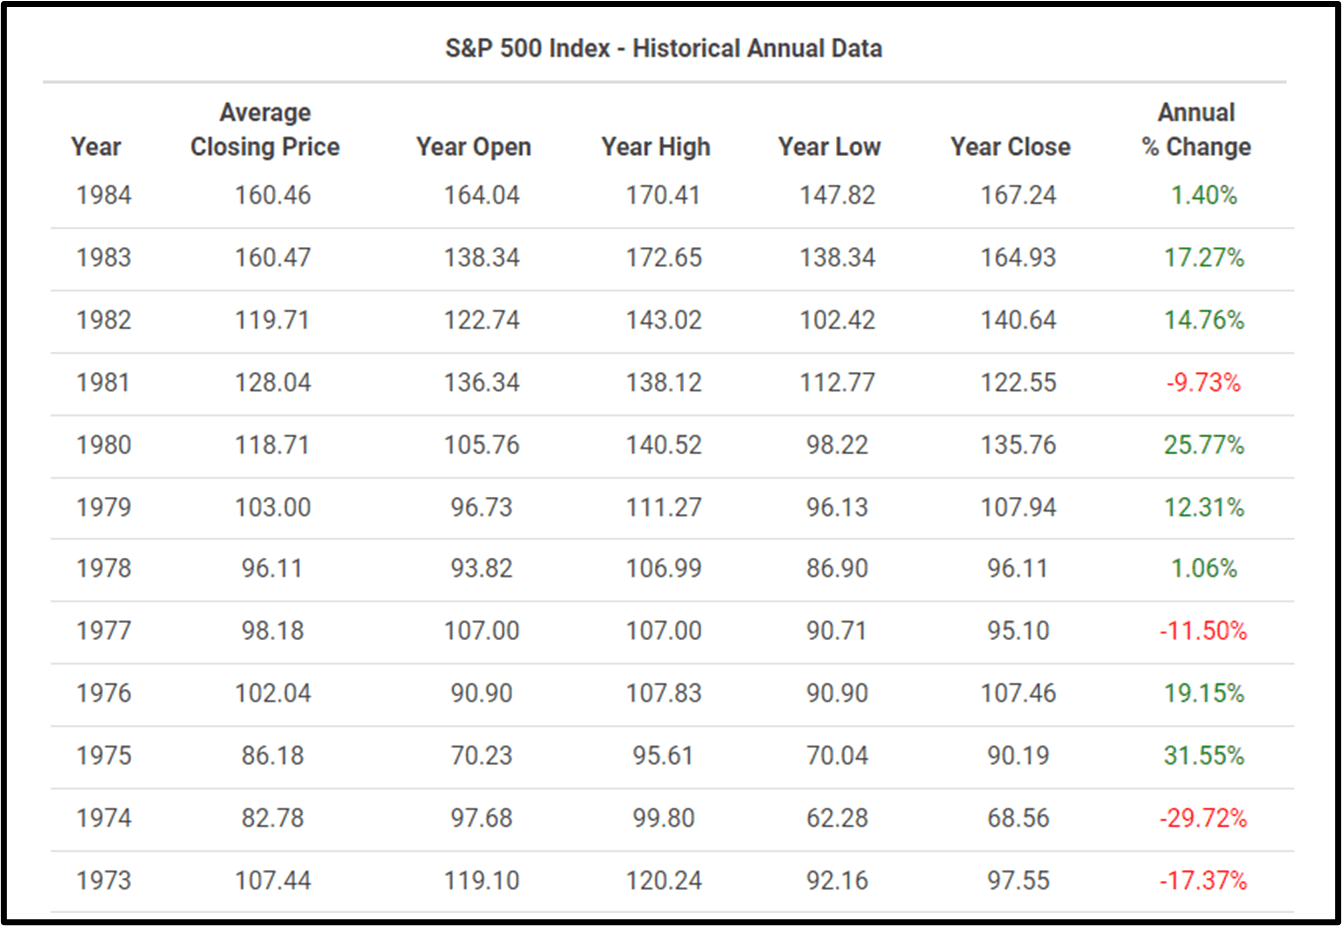
Since the algorithm identifies risk, avoiding drawdowns and riding upswings, do you think it could make money given the distribution of returns in this worst-in-memory stagflation period?
Personally, I believe we will transcend this 2022 stagnant market once U.S. supply sources stabilize, monetary integrity is restored, and worse-than-expected corporate earnings are in the rearview mirror. The Fed is addressing monetary integrity, and hopefully fiscal policy will return to a sane footing in the wake of the COVID crisis. The corporate earnings picture is yet to play out. But my point is that even an environment like the ’70s will provide plenty of profit opportunity as long as risk cycles can be identified with quantitative methods.
Closing
The punchline is this. Until I see a return to normalcy, my nominal equity commitment will be 10% of my portfolio; that commitment will vary from zero to 10% of my portfolio using outright buy and sell signals as well as variable ratios generated by the algorithm. The rest of my portfolio will be in floating-rate treasuries like TFLO and USFR with much smaller positions in higher-yield ETFs, mostly for tracking purposes. My purpose is to stay in the game so that the market bottom will be apparent through quantitative metrics. In the meantime, I’ll maximize dividends free of rate risk and credit risk.
That for me, is a comfort zone, suppressing greed instincts and preserving capital with only 10% of my portfolio dedicated to SPXL structures and most of 90% in floating-rate treasury ETFs. My constant refrain has been “follow your own risk appetite.” For myself, in this environment, that means ensuring modest low-risk gains to support my quasi-retirement lifestyle. I’ll step up the wealth accumulation when the chaos clears, probably within the next 3 to 12 months.
Be the first to comment