

Angel Di Bilio
Introduction
It has been nearly three years since I’ve written about Union Pacific (NYSE:UNP) stock, so I think it’s due for an update. My last two articles were on May 9th, 2019 titled “Union Pacific: A 10-Year Full-Cycle Analysis“, where I was bearish, and I followed that up with a “Hold”, or, “neutral” article later that year on October 3rd, 2019, titled “Revisiting My Union Pacific Sell Ratings“. In between my “Sell” and my “Hold” articles, this is how UNP performed.
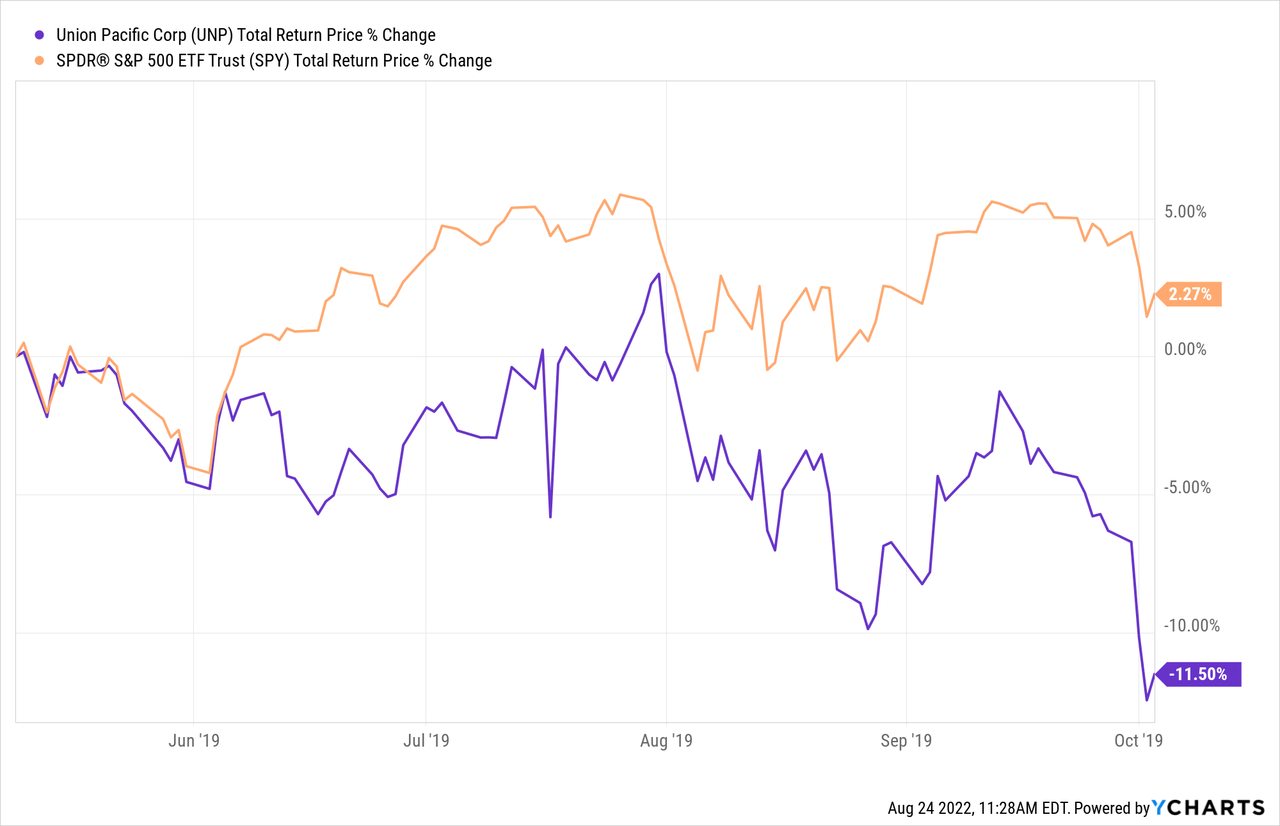
It fell a little bit, which, combined with rising earnings was enough to move UNP near the mid-point of fair value. For investors who rotated out of the stock due to valuation after my first article, it was okay at the point of publication of the second article to rotate their money back in. UNP never fell far enough to have a big enough margin of safety for me to buy personally, even during the March 2020 decline, though.
So, basically, my last UNP article was about 3 years ago and I valued UNP stock around the midpoint of fair value with roughly an 8% expected long-term 10-year CAGR.
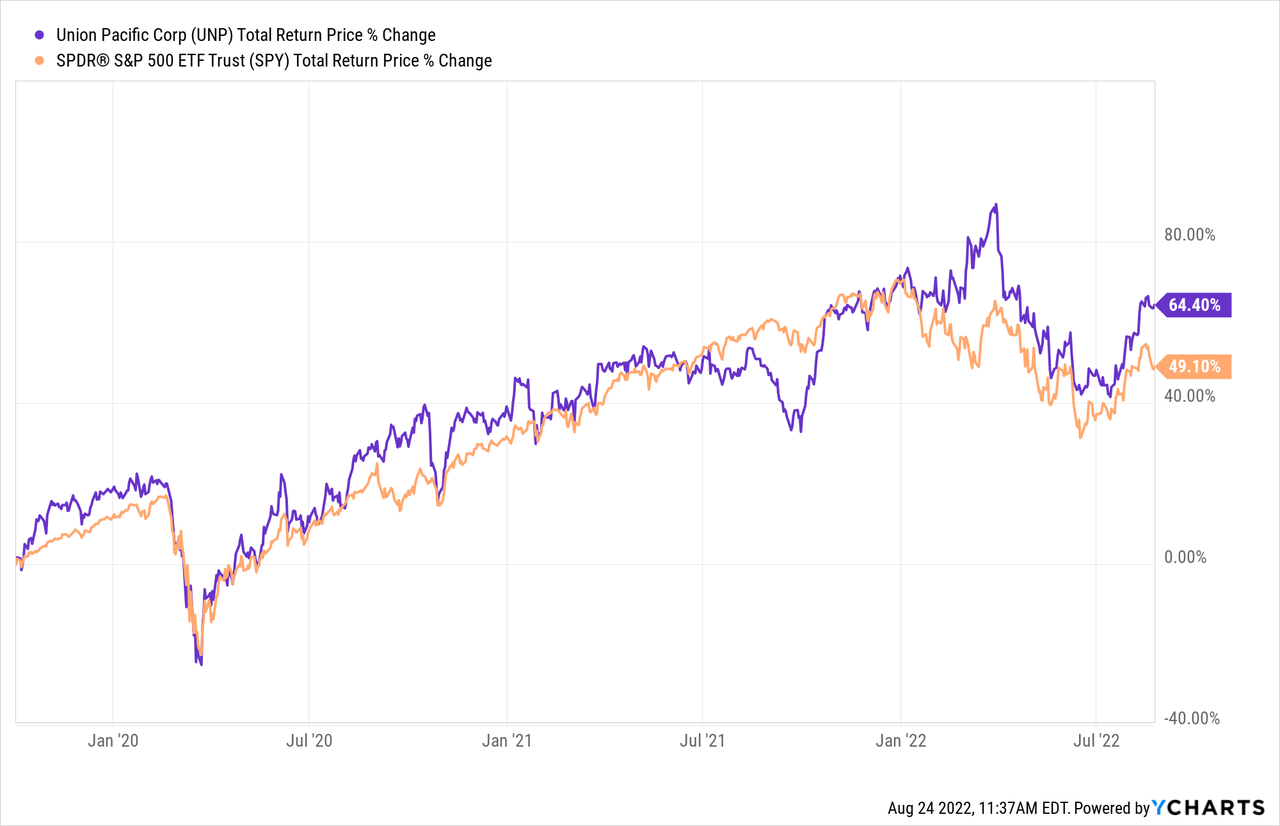
Government stimulus has without a doubt improved UNP’s absolute returns since then, but for most of this period it has been trading similarly to the S&P 500, with some underperformance in mid-2021, and some outperformance this year. Overall, though, I think it’s fair to call the relative performance average.
In this article, I’m going to review Union Pacific’s valuation, to see where the valuation stands today.
My Valuation Method For Union Pacific
The valuation method I use for Union Pacific first checks to see how cyclical earnings have been historically. Once it is determined that earnings aren’t too cyclical, then I use a combination of earnings, earnings growth, and P/E mean reversion to estimate future returns based on previous earnings growth and sentiment patterns. I take those expectations and apply them 10 years into the future, and then convert the results into an expected CAGR percentage. If the expected return is really good, I will buy the stock, and if it’s really low, I will often sell the stock. In this article, I will take readers through each step of this process.
(An interesting side note: When I wrote my very first UNP article back in 2018, I actually did not yet use this earnings-based classification of cyclicality. At that time I based my decision purely on historical price cyclicality. It wasn’t until around early 2019 I discovered it was better to use historical earnings patterns rather than price cyclicality (or industry, or analyst classification) to determine how cyclical a business really was.)
Importantly, once it is established that a business has a long history of relatively stable and predictable earnings growth, it doesn’t really matter to me what the business does. If it consistently makes more money over the course of each economic cycle, that’s what I care about — numbers over stories.
FAST Graphs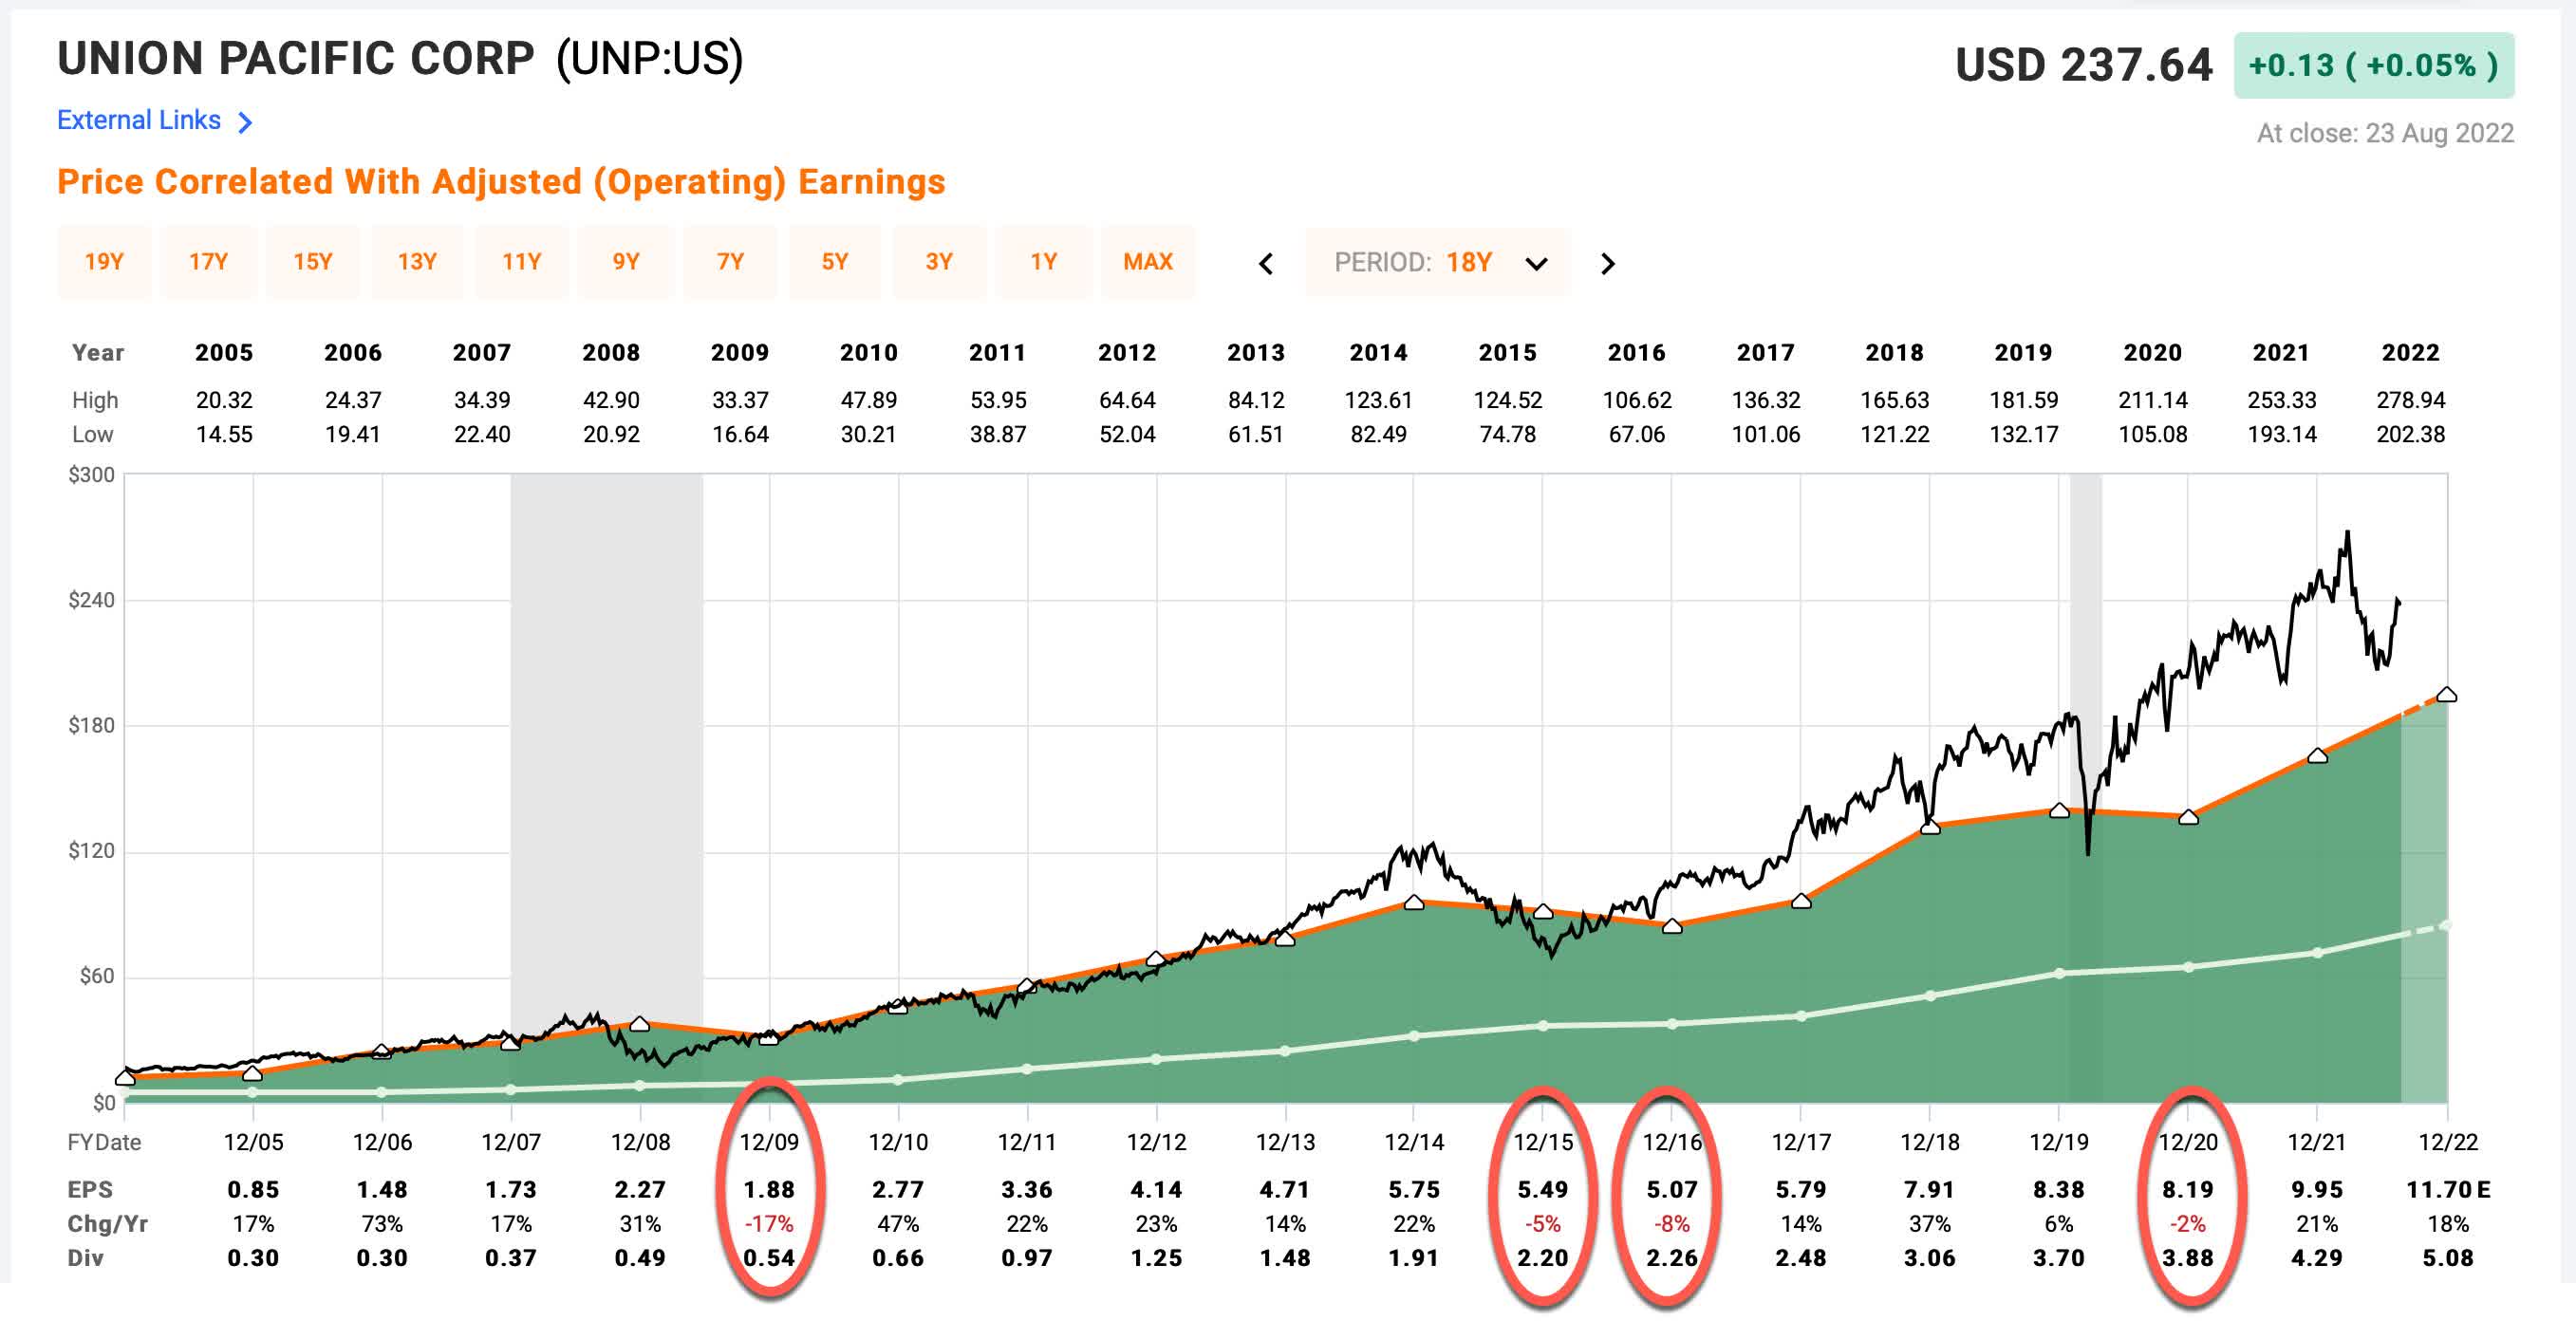
UNP’s historical earnings are represented by the dark green shaded area in the FAST Graph above. I have circled the negative EPS years in red. There have been 4 of those years since 2003. The deepest was a -17% decline in 2009. This suggests that UNP is not a particularly cyclical business, but we do need to be a little bit careful here. As we’ll see later, UNP buys back lots of stock, and that inflates EPS, reducing declines.
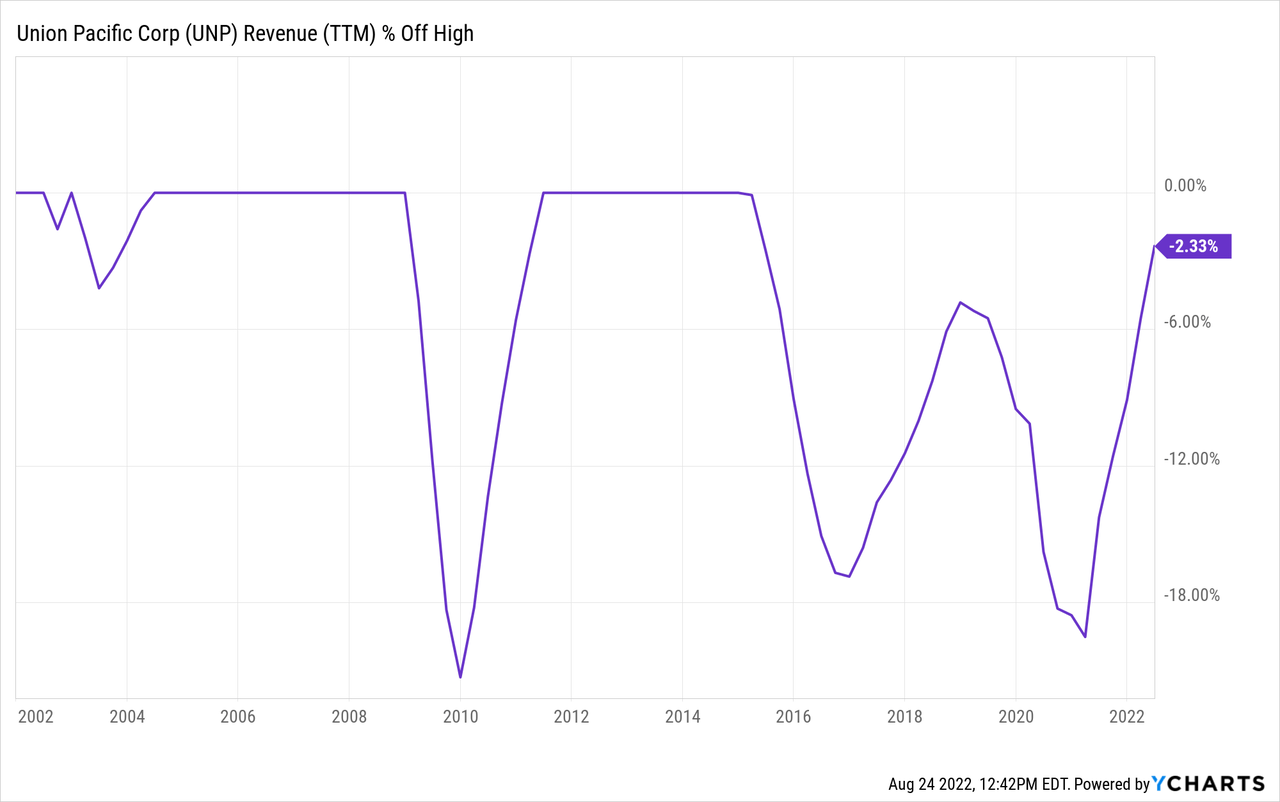
If we look at TTM Revenue % off high chart above, we can see that UNP is moderately cyclical in this regard. At least more so than the EPS trend suggests. It’s just something to keep in mind. I still think overall cyclicality is low enough to use an earnings-based analysis as long as it controls for buybacks (which I always do anyway).
Market Sentiment Return Expectations
In order to estimate what sort of returns we might expect over the next 10 years, let’s begin by examining what return we could expect 10 years from now if the P/E multiple were to revert to its mean from the previous economic cycle. For this, I’m using a period that runs from 2015-2022.
FAST Graphs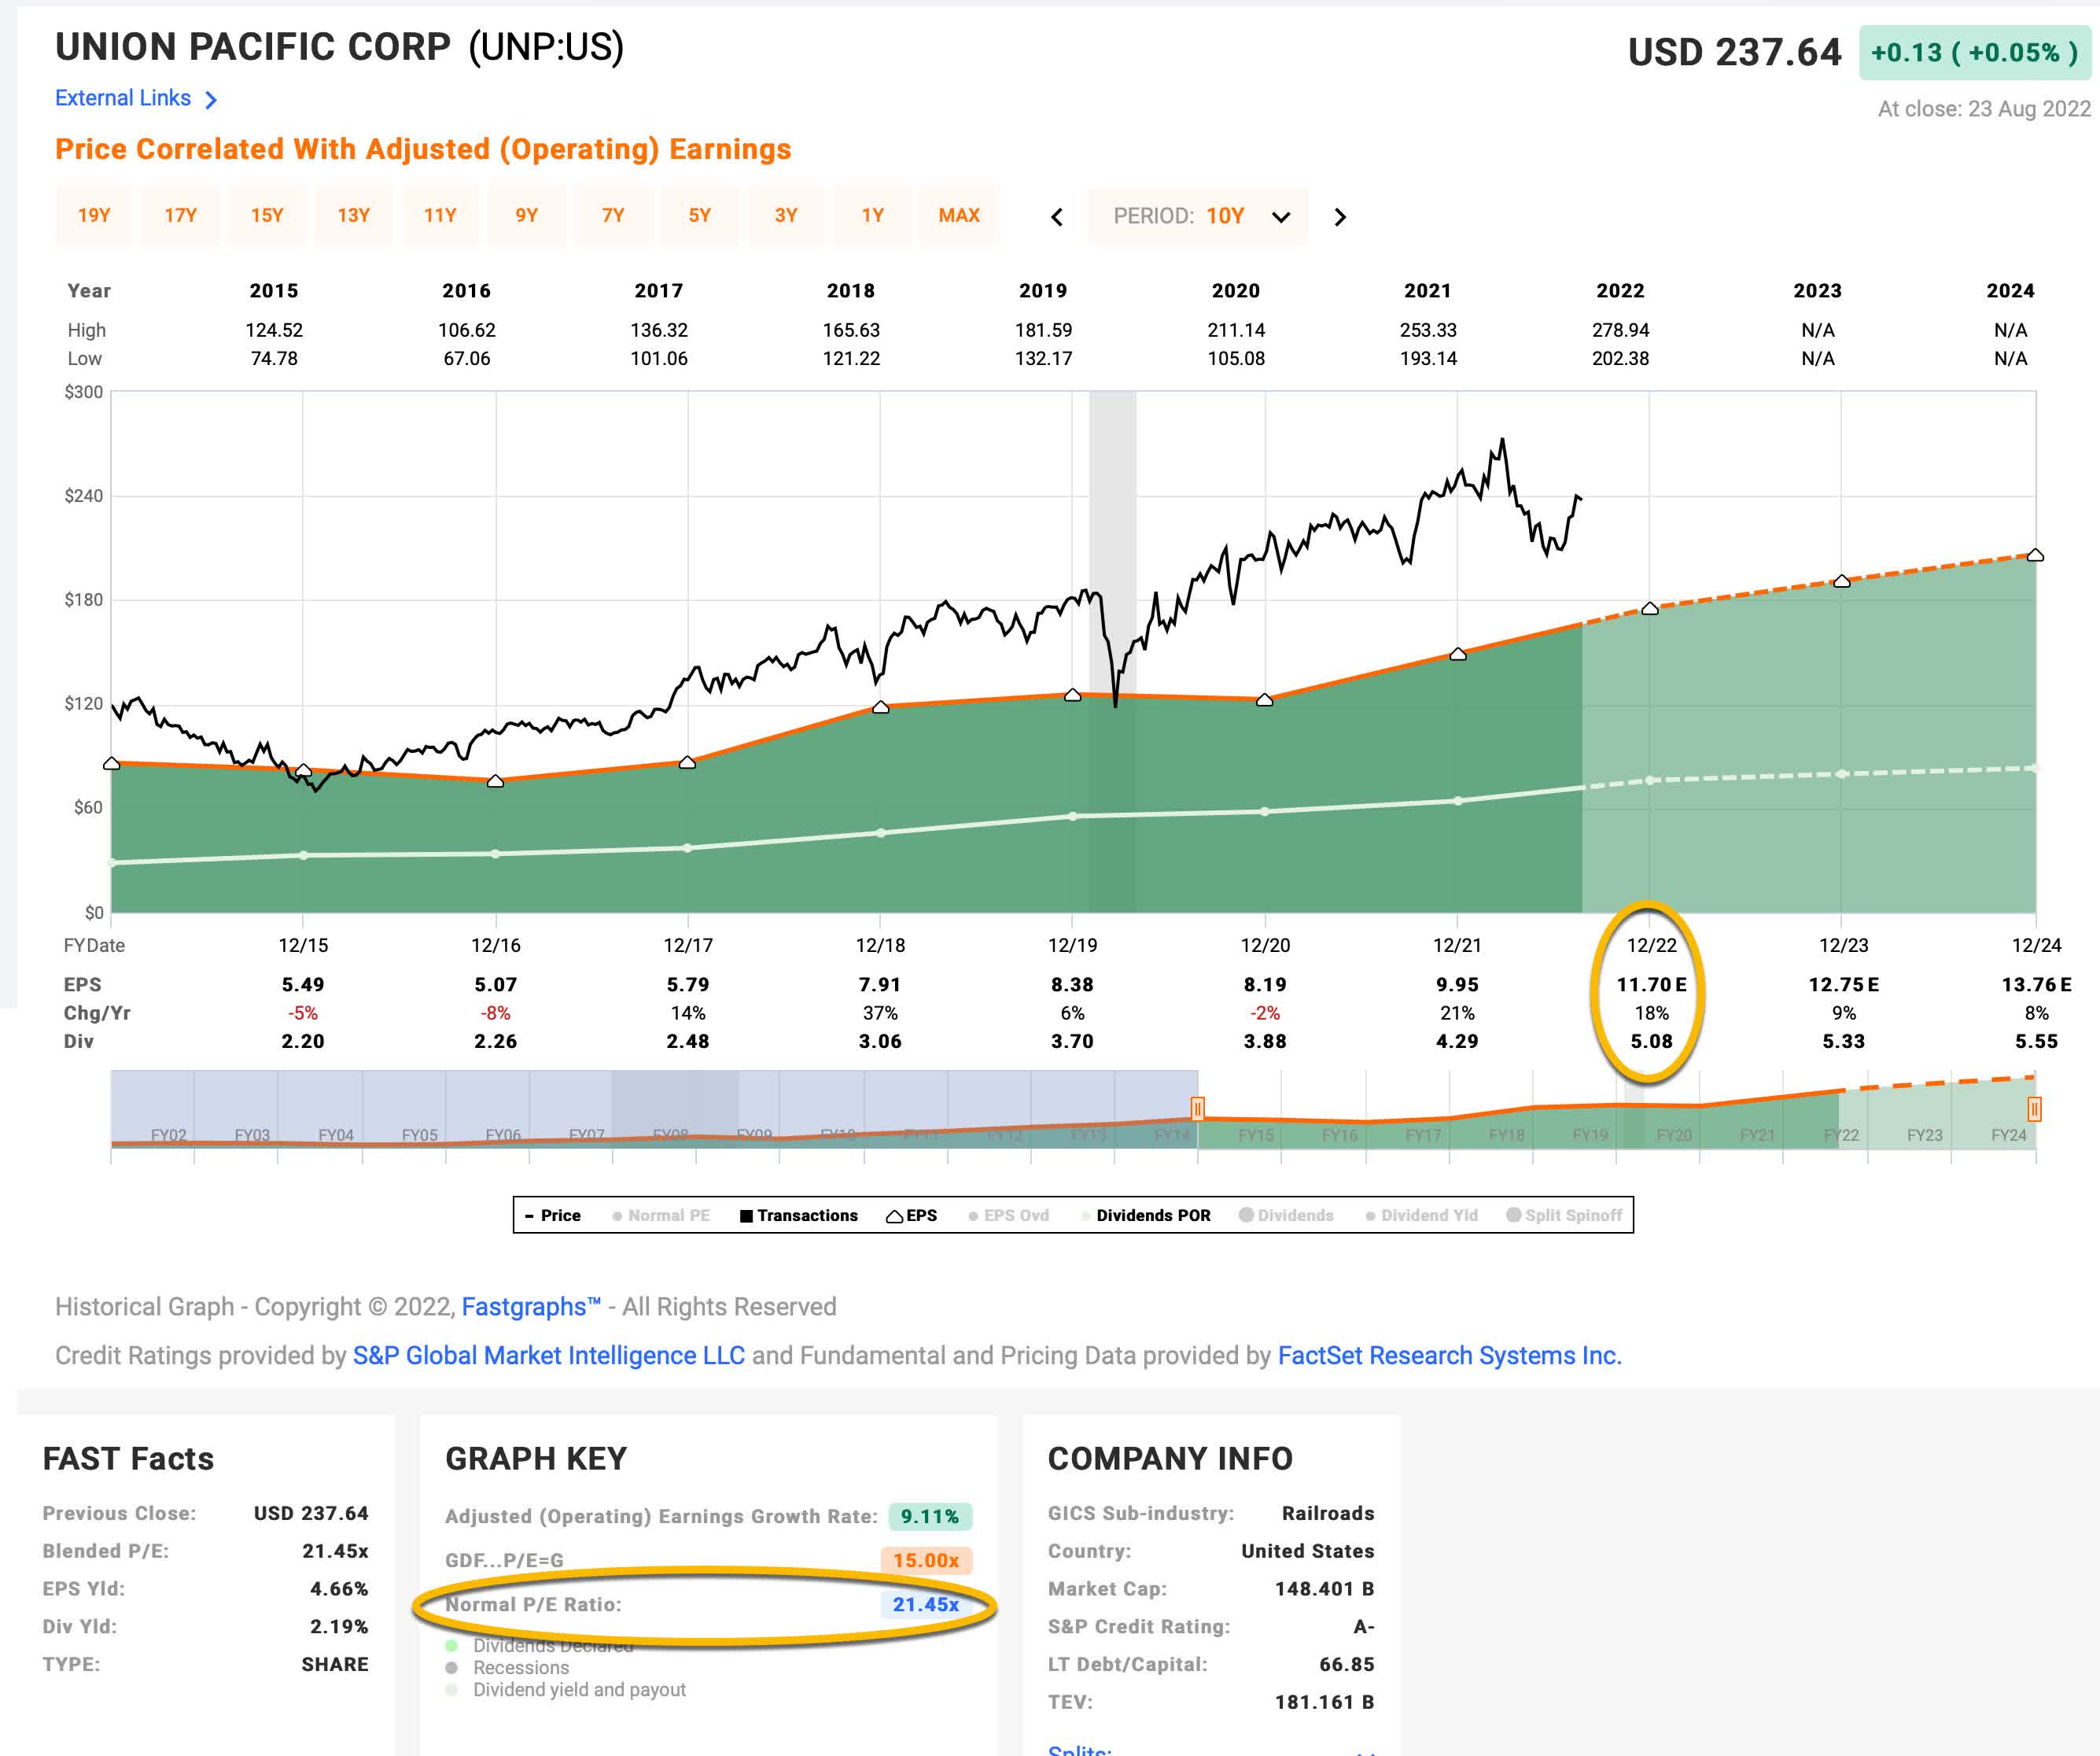
Union Pacific’s average P/E from 2015 to the present has been about 21.45 (the blue number circled in gold near the bottom of the FAST Graph). Using 2022’s forward earnings estimates of $11.70 (also circled in gold), UNP has a current P/E of 20.38. If that 20.38 P/E were to revert to the average P/E of 21.45 over the course of the next 10 years and everything else was held the same, UNP’s price would rise and it would produce a 10-Year CAGR of +0.51%. That’s the annual return we can expect from sentiment mean reversion if it takes 10 years to revert. If it takes less time to revert, the return would be higher.
Business Earnings Expectations
We previously examined what would happen if market sentiment reverted to the mean. This is entirely determined by the mood of the market and is quite often disconnected, or only loosely connected, to the performance of the actual business. In this section, we will examine the actual earnings of the business. The goal here is simple: We want to know how much money we would earn (expressed in the form of a CAGR %) over the course of 10 years if we bought the business at today’s prices and kept all of the earnings for ourselves.
There are two main components of this: the first is the earnings yield and the second is the rate at which the earnings can be expected to grow. Let’s start with the earnings yield (which is an inverted P/E ratio, so, the Earnings/Price ratio). The current earnings yield is about +4.91%. The way I like to think about this is, if I bought the company’s whole business right now for $100, I would earn $4.91 per year on my investment if earnings remained the same for the next 10 years.
The next step is to estimate the company’s earnings growth during this time period. I do that by figuring out at what rate earnings grew during the last cycle and applying that rate to the next 10 years. This involves calculating the historical EPS growth rate, taking into account each year’s EPS growth or decline, and then backing out any share buybacks that occurred over that time period (because reducing shares will increase the EPS due to fewer shares).
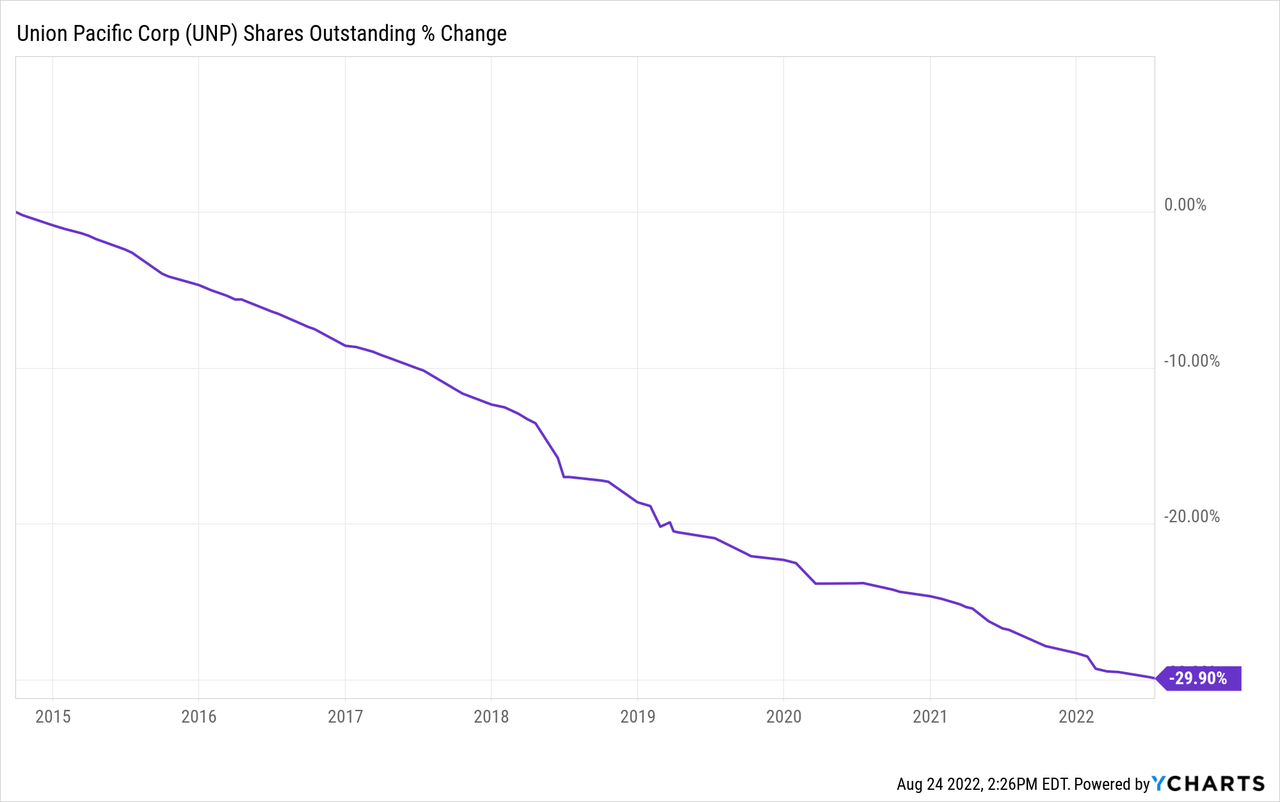
During this time period, UNP has bought back a massive amount of shares, nearly 30% of the company. I will make adjustments to my earnings growth estimates to account for these buybacks, as well as the negative EPS years. This will almost always produce a more conservative earnings growth estimate than most other techniques that don’t take these factors into account. When I do that, I get an earnings growth rate expectation of +4.48%. All things considered, that’s not too bad, but it’s much more conservative than the FAST Graph’s +9.11% measurement.
Just another little side-note here to illustrate my point about the earnings growth rate. If we look at the revenue growth rate over this period, which is unaffected by the stock buybacks we can see what I’m getting at.
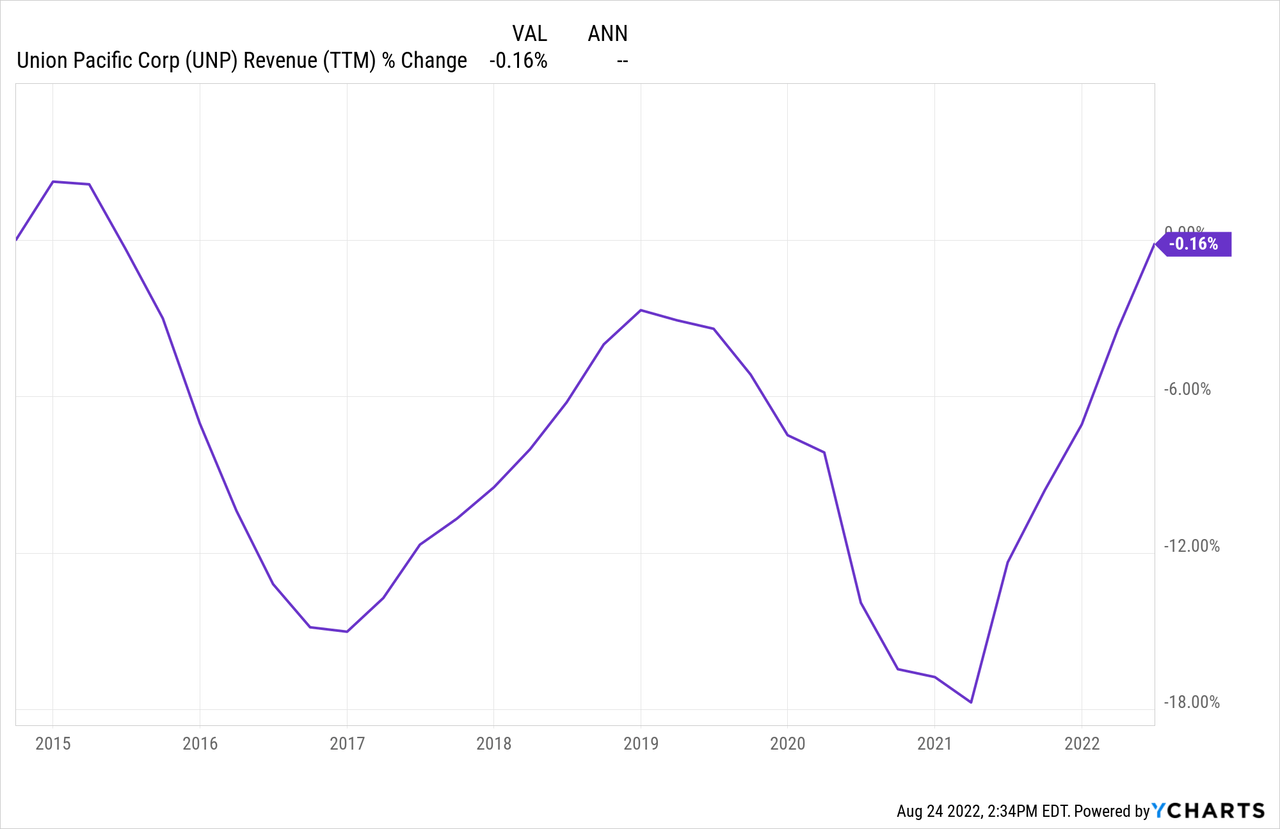
UNP’s revenue is flat over this same 7-year time period. Do we really think that each year they increased the efficiency of their business by 9%? Doubtful. Most of the gains in the earnings per share have likely come from financial engineering.
Next, I’ll apply that growth rate to current earnings, looking forward 10 years in order to get a final 10-year CAGR estimate. The way I think about this is, if I bought UNP’s whole business for $100, it would pay me back $4.91 plus +4.48% growth the first year, and that amount would grow at +4.48% per year for 10 years after that. I want to know how much money I would have in total at the end of 10 years on my $100 investment, which I calculate to be about $163.03 (including the original $100). When I plug that growth into a CAGR calculator, that translates to a +5.01% 10-year CAGR estimate for the expected business earnings returns.
10-Year, Full-Cycle CAGR Estimate
Potential future returns can come from two main places: market sentiment returns or business earnings returns. If we assume that market sentiment reverts to the mean from the last cycle over the next 10 years for UNP, it will produce a +0.51% CAGR. If the earnings yield and growth are similar to the last cycle, the company should produce somewhere around a +5.01% 10-year CAGR. If we put the two together, we get an expected 10-year, full-cycle CAGR of +5.52% at today’s price.
My Buy/Sell/Hold range for this category of stocks is: above a 12% CAGR is a Buy, below a 4% expected CAGR is a Sell, and in between 4% and 12% is a Hold. A +5.52% CAGR expectation makes Union Pacific stock a “Hold” at today’s price. I would consider this overvalued, but not necessarily overvalued enough that it is a clear “Sell”. And we kind of see this in its relative performance compared to the S&P 500 this year, in which it has outperformed a little bit even though the historical performance has been about the same. I would expect the stock to underperform the index by a little bit going forward, but I would not necessarily expect it to massively underperform.
Assuming today’s earnings trends stay intact, I would be a potential buyer of Union Pacific stock if the price were to fall below $154 per share. And if I was a current owner of Union Pacific stock (which I am not) I would be a seller if the price rose above $266 per share without a corresponding rise in earnings.
Conclusion
In terms of S&P 500 index stocks, overall, UNP is an average stock likely to produce average performance over the long term. One thing we can learn from examining Union Pacific stock is the power of buybacks and financial engineering in order to make the business appear as if it is growing faster than it really is. As long as UNP can keep up a mid-single-digit real earnings growth rate, those buybacks will be okay, but I think if growth ever does slow down in the future that investors will wish they had been paid a larger dividend instead. Despite being only moderately cyclical, it should be noted that if we do have a recession in the near future that UNP has historically had its stock punished pretty badly. If the stock were to revert to its previous recession P/E, the price would drop more than -50% from where it trades today. So, while the stock is not especially overvalued, it does still have outsized risk over the near term if we get a recession in 2023. On the flip-side, if you are waiting on the sidelines as I am, the stock has decent potential to offer up a compelling value during a recession. If investors start panicking at that time, it would be a good time to buy.
Be the first to comment