

mixmotive
Business Overview
Union Pacific (NYSE:UNP) is a major component of the US Railroad Transportation sector. This sector is relatively mature and has historically been very cyclical. The sector’s commercial revenues are heavily influenced by the state of the North American economy.
The company currently has 3 reportable operating segments:
Author’s compilation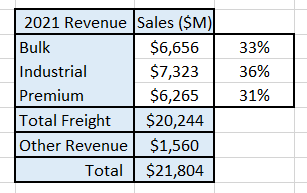
According to the Association of American Railroads there are seven Class 1 railroad companies operating in the US. In 2021, these Class 1 railroads had a combined operating revenue of $70 Billion per year and accounted for an estimated 94% of all freight revenues (there are other smaller railroads which connect to the main networks which account for the remainder of the freight task).
Union Pacific has grown through a combination of natural sector growth and through strategic acquisitions and mergers (although not for some years due to the concentrated nature of the sector). Union Pacific is the largest pure play railroad by market capitalization (BNSF is larger but it is a division of Berkshire Hathaway).
The railroads’ main competitor is generally the road network. For some commodities, such as petroleum products, it can also be a pipeline. The road network is not an effective competitor for bulk products such as coal and grain because of the sheer volumes involved. Nevertheless, the road network will often influence the prices charged by rail operators.
There appears to be only marginal competition between railroads. This is because there is limited network overlaps between companies. There is some customer shifting between companies but this generally only occurs when the customer is located close to both networks.
The mature nature of the US rail freight sector can be seen from the following chart which shows the historical size of the rail freight task:
Federal Reserve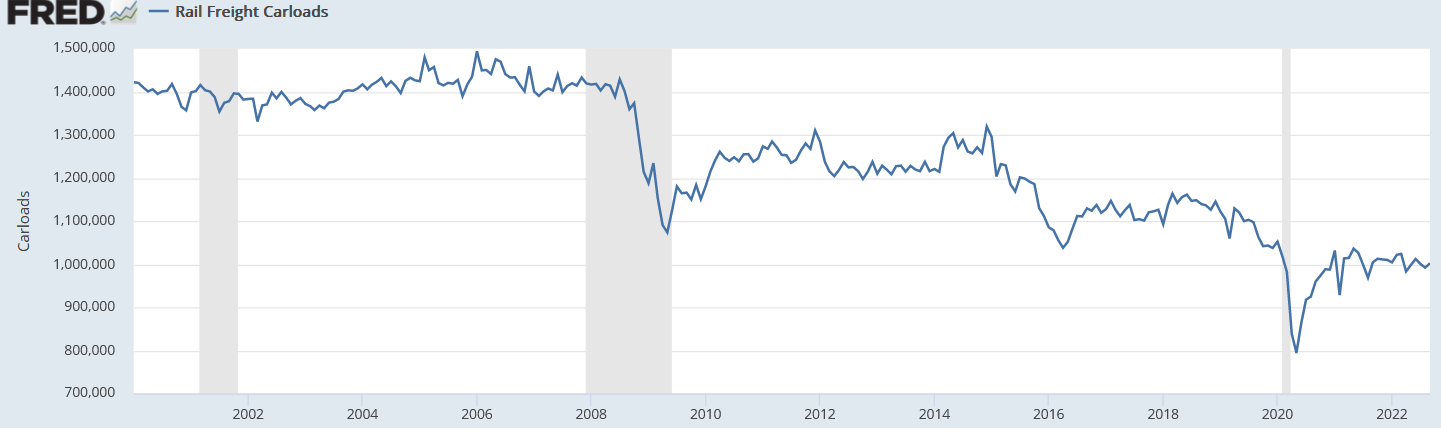
The chart shows the steady decline in the size of the US rail freight task over the last 20 years. It also demonstrates the impact that a severe recession such as the global financial crisis and the COVID shutdowns can have on volumes.
Over this time period there has also been a significant shift in the product mix transported on the rail network and this is shown on the following chart:
Association of American Railroads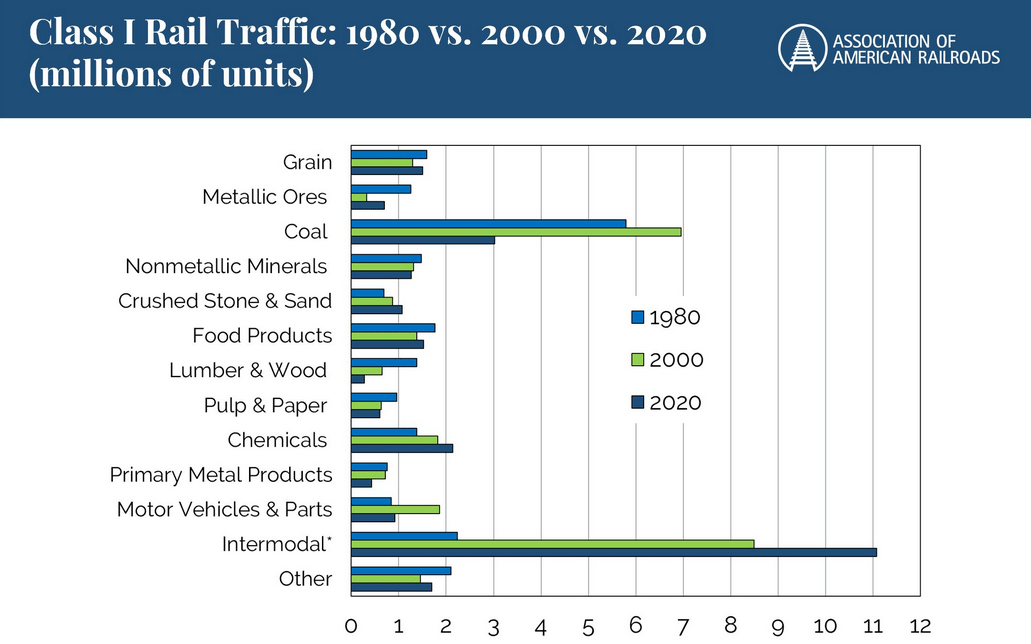
The most significant changes have been in the decline of coal volumes and the growth in intermodal volumes. Historically this would have not necessarily been a positive for railroad profitability as generally bulk shipments such as coal have much higher margins than intermodal shipments (intermodal products require more handling and there is pricing tension from road freight competitors).
What is happening with pricing?
Union Pacific publishes a document annually called a Fact Book which contains all the key statistics for its business. From this document we can derive what customers, on average, are paying per ton mile for each of the segments of its business.
The total ton-miles is an important measure of activity for transportation companies (particularly railroads) – it calculates the volume of freight carried (tons) by the distance carried (miles).
This chart shows the total ton miles hauled by Union Pacific and the average revenue per ton mile over the same period:
Author’s compilation.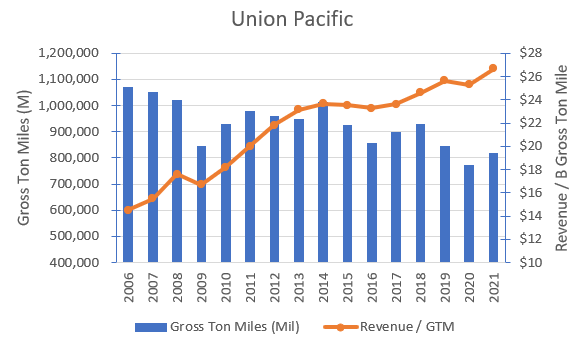
The chart shows that Union Pacific has been carrying less freight but has been securing better prices over time. Volumes have declined as the amount of coal shipped has declined but Union Pacific has been able to raise prices across its remaining customers.
We can establish what has been happening to operating margins over time by charting revenue and costs per billion gross ton miles:
Author’s compilation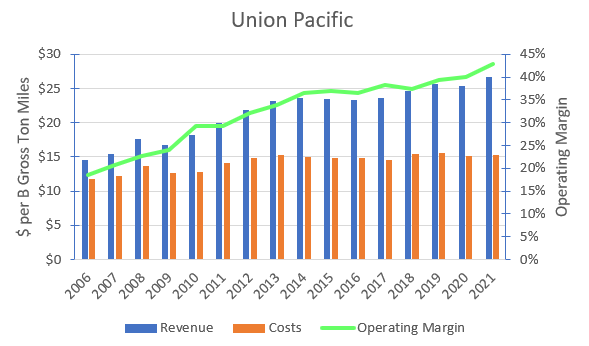
Union Pacific has done an outstanding job of increasing unit revenue prices whilst holding costs relatively flat thus expanding margins to levels never seen before in the company’s history.
The Union Pacific experience has been a common trend across the entire US Class 1 rail sector. Volumes are modestly declining, but prices and margins are rising. This can be seen in the following chart:
Author’s compilation.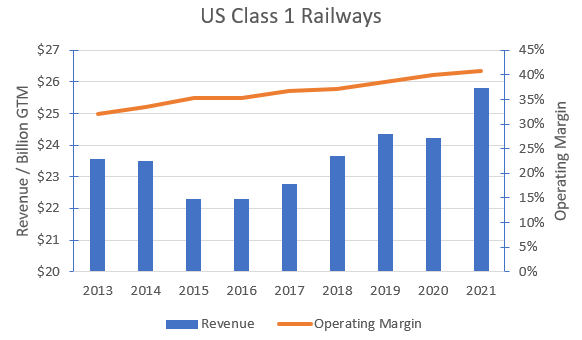
Union Pacific’s Strategy
The cornerstone of Union Pacific’s strategy has been the implementation of Precision Scheduling Railroading (PSR).
PSR was thought to have been developed by E. Hunter Harrison and first implemented at Illinois Central Railway (IC) in 1993 when he was the Chief Executive Officer of the railway. When IC was taken over by Canadian National in 1998, Harrison implemented it there as well. To a large degree, Union Pacific was late to the party and its implementation did not commence until in 2018.
PSR focuses on what I term “lean” practices. The concept of lean has been applied to industrial operations since its development in 1991. The idea is to transform the industrial workflows in order to optimize the inputs to the process – people, materials and equipment, in order to more profitably meet customer expectations. A key to lean operations is to eliminate waste both in terms of the process inputs but also in the time taken for the process to complete its task.
Union Pacific’s strategy has resulted in:
- Improved productivity in people and assets.
- Increased train lengths.
- A simplified footprint requiring fewer yards and terminals.
- Fewer locomotives with increased reliability and operating times.
- Increased automation.
The success of the program has been demonstrated by the “flat-lining” of costs on a per unit of gross ton mile basis.
Union Pacific’s Historical Financial Performance
The following chart shows Union Pacific’s reported sales and adjusted operating margins:
Author’s compilation.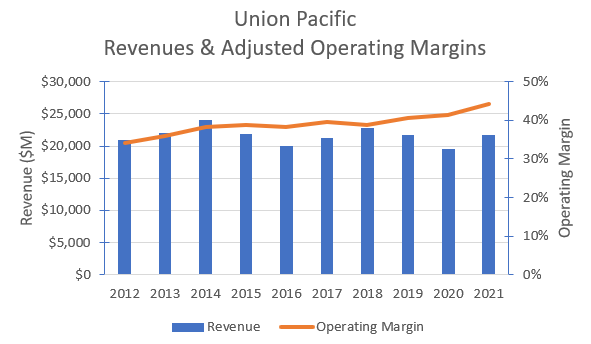
It should be noted that I have made one adjustment to Union Pacific’s published financial statements. I have eliminated the interest expense component of operating leases from the operating expenses because it is really a funding cost and not an operating cost.
The chart shows very clearly that aggregate revenues are not growing but operating margins have increased spectacularly.
Union Pacific’s Moat
Union Pacific has a strong competitive position with the size of its “moat” varying depending upon which sector of the freight market it is competing against. My assessment is shown in the following table:
Author’s compilation.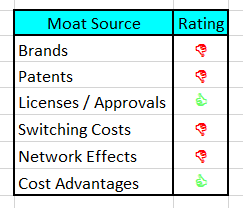
Union Pacific’s core competitive advantage is the relative uniqueness of its asset (the location of the railway). The asset’s location coupled to Union Pacific’s regulatory licenses / approvals to operate plus its relatively low operating cost places it in a strong competitive position.
I think that it is unlikely that Union Pacific’s moat will be breached for many years for bulk commodities, but the road network will always apply competitive pressure to its intermodal tasks. This should ensure that Union Pacific’s future returns on invested capital will be above its cost of capital well into the future.
The strength of a company’s moat is generally demonstrated by its long-term return on invested capital. The following chart is my estimate of Union Pacific’s historical return on invested capital (ROIC):
Author’s compilation.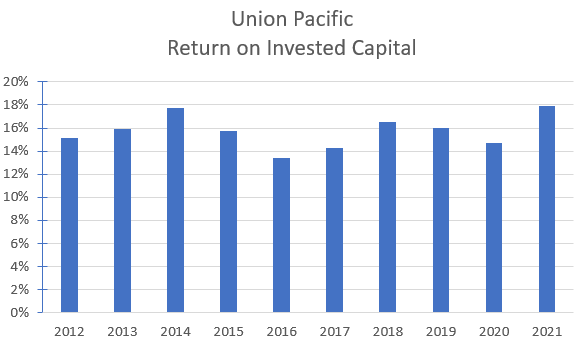
Based on Union Pacific’s ROIC I would classify its moat strength to be moderate to strong. The median ROIC in the global rail sector is 6.3% and Union Pacific’s ROIC is in the highest decile of the sector.
Union Pacific’s Capital Structure
The following table shows the change in Union Pacific’s capital structure over time:
Author’s compilation.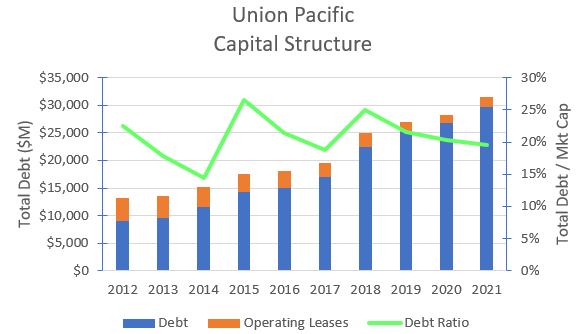
The chart shows that Union Pacific has carefully increased its debt levels in lockstep with its market capitalization. This has ensured that its debt ratio is maintained within a reasonably narrow band.
The global sector’s median debt ratio is 26% and Union Pacific is unsurprisingly close to this figure. I have no significant concerns regarding Union Pacific’s capital structure whilst its market capitalization is at current levels.
Union Pacific’s Cash Flows
The following table summarizes Union Pacific’s cash flows for the last 10 years:
Author’s compilation.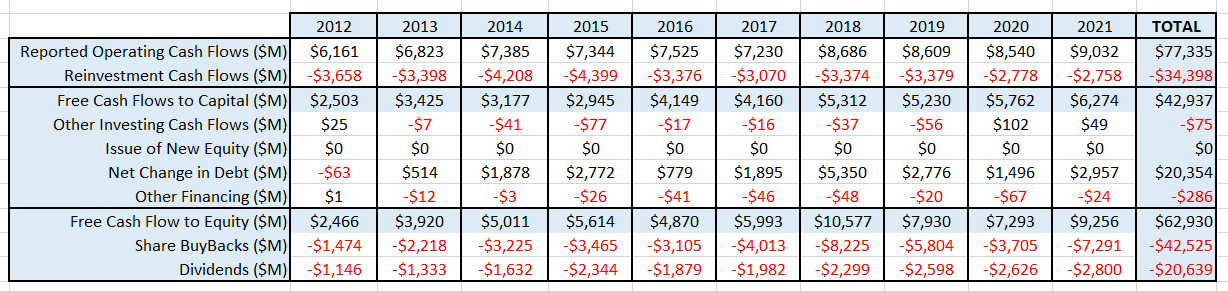
The above table shows that Union Pacific generates a healthy level of free cash flow to capital (even though it is reinvesting significantly more than its depreciation charge). Over the last 10 years, in simple summary terms, the free cash has been used to fund the share buybacks and the incremental debt has been used to fund the dividend payments.
Although not shown here, there is consistently good alignment between the reported Net Profit After Tax and the Net Operating Cash-Flow. This gives me confidence that there is little (if any) management “smoothing” of the reported profit.
I expect that the economy may be slowing over the next year, and this will probably lower Union Pacific’s free cash flow (due to lower volumes and margins). The table suggests that there is a lot of buffer before the dividend payment would be impacted but it would definitely cause the quantum of share buybacks to decline.
Recent Share Price Action
Yahoo Finance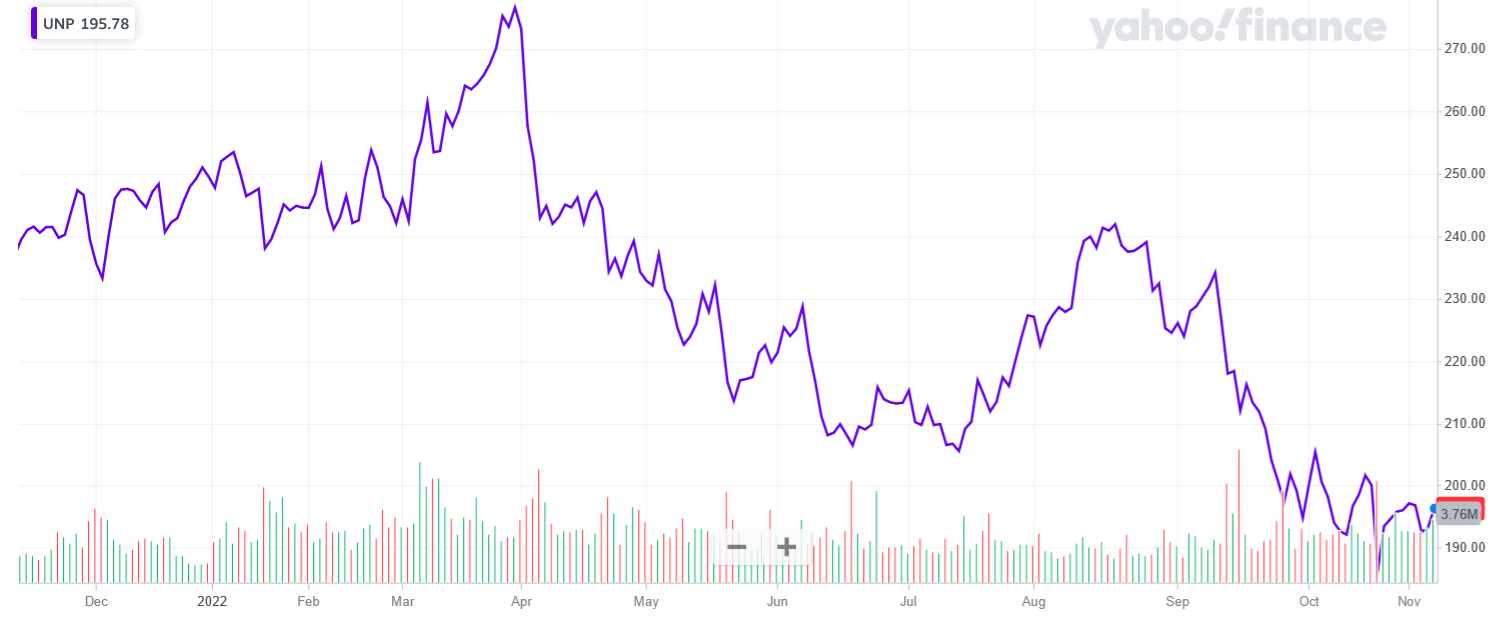
Source: Yahoo Finance
The chart indicates that over the past year the Union Pacific share price has decreased by almost 17% which is broadly in line with the S&P 500 index.
Historical Returns
Author’s compilation.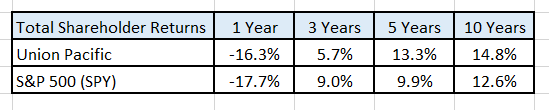
The data from Yahoo Finance shows that over the longer-term, Union Pacific has consistently outperformed the S&P500 index but over the last 3 years the performance comparison has been more mixed (probably a reflection of Union Pacific’s price getting ahead of its business fundamentals).
Key Risks Facing Union Pacific
In my opinion Union Pacific’s management has relatively few issues to focus on. The business is mature so there is very little effort to be devoted to growing the business.
This business is cyclical, and volumes are linked to the health of the economy. The biggest risk is that management is not able to efficiently link the company’s cost structure to the immediate business needs. Union Pacific’s management is very experienced and although it has been many years since the business has suffered a significant economic decline in volume it is in the DNA of all railway management to be able to swiftly respond to changing economic conditions.
From an investor’s perspective one of the key risks is that the sector’s operating margins revert back towards historical levels. US margins are currently in the highest decile globally for this sector.
The remaining major risks are all within management’s control. They must continue to ensure that the business remains customer focused whilst ensuring unit operating costs are continuously driven lower and that capital is spent wisely.
It goes without saying that system safety is of paramount importance. The rail franchise will only be maintained if the safety of the community where it interfaces with the railway is kept as safe as reasonably practicable.
My Investment Thesis for Union Pacific
We have reached an interesting point in the current global economic cycle. Political tensions in many parts of the world (Russia and China in particular) have led western countries to reconsider their attitude towards the globalization of free trade. For the US this may mean the “reshoring” of some strategically important manufacturing processes which have been outsourced (mainly) to China. The reshoring of some manufacturing back to the US could potentially be beneficial for Union Pacific however I don’t expect this to happen for another year or two.
More immediately, global economic activity appears to be slowing and a recession is expected within the next few months. A recession would certainly cause rail volumes to decline. I think that the coming recession could have an economic impact similar to the 2008 / 09 recession.
Rail volumes in 2009 declined year on year by 16% but took almost 4 years to recover back to pre-recession levels.
My valuation is based on the following narrative assumptions:
The railway’s current base volume remains flat for the next 10 years. Reshoring of some strategic manufacturing generates an additional 5% of base volume from 2024. The additional reshoring volume may possibly generate more volume than 5% but I expect that coal volumes will decline due to climate change policy and this will negate some of the potentially higher reshoring volume.
The US enters a 12-month recession in 2023 and as a result the 2022 base volume declines by 15% in 2023. In 2024, 75% of the recessionary volume loss is recovered and the remaining 25% is recovered in 2025. From 2025 onwards there is no change in the base volume (it remains at 2022 levels).
Average car-load prices will decline by 6% (in line with the 2008 / 09 experience) during 2023 but they are fully recovered in 2024. From 2024 onwards, average car-load prices will increase by 3.8% per year (the current 10-year Treasury bond yield which I have assumed will approximate the rate of inflation).
Operating margins will decline by 1% during 2023 but are recovered in the following year and remain flat for the remainder of the forecast. There are no expected changes in the rate of capital spending over the life of the forecast.
I don’t expect that Union Pacific’s operating footprint to change significantly over the forecast period.
Key Inputs in Union Pacific’s Valuation
- Revenue declines by 20% in 2023 as a result of the recession due to lower volumes and lower prices.
- Revenues recover back to 2022 levels by the end of 2024 following the partial recovery from the recession and the commencement of new volume from reshoring.
- Volume losses from the recession are fully recovered in 2025 and revenues grow at 3.8% ± 1.5% for the remainder of the forecast (this is all price related).
- The operating margin drops to 39% during the recession but from 2024 recovers back to 40% ± 2% for the remainder of the forecast.
- The reinvestment rate is expected to be the sector average of 0.6 ± 0.1 for the for the forecast period.
- Union Pacific’s moat is expected to remain intact for the forecast period and consequently I expect that the perpetual ROIC will be 11% ± 1%.
- I have used the Capital Asset Pricing Model (CAPM) to calculate Union Pacific’s current cost of capital to be 7.6% This is based upon the US risk free rate of 3.8% and an Equity Risk Premium of 5.48% (Damodaran’s November 2022 estimate).
- I have assumed a long-term effective tax rate of 23%.
- As there is no detail provided, I have valued the Investments on the Balance Sheet at book value.
- I have estimated that the value of the management options to be $290 M.
- I have used the 2022 Q3 share count of 620.4 M.
Discounted Cash Flow Output
The output from DCF model is in $USD:
Author’s model. Author’s model.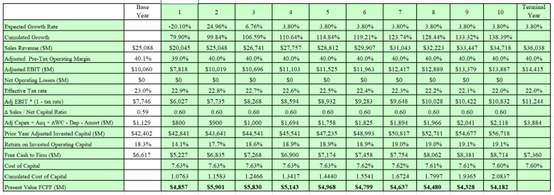
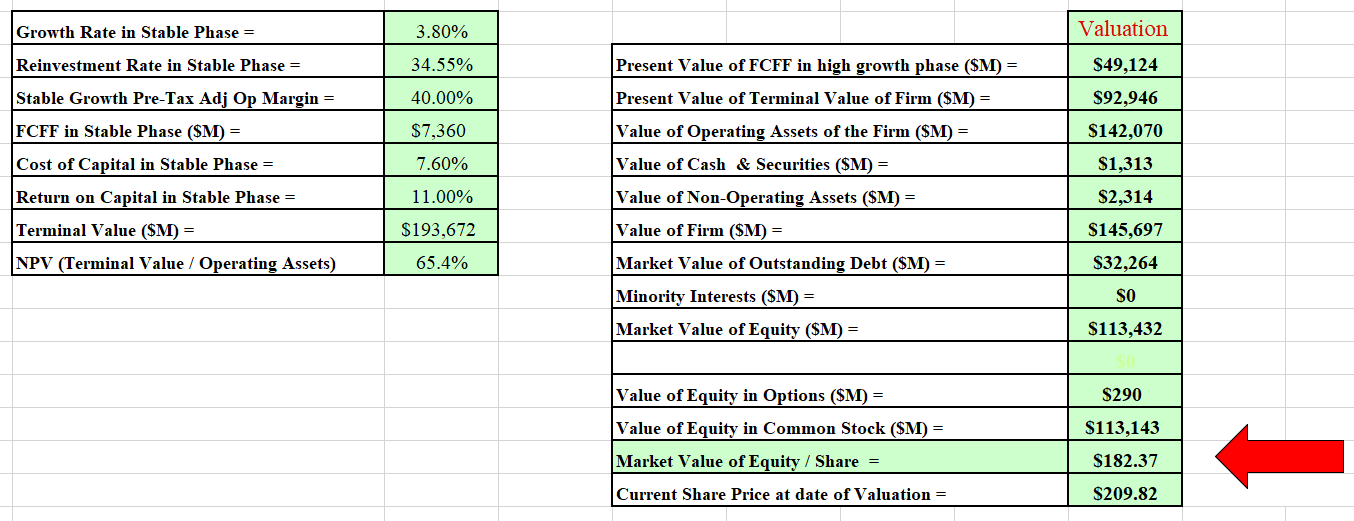
My DCF model estimates that the intrinsic value of Union Pacific is currently around $182 per share.
I also developed a Monte Carlo simulation for the valuation based on the range of inputs for the valuation. The output of the simulation was developed from 100,000 iterations:
Author’s model.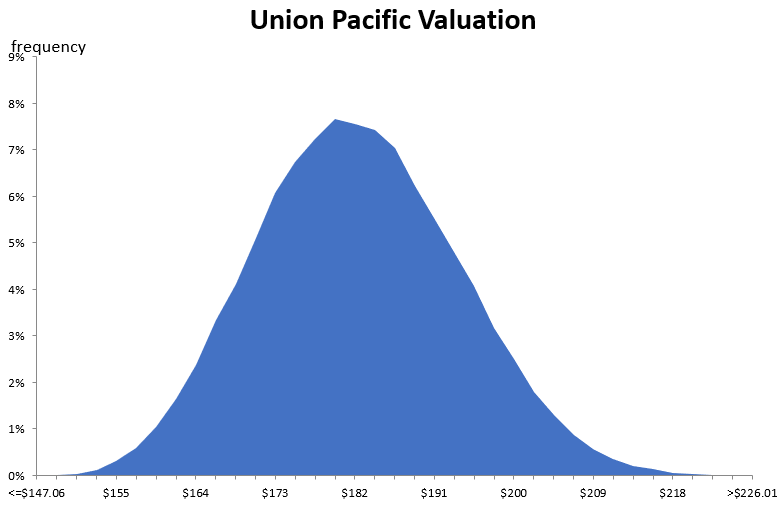
The simulation can help us understand the major sources of sensitivity in the valuation. In this scenario, the valuation is very sensitive to the operating margins and the terminal cost of capital. These two inputs represent the greatest source of risk in the valuation.
The simulation indicates that at a discount rate of 7.6%, the valuation for Union Pacific’s equity per share is between $147 and $226 with an expected value of $182.
Based on my scenario, Union Pacific is currently priced at the top end of fair value.
How is Union Pacific currently priced relative to its US competitors?
The following table shows the relative valuation of Union Pacific and its listed competitors:
Author’s compilation.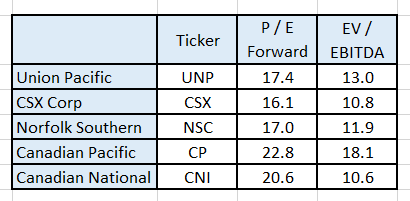
Source: Author’s compilation using data from Yahoo Finance.
The data indicates that Union Pacific is currently priced in the “middle” of the range of its competitors.
Over the last 20 years Union Pacific has traded at an average P / E ratio of 18 times current earnings (author’s calculation using data from Guru Focus).
What happened to Union Pacific’s share price during the last 3 US recessions?
The following table indicates the highest price for the S&P 500 index and for Union Pacific prior to each of the recessions and the lowest price reached during the recession:
Author’s compilation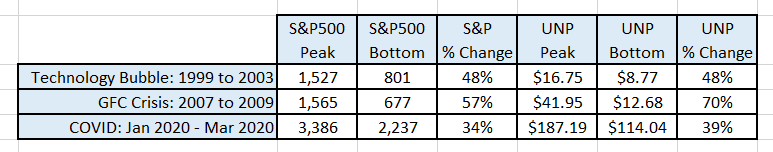
Source: Author’s compilation using data from Yahoo Finance.
The data indicates that Union Pacific’s share price (in percentage terms) has fallen by at least as much as the market index during the last 3 recessions.
Final Recommendation
I have valued Union Pacific many times over the last few years. Rarely is the company cheap and frequently I find that it is over-priced relative to its intrinsic value.
Based on my recession scenario and a modest reshoring of US manufacturing over the coming years I think that Union Pacific is currently at the top end of its valuation range.
Given that many macro indicators are predicting a coming global recession I think that there is a high probability of a reasonable market correction sometime in the next few months. As a result, I think that investors should wait for a lower price before buying Union Pacific.
For existing holders of the stock, I would be assessing the stock’s weighting in their portfolio and consider reducing the holding to a lower level.
Union Pacific is an excellent company, it is well managed and it has a reasonably strong competitive moat – but it currently doesn’t represent good value.
I have been and I want to continue to be a long-term holder of Union Pacific stock but I have been trimming my holding and it is currently at a minimum level in my portfolio.
Be the first to comment