

syahrir maulana
By Mark Barnes, PhD, and Christine Haggerty, Global Investment Research
After leading the global equity selloff earlier this year, US small caps have begun showing signs of life since summer, riding the periodic bursts of optimism about the outlook for inflation and hopes for some let-up in future Fed rate hikes. Albeit brief, these glimmers of small-cap vigor suggest how the tides of investor favor might flow once the pivot does come and/or risk appetite improves more resolutely.
As shown below, the Russell 2000 took a bigger beating than the Russell 1000 and broad markets elsewhere in the brutal first-half meltdown. But as sentiment and equity markets have revived more broadly, the US small-cap index’s fortunes have taken a turn for the better. Buoyed by a 10.4% jump in July, the Russell 2000 sustained smaller losses than both the Russell 1000 and the FTSE All-World ex USA in Q3. It also strongly outpaced both indexes in the global equity rally in October.
Though the broader US stock market still ranked among the worst performers globally for the year to date ending October 31, the Russell 2000 has fared modestly better than its large-cap counterpart.
FTSE Russell equity returns (TR, LC %)
Past performance is no guarantee to future results. Please see the end for important disclosures. (FTSE Russell. Data through October 31, 2022)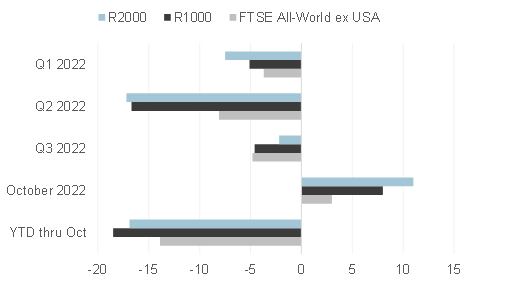
US small caps ride rotation into cyclical stocks in October
The US stock rally in October was dominated by a strong broad-based rebound in cyclical stocks, many of which had been the hardest hit in this year’s broad market downturn. All 11 industries in the US posted positive absolute returns for the month. Topping the list was energy, which extended its yearlong winning streak with a 23.7% gain, followed by industrials (up 13.0%), financials (up 11.9%), telecom (up 11.1%) and basic materials (up 9.6%). The biggest laggards were consumer discretionary and technology, which posted respective increases of 2.5% and 4.2%.
The Russell 2000 had a clear advantage over the large-cap index in this cyclical rotation. As illustrated below, the small-cap index has a much larger exposure to outperforming energy, industrials, financials, and basic materials stocks than the Russell 1000 (with an overweight of 13 percentage points) and far less so to underperforming growth stocks.
Industry weights (%) – as of October 31, 2022
Past performance is no guarantee of future results. Please see the end for important legal disclosures. (FTSE Russell. Data as of October 31, 2022)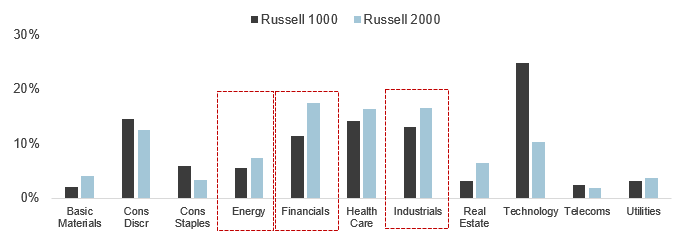
Broken down by industry-weighted contributions to returns, small-caps outstripped their large-cap peers in eight of 11 industries, led by consumer discretionary, financials, industrials, and real estate.
Industry-weighted contributions to returns (%) – One month ended October 31, 2022
Past performance is no guarantee of future results. Please see the end for important legal disclosures. (FTSE Russell. Data as of October 31, 2022)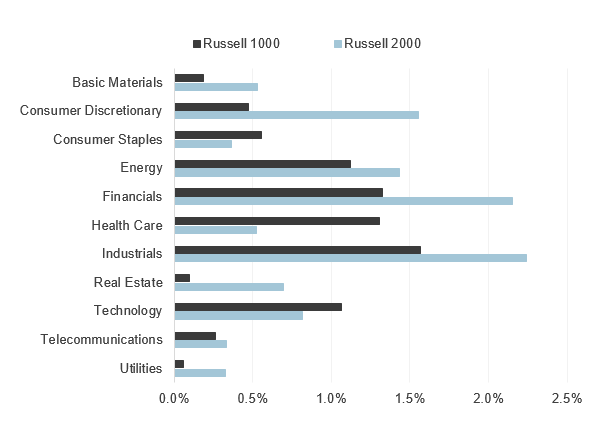
The chart below illustrates how the small-cap index’s greater tilt to cyclical outperformers played out across sectors last month. Though cyclically sensitive sectors within the energy, financials, industrials, and consumer discretionary were among the top 10 contributors for both Russell indexes, oil & gas, banks, REITs, travel & leisure and industrial support services were far more additive to small-cap returns than their large-cap peers.
Top 10 sector-weight contributions to returns (TR %) – one month ended October 31, 2022
Past performance is no guarantee of future results. Please see the end for important legal disclosures. (FTSE Russell. Data as of October 31, 2022. )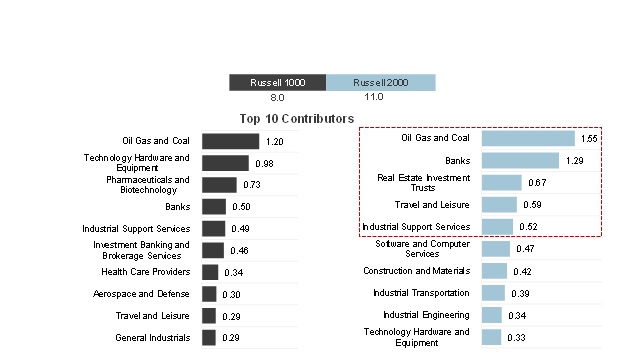
Poised for a sustained comeback?
As our colleague, Catherine Yoshimoto wrote in a recent blog post, after a long stretch of playing second fiddle to large-cap stocks, the case for a more durable revival in US small-cap leadership has grown more compelling. As she points out, smaller US stocks are trading among the lowest valuation multiples relative to US large caps over the past decade, despite significantly stronger consensus earnings growth forecasts. Smaller companies also typically derive a bigger share of their revenues from domestic sources, so their stocks should be less vulnerable to the pressures facing their more multinational peers from the recent surge in the US dollar and gloomier overseas business outlook.
© 2022 London Stock Exchange Group plc and its applicable group undertakings (the “LSE Group”). The LSE Group includes (1) FTSE International Limited (“FTSE”), (2) Frank Russell Company (“Russell”), (3) FTSE Global Debt Capital Markets Inc. and FTSE Global Debt Capital Markets Limited (together, “FTSE Canada”), (4) FTSE Fixed Income Europe Limited (“FTSE FI Europe”), (5) FTSE Fixed Income LLC (“FTSE FI”), (6) The Yield Book Inc (“YB”) and (7) Beyond Ratings S.A.S. (“BR”). All rights reserved.
FTSE Russell® is a trading name of FTSE, Russell, FTSE Canada, FTSE FI, FTSE FI Europe, YB and BR. “FTSE®”, “Russell®”, “FTSE Russell®”, “FTSE4Good®”, “ICB®”, “The Yield Book®”, “Beyond Ratings®” and all other trademarks and service marks used herein (whether registered or unregistered) are trademarks and/or service marks owned or licensed by the applicable member of the LSE Group or their respective licensors and are owned, or used under licence, by FTSE, Russell, FTSE Canada, FTSE FI, FTSE FI Europe, YB or BR. FTSE International Limited is authorised and regulated by the Financial Conduct Authority as a benchmark administrator.
All information is provided for information purposes only. All information and data contained in this publication is obtained by the LSE Group, from sources believed by it to be accurate and reliable. Because of the possibility of human and mechanical error as well as other factors, however, such information and data is provided “as is” without warranty of any kind. No member of the LSE Group nor their respective directors, officers, employees, partners or licensors make any claim, prediction, warranty or representation whatsoever, expressly or impliedly, either as to the accuracy, timeliness, completeness, merchantability of any information or of results to be obtained from the use of FTSE Russell products, including but not limited to indexes, data and analytics, or the fitness or suitability of the FTSE Russell products for any particular purpose to which they might be put. Any representation of historical data accessible through FTSE Russell products is provided for information purposes only and is not a reliable indicator of future performance.
No responsibility or liability can be accepted by any member of the LSE Group nor their respective directors, officers, employees, partners or licensors for (A) any loss or damage in whole or in part caused by, resulting from, or relating to any error (negligent or otherwise) or other circumstance involved in procuring, collecting, compiling, interpreting, analysing, editing, transcribing, transmitting, communicating or delivering any such information or data or from use of this document or links to this document or (B) any direct, indirect, special, consequential or incidental damages whatsoever, even if any member of the LSE Group is advised in advance of the possibility of such damages, resulting from the use of, or inability to use, such information.
No member of the LSE Group nor their respective directors, officers, employees, partners or licensors provide investment advice and nothing in this document should be taken as constituting financial or investment advice. No member of the LSE Group nor their respective directors, officers, employees, partners or licensors make any representation regarding the advisability of investing in any asset or whether such investment creates any legal or compliance risks for the investor. A decision to invest in any such asset should not be made in reliance on any information herein. Indexes cannot be invested in directly. Inclusion of an asset in an index is not a recommendation to buy, sell or hold that asset nor confirmation that any particular investor may lawfully buy, sell or hold the asset or an index containing the asset. The general information contained in this publication should not be acted upon without obtaining specific legal, tax, and investment advice from a licensed professional.
Past performance is no guarantee of future results. Charts and graphs are provided for illustrative purposes only. Index returns shown may not represent the results of the actual trading of investable assets. Certain returns shown may reflect back-tested performance. All performance presented prior to the index inception date is back-tested performance. Back-tested performance is not actual performance but is hypothetical. The back-test calculations are based on the same methodology that was in effect when the index was officially launched. However, back-tested data may reflect the application of the index methodology with the benefit of hindsight, and the historic calculations of an index may change from month to month based on revisions to the underlying economic data used in the calculation of the index.
This document may contain forward-looking assessments. These are based upon a number of assumptions concerning future conditions that ultimately may prove to be inaccurate. Such forward-looking assessments are subject to risks and uncertainties and may be affected by various factors that may cause actual results to differ materially. No member of the LSE Group nor their licensors assume any duty to and do not undertake to update forward-looking assessments.
No part of this information may be reproduced, stored in a retrieval system or transmitted in any form or by any means, electronic, mechanical, photocopying, recording or otherwise, without prior written permission of the applicable member of the LSE Group. Use and distribution of the LSE Group data requires a licence from FTSE, Russell, FTSE Canada, FTSE FI, FTSE FI Europe, YB, BR and/or their respective licensors.
Editor’s Note: The summary bullets for this article were chosen by Seeking Alpha editors.
Be the first to comment